


Food Minerals Market Synopsis
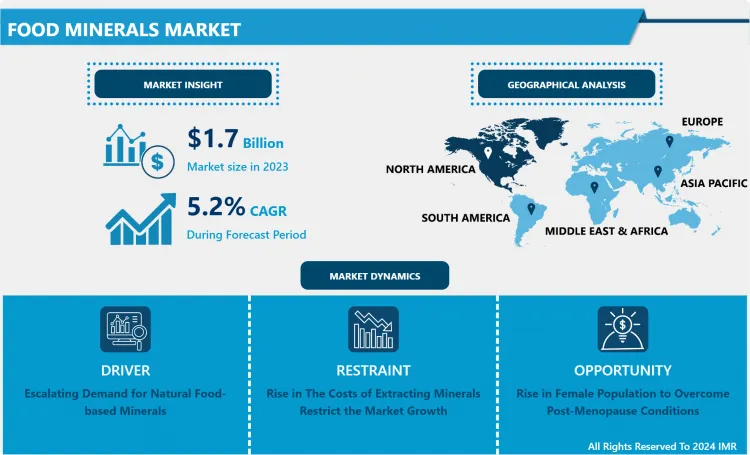
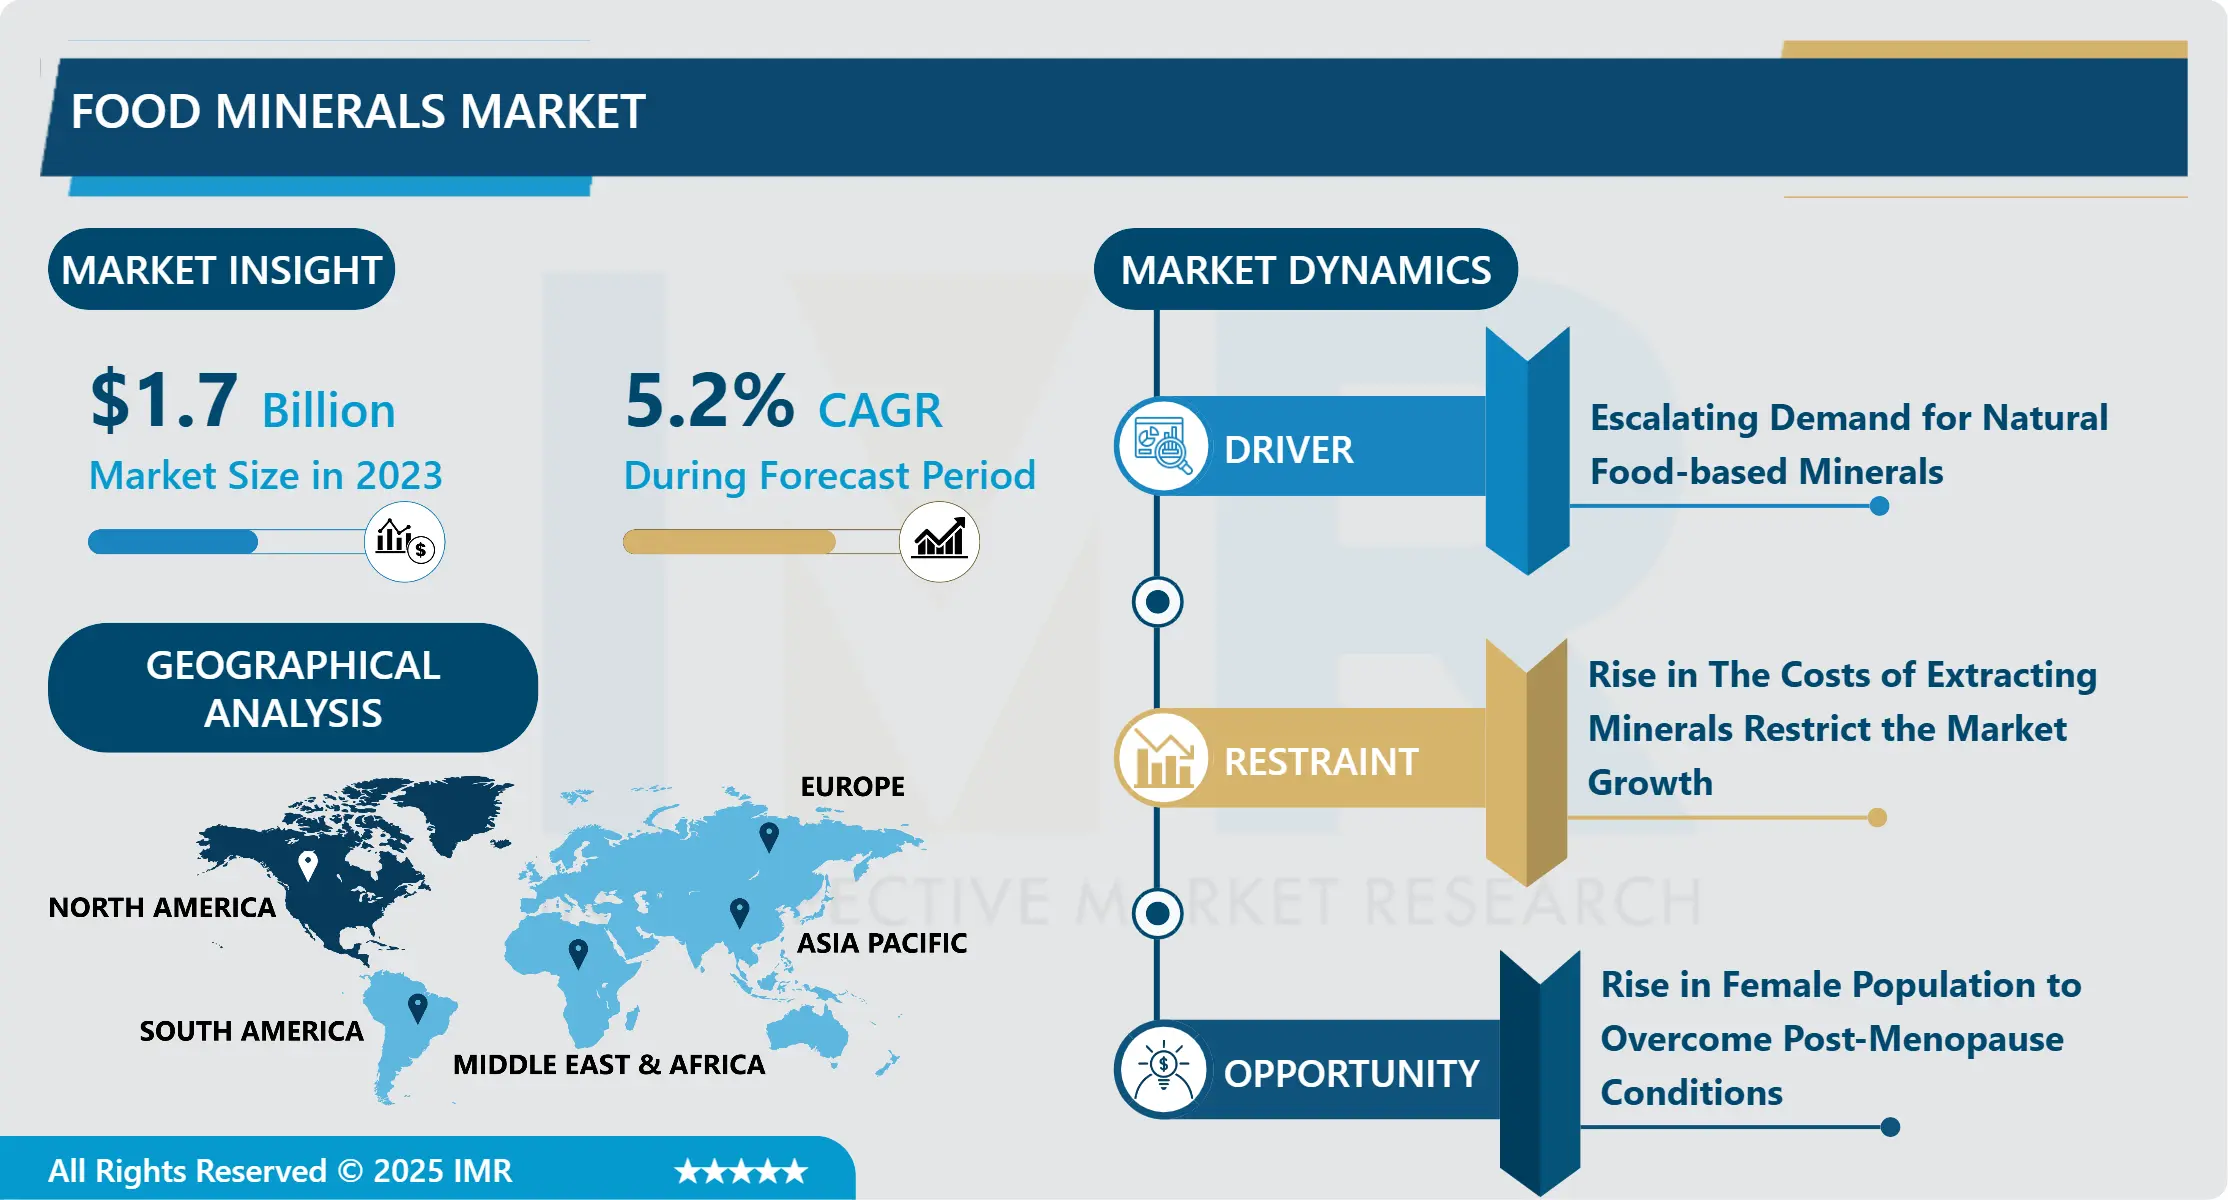
Food Minerals Market Size Was Valued at USD 1.7 Billion in 2024, and is Projected to Reach USD 2.7 Billion by 2032, Growing at a CAGR of 5.2% From 2025-2032.
Food minerals are naturally occurring chemical elements that need to be included in the diet of any individual so as to ensure the right development and functionality of various body organs. Some of the food sources of minerals include the fruits and vegetables, whole grain products, legumes, nuts and seeds, dairy products, lean meat, fish, and seafood. Based on the U. S. Food & Drug Administration’s guidelines, the daily intake of some compounds includes zinc with the recommended quantity being 11 milligrams, magnesium with 420 milligrams, calcium’s recommended dose being 1300 milligrams, iron’s recommended dose being 18 milligrams among others. Thisopposes that sufficient food sources exist as it is well understood that most foods can be consumed in moderation while also identifying that it is essential that proper percentages are maintained to have a sufficient intake of these invaluable minerals for living a healthy lifestyle.
It has been seen that the healthcare costs are increasing and this has been considered to be a key driver to the minerals market. Hence, as per the report of Tennessee Advisory Commission on Intergovernmental Relations, in the U. S. , the overall cost of healthcare was raised in 2019 compared to 2018 and the spending also raised 4. 6% up to $3. 6 trillion. Because of such a sharp increase in health care costs, individuals are turning to mineral and nutrient supplements in order to keep healthy and avert infection and diseases. Hence, the increasing consumer concern to spend more on food supplements, particularly minerals that help prevent diseases and infections, will propel the food minerals market share.
Manufacturers are changing ways in which they market and brand their products to achieve higher sales in different countries. Producers have applied sophisticated strategies to increase consumer demand for mineral supplements by innovating new products and packaging. One of the strategies practiced by producers to attract more consumers is incorporating natural ingredients in the production of minerals which have no negative impacts on the health of consumers. This goes a long way in increasing the revenue of businesses that operate in this sector. All these strategies employed by manufacturers contribute to the food minerals industry as described below.
The consumption of plant-based minerals has improved because more people now are becoming conscious of products that have not been tested on animals and also because of concern for the environment. Growth in the count of people getting immersed in corporate life and giving significance to diet and nutritional needs of the body to avoid health issues also contributes to the food minerals market growth. The market is expected to be driven by growing consumer expenditure in health supplements. The main driving forces that can be seen positively influencing the future growth of the market are the rising health concerns and higher disposable income. The change in consumers’ awareness due to advertisements, social media blogs, YouTube channels, and influencers can be expected to drive the food minerals market demand higher.
Despite the growing demand for food minerals it has not hurdles because fake supplements are available in the market. Since synthetic mineral supplements are directly related to the welfare of consumers, it is crucial to establish the safety of the ingredients and supplement products. Some regulatory agencies like the FDA (Food and Drug Administration) is ensuring that contaminated & hazardous dietary supplements do not reach the market to harm the consumers. But the firms that offer health supplements should adhere to the standards set out in the Dietary Supplement Health and Education Act (DSHEA) and the FDA regulations. Additionally, firms producing dietary supplements need to assess their products to confirm that they are not contaminated and duly labeled for safe consumption. For instance, if a food supplement has a new component incorporated in it, the manufacturers are required to notify the FDA before marketing the food supplement. Therefore, increased regulatory policies on the manufacture of food minerals will negatively affect the expansion of the food minerals market.
Food Minerals Market Trend Analysis
Rise in the logistics channel and development of distribution networks
- The demand for more logistic analysis and an enhancement of how distribution networks like pharmacy, health shops, supermarkets, and websites will also be beneficial for the global food minerals market size during the forecasts timeframe. It has become clear that food minerals of various sorts exhibit anti-inflammatory and anti-oxidizing properties. It assists in lowering high blood pressure levels and also having a good control of blood sugar. The following health benefits can therefore be associated with the consumption of food minerals: enhance eye health, boost memory, reduce the risks of heart diseases and control obesity. Other than this, it assists in managing disorders of the digestion system, heart complications, renal complaints, endocrinal complications, and musculoskeletal comments.
Rise in female population to overcome post menopause conditions
- Increasing concern of female to have food minerals to overcome post menopause conditions also forms market opportunities for food minerals. Common diseases that affect post-menopause female are anemia, osteoporosis, osteoarthritis, fibromyalgia, obesity, and depression. : In the view of the World Health Organization (WHO), 18. According to the worldwide data, women above 60 years have osteoarthritis and among them, only 80% restricted in movement and 25% unable to perform major tasks. The Food and Drug Administration (FDA) noted that women take dietary supplements to treat perimenopausal symptoms in August 2019. Mineral supplement designed to help in the prevention of certain post-menopause related diseases like osteoporosis is likely to enhance acceptance about the women’s healthcare mineral supplements. Sedentary lifestyle and alteration in diet, improper nutrient intake also leads to cases of fertility disorders and other complaints in women. Diseases such as ovarian, breast and cervical cancer among women will boost the growth of the food minerals market forecast.
Food Minerals Market Segment Analysis:
Food Minerals Market is segmented based on Type, Application and Source.
By Type, Magnesium segment is expected to dominate the market during the forecast period
- Based on Type, Zinc, Magnesium, Calcium, Iodine, Copper, Chromium, and Iron are the leading segments in the market. Magnesium is projected to remain the largest Application segment in terms of market share until 2029. This is mainly owed to situations like insomnia, asthma, hypertension, diabetes, and constipation, among others. It is life-imperative because its ions are responsible for releasing the energy chemical, adenosine triphosphate. These magnesium food minerals play an important role in controlling several enzymatic activities which include fatty acid synthesis and proteins, nerve conduction, and food digestion. Magnesium also has applications as an ingredient and/additive that complements energy. It also aids in the maintenance of potassium and sodium balance which has created market demand for mineral-rich foods.
- However, the Zinc segment is expected to grow at a CAGR of 5 percent in comparison to the expected growth rate of more than 6 percent for the Copper and Coal segments. It is expected to reduce by 3% at the end of the forecast period based on the current trend. This influx is acknowledged to be a rise in instances of melancholy and anxiety due to tight programs and unhealthful eating that is expected to stir the market for the zinc mineral supplements due to cortisol and adrenaline functions. The breakdown of neurotransmitters is facilitated by working with vitamin B6 to ensure the proper positioning of these neurotransmitters in the brain thus promoting market growth.
By Application, Pharmaceuticals Industry segment held the largest share in 2024
- Based on the Application, the market has been categorized into Nutraceuticals Industry, Pharmaceuticals Industry, and Food & Beverage Industry. According to market estimations, the Pharmaceuticals Industry segment is anticipated to be the largest in terms of market share by 2029. Among all the transition metal elements, Zinc can be said to be the most commonly used in developing pharmaceutical drugs. Some of the well-known organometallic complexes include gold complexes such as sodium aurothiomalate and auranofin that are used in medication. It is used in the pharmaceutical business as lubricants, desiccants, disintegrants, diluents, binders, pigments, and opacifiers besides emulsifying, thickening, isotonic agents and anticaking negotiators, savour correctors and active ingredient juggernauts.
Food Minerals Market Regional Insights:
North America is Expected to Dominate the Market Over the Forecast period
- The Food Minerals market share of North America would be 48% due to consistent consumption of healthy and nutritional food in the region. To achieve these objectives, the following strategies will be implemented during the forecast period: Total market share is projected to rise to 2%. The commodity market in North American countries including Canada and United States regarding food minerals is expected to expand in the future because of the increasing cases of obesity and consciousness of healthy living elevated in North America, in conjunction with rising end user inclination towards minerals such as magnesium, zinc and calcium. Over all weights continue to rise among youths in the region, especially with emphasis on healthy living and comprehensive weight reduction explanations focusing on general physique well-being. Obesity is one of the main causes of diabetes, hypertension, and other types of heart diseases inclusive of stroke, coronary artery disease, and angina. All of these factors are still subsidizing customer preference shift towards natural mineral products including calcium, magnesium and zinc thereby supporting regional industry development.
Active Key Players in the Food Minerals Market
- Cargill,
- Incorporated
- Waitaki Bio
- SPI Pharma, Inc.
- Archer-Daniels-Midland Company
- Sigma Minerals Limited
- ABF Ingredients Limited
- CalciTech Europe Limited
- Calspar India
- Balchem Corporation
- Adani Pharmachem Private Limited
- Other Active Players
|
Food Minerals Market |
|||
|
Base Year: |
2024 |
Forecast Period: |
2025-2032 |
|
Historical Data: |
2018 to 2024 |
Market Size in 2024: |
USD 1.7 Bn. |
|
Forecast Period 2025-32 CAGR: |
5.2 % |
Market Size in 2032: |
USD 2.7 Bn. |
|
Segments Covered: |
By Type |
|
|
|
By Application |
|
||
|
By Source |
|
||
|
By Region |
|
||
|
Key Market Drivers: |
|
||
|
Key Market Restraints: |
|
||
|
Key Opportunities: |
|
||
|
Companies Covered in the report: |
|
||
Chapter 1: Introduction
1.1 Scope and Coverage
Chapter 2:Executive Summary
Chapter 3: Market Landscape
3.1 Market Dynamics
3.1.1 Drivers
3.1.2 Restraints
3.1.3 Opportunities
3.1.4 Challenges
3.2 Market Trend Analysis
3.3 PESTLE Analysis
3.4 Porter's Five Forces Analysis
3.5 Industry Value Chain Analysis
3.6 Ecosystem
3.7 Regulatory Landscape
3.8 Price Trend Analysis
3.9 Patent Analysis
3.10 Technology Evolution
3.11 Investment Pockets
3.12 Import-Export Analysis
Chapter 4: Food Minerals Market by Type (2018-2032)
4.1 Food Minerals Market Snapshot and Growth Engine
4.2 Market Overview
4.3 Zinc
4.3.1 Introduction and Market Overview
4.3.2 Historic and Forecasted Market Size in Value USD and Volume Units
4.3.3 Key Market Trends, Growth Factors, and Opportunities
4.3.4 Geographic Segmentation Analysis
4.4 Magnesium
4.5 Calcium
4.6 Iodine
4.7 Copper
4.8 Chromium
4.9 Iron
Chapter 5: Food Minerals Market by Application (2018-2032)
5.1 Food Minerals Market Snapshot and Growth Engine
5.2 Market Overview
5.3 Nutraceuticals Industry
5.3.1 Introduction and Market Overview
5.3.2 Historic and Forecasted Market Size in Value USD and Volume Units
5.3.3 Key Market Trends, Growth Factors, and Opportunities
5.3.4 Geographic Segmentation Analysis
5.4 Pharmaceuticals Industry
5.5 Food & Beverage Industry
Chapter 6: Food Minerals Market by Source (2018-2032)
6.1 Food Minerals Market Snapshot and Growth Engine
6.2 Market Overview
6.3 Marine
6.3.1 Introduction and Market Overview
6.3.2 Historic and Forecasted Market Size in Value USD and Volume Units
6.3.3 Key Market Trends, Growth Factors, and Opportunities
6.3.4 Geographic Segmentation Analysis
6.4 Fruits
6.5 Vegetables
6.6 Seaweed
6.7 Nuts
Chapter 7: Company Profiles and Competitive Analysis
7.1 Competitive Landscape
7.1.1 Competitive Benchmarking
7.1.2 Food Minerals Market Share by Manufacturer (2024)
7.1.3 Industry BCG Matrix
7.1.4 Heat Map Analysis
7.1.5 Mergers and Acquisitions
7.2 EFAMOL (UK)
7.2.1 Company Overview
7.2.2 Key Executives
7.2.3 Company Snapshot
7.2.4 Role of the Company in the Market
7.2.5 Sustainability and Social Responsibility
7.2.6 Operating Business Segments
7.2.7 Product Portfolio
7.2.8 Business Performance
7.2.9 Key Strategic Moves and Recent Developments
7.2.10 SWOT Analysis
7.3 MACUSHIELD (UK)
7.4 BASF SE (GERMANY)
7.5 AIDP INC. (U.S.)
7.6 BI NUTRACEUTICALS (U.S.)
7.7 BLUE CALIFORNIA (U.S.)
7.8 AMWAY (US)
7.9 DSM (THE NETHERLANDS)
7.10 ALCON(US)
7.11 SOLGAR(US)
7.12 SWANSON(UKS)
7.13 OTHER KEY PLAYERS
7.14
Chapter 8: Global Food Minerals Market By Region
8.1 Overview
8.2. North America Food Minerals Market
8.2.1 Key Market Trends, Growth Factors and Opportunities
8.2.2 Top Key Companies
8.2.3 Historic and Forecasted Market Size by Segments
8.2.4 Historic and Forecasted Market Size by Type
8.2.4.1 Zinc
8.2.4.2 Magnesium
8.2.4.3 Calcium
8.2.4.4 Iodine
8.2.4.5 Copper
8.2.4.6 Chromium
8.2.4.7 Iron
8.2.5 Historic and Forecasted Market Size by Application
8.2.5.1 Nutraceuticals Industry
8.2.5.2 Pharmaceuticals Industry
8.2.5.3 Food & Beverage Industry
8.2.6 Historic and Forecasted Market Size by Source
8.2.6.1 Marine
8.2.6.2 Fruits
8.2.6.3 Vegetables
8.2.6.4 Seaweed
8.2.6.5 Nuts
8.2.7 Historic and Forecast Market Size by Country
8.2.7.1 US
8.2.7.2 Canada
8.2.7.3 Mexico
8.3. Eastern Europe Food Minerals Market
8.3.1 Key Market Trends, Growth Factors and Opportunities
8.3.2 Top Key Companies
8.3.3 Historic and Forecasted Market Size by Segments
8.3.4 Historic and Forecasted Market Size by Type
8.3.4.1 Zinc
8.3.4.2 Magnesium
8.3.4.3 Calcium
8.3.4.4 Iodine
8.3.4.5 Copper
8.3.4.6 Chromium
8.3.4.7 Iron
8.3.5 Historic and Forecasted Market Size by Application
8.3.5.1 Nutraceuticals Industry
8.3.5.2 Pharmaceuticals Industry
8.3.5.3 Food & Beverage Industry
8.3.6 Historic and Forecasted Market Size by Source
8.3.6.1 Marine
8.3.6.2 Fruits
8.3.6.3 Vegetables
8.3.6.4 Seaweed
8.3.6.5 Nuts
8.3.7 Historic and Forecast Market Size by Country
8.3.7.1 Russia
8.3.7.2 Bulgaria
8.3.7.3 The Czech Republic
8.3.7.4 Hungary
8.3.7.5 Poland
8.3.7.6 Romania
8.3.7.7 Rest of Eastern Europe
8.4. Western Europe Food Minerals Market
8.4.1 Key Market Trends, Growth Factors and Opportunities
8.4.2 Top Key Companies
8.4.3 Historic and Forecasted Market Size by Segments
8.4.4 Historic and Forecasted Market Size by Type
8.4.4.1 Zinc
8.4.4.2 Magnesium
8.4.4.3 Calcium
8.4.4.4 Iodine
8.4.4.5 Copper
8.4.4.6 Chromium
8.4.4.7 Iron
8.4.5 Historic and Forecasted Market Size by Application
8.4.5.1 Nutraceuticals Industry
8.4.5.2 Pharmaceuticals Industry
8.4.5.3 Food & Beverage Industry
8.4.6 Historic and Forecasted Market Size by Source
8.4.6.1 Marine
8.4.6.2 Fruits
8.4.6.3 Vegetables
8.4.6.4 Seaweed
8.4.6.5 Nuts
8.4.7 Historic and Forecast Market Size by Country
8.4.7.1 Germany
8.4.7.2 UK
8.4.7.3 France
8.4.7.4 The Netherlands
8.4.7.5 Italy
8.4.7.6 Spain
8.4.7.7 Rest of Western Europe
8.5. Asia Pacific Food Minerals Market
8.5.1 Key Market Trends, Growth Factors and Opportunities
8.5.2 Top Key Companies
8.5.3 Historic and Forecasted Market Size by Segments
8.5.4 Historic and Forecasted Market Size by Type
8.5.4.1 Zinc
8.5.4.2 Magnesium
8.5.4.3 Calcium
8.5.4.4 Iodine
8.5.4.5 Copper
8.5.4.6 Chromium
8.5.4.7 Iron
8.5.5 Historic and Forecasted Market Size by Application
8.5.5.1 Nutraceuticals Industry
8.5.5.2 Pharmaceuticals Industry
8.5.5.3 Food & Beverage Industry
8.5.6 Historic and Forecasted Market Size by Source
8.5.6.1 Marine
8.5.6.2 Fruits
8.5.6.3 Vegetables
8.5.6.4 Seaweed
8.5.6.5 Nuts
8.5.7 Historic and Forecast Market Size by Country
8.5.7.1 China
8.5.7.2 India
8.5.7.3 Japan
8.5.7.4 South Korea
8.5.7.5 Malaysia
8.5.7.6 Thailand
8.5.7.7 Vietnam
8.5.7.8 The Philippines
8.5.7.9 Australia
8.5.7.10 New Zealand
8.5.7.11 Rest of APAC
8.6. Middle East & Africa Food Minerals Market
8.6.1 Key Market Trends, Growth Factors and Opportunities
8.6.2 Top Key Companies
8.6.3 Historic and Forecasted Market Size by Segments
8.6.4 Historic and Forecasted Market Size by Type
8.6.4.1 Zinc
8.6.4.2 Magnesium
8.6.4.3 Calcium
8.6.4.4 Iodine
8.6.4.5 Copper
8.6.4.6 Chromium
8.6.4.7 Iron
8.6.5 Historic and Forecasted Market Size by Application
8.6.5.1 Nutraceuticals Industry
8.6.5.2 Pharmaceuticals Industry
8.6.5.3 Food & Beverage Industry
8.6.6 Historic and Forecasted Market Size by Source
8.6.6.1 Marine
8.6.6.2 Fruits
8.6.6.3 Vegetables
8.6.6.4 Seaweed
8.6.6.5 Nuts
8.6.7 Historic and Forecast Market Size by Country
8.6.7.1 Turkiye
8.6.7.2 Bahrain
8.6.7.3 Kuwait
8.6.7.4 Saudi Arabia
8.6.7.5 Qatar
8.6.7.6 UAE
8.6.7.7 Israel
8.6.7.8 South Africa
8.7. South America Food Minerals Market
8.7.1 Key Market Trends, Growth Factors and Opportunities
8.7.2 Top Key Companies
8.7.3 Historic and Forecasted Market Size by Segments
8.7.4 Historic and Forecasted Market Size by Type
8.7.4.1 Zinc
8.7.4.2 Magnesium
8.7.4.3 Calcium
8.7.4.4 Iodine
8.7.4.5 Copper
8.7.4.6 Chromium
8.7.4.7 Iron
8.7.5 Historic and Forecasted Market Size by Application
8.7.5.1 Nutraceuticals Industry
8.7.5.2 Pharmaceuticals Industry
8.7.5.3 Food & Beverage Industry
8.7.6 Historic and Forecasted Market Size by Source
8.7.6.1 Marine
8.7.6.2 Fruits
8.7.6.3 Vegetables
8.7.6.4 Seaweed
8.7.6.5 Nuts
8.7.7 Historic and Forecast Market Size by Country
8.7.7.1 Brazil
8.7.7.2 Argentina
8.7.7.3 Rest of SA
Chapter 9 Analyst Viewpoint and Conclusion
9.1 Recommendations and Concluding Analysis
9.2 Potential Market Strategies
Chapter 10 Research Methodology
10.1 Research Process
10.2 Primary Research
10.3 Secondary Research
|
Food Minerals Market |
|||
|
Base Year: |
2024 |
Forecast Period: |
2025-2032 |
|
Historical Data: |
2018 to 2024 |
Market Size in 2024: |
USD 1.7 Bn. |
|
Forecast Period 2025-32 CAGR: |
5.2 % |
Market Size in 2032: |
USD 2.7 Bn. |
|
Segments Covered: |
By Type |
|
|
|
By Application |
|
||
|
By Source |
|
||
|
By Region |
|
||
|
Key Market Drivers: |
|
||
|
Key Market Restraints: |
|
||
|
Key Opportunities: |
|
||
|
Companies Covered in the report: |
|
||


