


Food Antioxidant Market Overview
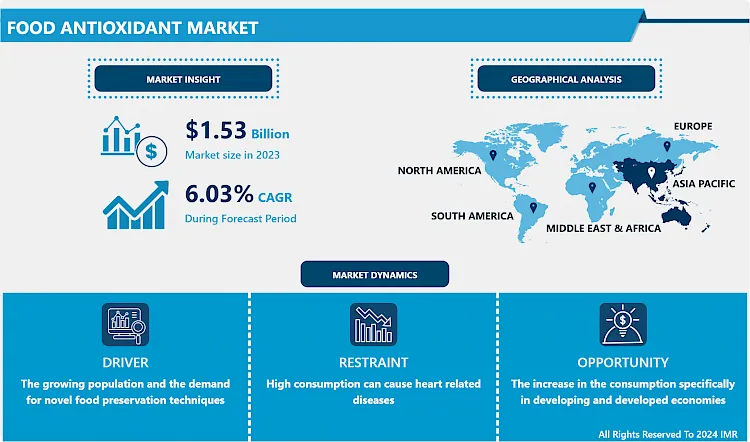
The Global Food Antioxidants market was estimated at USD 1.62 billion in 2024, and is anticipated to reach USD 2.59 billion by 2032, growing at a CAGR of 6.03% over the analysis period 2025-2032.
Antioxidants are natural compounds that minimize damage caused owing to oxygen. It is often referred to as a substance that obstructs oxidation it prevents chemical reaction obtained by free radicals that leads to chain reaction thereby damaging the cells of organisms. It aids to neutralize free radicals in our body. The popular antioxidants are vitamin C, vitamin E, and beta carotene which can prevent the damaging effects of oxidation. Owing to their high stability and low volatility, the antioxidants support to maintain the level of nutrients, the color, functionality, taste, freshness, aroma, texture, and appeal to consumers such as the older person, ceteris paribus. Furthermore, antioxidants are not only in food additives but are also to begin in food supplements and levels should be measured, as such, in body tissues and fluids. In addition, lesser-known sources of antioxidants to that cited in reference abound, for instance, black chokeberry (Aronia melanocarpa) found in jams, juices, purees, and along with, containing high levels of polyphenols and flavonoids, has the ability to interventive value for a range of chronic diseases such as diabetes and cardiovascular diseases which leads to the growth of the market over the forecast period. Fermented grain food supplements also hold antioxidants, e.g., Antioxidant Biofactor, lowering lipid oxidation by searching upon the peroxyl radical.

Market Dynamics and Factors for the Food Antioxidant Market:
Drivers:
- The world economic decline had a low effect on the global antioxidants market and the market for antioxidants is anticipated to continue to witness growth over the forecast period. However, shifting eating patterns are influencing the market growth regionally, owing to switching diet patterns, urbanization and population, and economic growth.
- Owing to rising life expectancy and strong growth of the agriculture sector, the demand for feed antioxidants in the global meat industry is anticipated to grow over the forecast period. India and Brazil are amongst the global rapidly emerging economies and are witnessing continuous growth in their per capita income. This may cause a standard shift in dietary preferences in these economies.
- Antioxidants are applied to food products to preserve their nutrients, flavor, and freshness, thereby intercepting food wastage and extending their overall shelf life. In many situations, two or more antioxidants are used in a food product to boost their food quality protection standards. Preservatives are also used in commercial products to maintain their freshness for a longer time and protect them from bacteria. Antioxidant support prevents oxidation of food containing fat or oil and thereby, prevents it from going foul-smelling.
- Apart from that, they prevent the browning of vegetables, cut fruit and fruit juices, and improve their shelf life. For instance, vitamin C, which is also called ascorbic acid, helps recycle vitamin E. Ascorbates, such as vitamin C, help to detach oxygen through the self-oxidation process. For instance, monosodium glutamate is used in processed foods, such as soups, sausages, and sauces. Due to these applications, the demand for antioxidants is anticipated to observe a surge globally, mainly from the packaged food industry.
Restraints:
- Some antioxidants are somehow can be high in different food products. Consuming large amounts of antioxidants continuously can grow triglyceride levels, a type of fat in the bloodstream. It raises the risk of heart disease and it can also poorly affect dental health. These are some of the factors that are hampering the growth of the market.
Opportunity:
- Rising demand in developing economies for food antioxidants. Though awareness regarding food antioxidants is low, developing economies such as China and India are facing high industrialization. As these developing economies grow and gain high disposable income, their demand for food antioxidants is also growing. The APAC region is displaying increased demand for prepared and functional foods & beverages, and thus, the region's food antioxidants market is anticipated to grow. The demand for food antioxidants is anticipated to grow at a quiet pace in early acquiring countries such as Japan, Germany, and a fractional rate in new & developing markets such as Thailand, Malaysia, and other Asian economies.
- Furthermore, the rising world population is putting more pressure on manufacturers for the preparation, extraction, and maintenance of scarce resources. Growing energy prices and increasing raw material costs are affecting food prices, thus impacting low-income consumers. Pressure on food supplies is being compounded by water shortages, particularly over Africa and Northern Asia. Advances in science and technology are helping in improving the shelf life of foods to a greater extent. The requirement for marketing food preservatives to the smallest of food & beverage manufacturers will expand the market size.
Market Segmentation
- Based on Type, the synthetic segment accounted for the maximum share in the food antioxidant market. Synthetic food antioxidants are manufactured from petroleum-based products. They are utilized primarily in the food industry to delay lipid oxidation for stabilizing and preserving refined fats & oils within a food system/product. The maximum acceptable limit for synthetic antioxidants varies greatly over countries and is dependent on the food it is being used in. Four types of synthetic antioxidants are mostly used in foods such as BHA, BHT, PG, and TBHQ.
- Based on Application, the prepared meat & poultry segment accounted for the maximum market share as well as the highest growth rate in the food antioxidants market. The usage of antioxidants can improve the shelf life of meat & poultry products. Prepared meat & poultry products comprising of fat along with unsaturated fatty acids undergo oxidative degradation during storage. Antioxidants hinder lipid oxidation and minimize rancidity without any unacceptable impact on the nutritional or sensory properties, resulting in quality preservation and boost the shelf life of meat & poultry products.
- Based on Form, the dry segment dominates the food antioxidant market over the forecast period. Numerous synthetic food antioxidants are in the dry form, which incorporates fine granular, fine powder, flakes, and tablets. The dry segment recorded a market share in the year 2018. It observes higher demand among food producers, as they are easy to mix with various food products such as prepared meat & poultry products, bakery & confectionery, prepared snacks, and are easy to store and handle. The producers process them to convert them into a form highly suitable for stakeholders.
- Based on Source, the market is categorized into fruits and vegetables, oils, spices & herbs, botanical extracts, gallic acids, nuts & seeds, and petroleum. There are various natural sources from where antioxidants are obtained. Depending on the further application, the source is decided. Fruits and vegetables and nuts and seeds are utilized as they are. Oils are usually added to prepared foods to enhance their shelf life and inhibit oxidation.
Players Covered in Food Antioxidant market are :
- VDH Chem Tech Pvt Ltd (India)
- Yasho Industries (India)
- Nagase Group (Japan)
- Fooodchem International Corporation (US)
- Guangzhou ZIO Chemicals Co. Ltd (China)
- Koninklijke DSM N.V. (Netherlands)
- Kemin Industries Inc. (the US)
- DuPont (US)
- Eastman Chemical Company (US)
- Barentz Group (Netherlands)
- Camlin Fine Sciences (India)
- Kalsec Inc. (US)
- Frutarom Ltd (Israel)
- BTSA (Spain)
- Archer-Daniels-Midland Company (US)
- Vitablend Nederland BV (Netherlands)
- Sasol Limited (South Africa)
- Advanced Organic Materials (Germany)
- Crystal Quinone Pvt Ltd. (India)
- Oxiris Chemicals S.A (Spain)
- Pharmorgana GmBH (Germany)
- Naturex (France)
- BASF SE (Germany)
- 3A Antioxidants (US) and Other major players.
Regional Analysis for Food Antioxidant Market:
In the Asia Pacific region, the food & beverages sector is greatly impacted by the consumer preference for healthy consumption, the trend towards natural and organic foods, and the rising need for convenience food products. With developing countries, increasing industrialization, rising urge for processed foods, and consumer preference for quality products, ingredient suppliers are becoming growingly optimistic about the growth of the food & beverage industry. These trends and preferences have generated a need for new additives in foods, despite the growing consciousness regarding the health hazards related to synthetic food additives.
Key Industry Developments of the Food Antioxidant Market:
- In July 2024, DuPont Nutrition & Health highlighted groundbreaking solutions for the food and beverage industry at the IFT18 Food Expo, Booth S1062. The company introduced new innovations, including POWERBake 6000 enzymes, CHOOZIT SWIFT 600 cultures, and GUARDIAN TOCO 30P antioxidants. DuPont’s protein experts participated in three educational sessions on plant-based protein, discussing the latest trends in meat alternatives and food applications.
- In September 2023, INEOS Group announced the acquisition of the Eastman Texas City site, including a 600kt Acetic Acid plant and associated third-party activities, for approximately $500 million. The deal, which also includes a Memorandum of Understanding for a long-term vinyl acetate monomer supply agreement, is set to close by the end of 2023, pending regulatory approval. INEOS plans to invest in and expand the site, with all employees transferring to INEOS post-transaction.
|
Food Antioxidant Market |
|||
|
Base Year: |
2024 |
Forecast Period: |
2025-2032 |
|
Historical Data: |
2018 to 2023 |
Market Size in 2024: |
USD 1.62 billion |
|
Forecast Period 2024-32 CAGR: |
6.03 % |
Market Size in 2032: |
USD 2.59 billion |
|
Segments Covered: |
By Type |
|
|
|
By Application |
|
||
|
By Source |
|
||
|
By Form |
|
||
|
By Region |
|
||
|
Key Market Drivers: |
|
||
|
Key Market Restraints: |
|
||
|
Key Opportunities: |
|
||
|
Companies Covered in the report: |
|
||
Chapter 1: Introduction
1.1 Scope and Coverage
Chapter 2:Executive Summary
Chapter 3: Market Landscape
3.1 Market Dynamics
3.1.1 Drivers
3.1.2 Restraints
3.1.3 Opportunities
3.1.4 Challenges
3.2 Market Trend Analysis
3.3 PESTLE Analysis
3.4 Porter's Five Forces Analysis
3.5 Industry Value Chain Analysis
3.6 Ecosystem
3.7 Regulatory Landscape
3.8 Price Trend Analysis
3.9 Patent Analysis
3.10 Technology Evolution
3.11 Investment Pockets
3.12 Import-Export Analysis
Chapter 4: Food Antioxidant Market by Type (2018-2032)
4.1 Food Antioxidant Market Snapshot and Growth Engine
4.2 Market Overview
4.3 Natural
4.3.1 Introduction and Market Overview
4.3.2 Historic and Forecasted Market Size in Value USD and Volume Units
4.3.3 Key Market Trends, Growth Factors, and Opportunities
4.3.4 Geographic Segmentation Analysis
4.4 Synthetic
Chapter 5: Food Antioxidant Market by Application (2018-2032)
5.1 Food Antioxidant Market Snapshot and Growth Engine
5.2 Market Overview
5.3 Prepared Foods
5.3.1 Introduction and Market Overview
5.3.2 Historic and Forecasted Market Size in Value USD and Volume Units
5.3.3 Key Market Trends, Growth Factors, and Opportunities
5.3.4 Geographic Segmentation Analysis
5.4 Prepared Meat & Poultry
5.5 Fats & Oils
5.6 Beverages
5.7 Bakery 7 Confectionery
5.8 Seafood And
5.9 Others
Chapter 6: Food Antioxidant Market by Source (2018-2032)
6.1 Food Antioxidant Market Snapshot and Growth Engine
6.2 Market Overview
6.3 Fruits & Vegetables
6.3.1 Introduction and Market Overview
6.3.2 Historic and Forecasted Market Size in Value USD and Volume Units
6.3.3 Key Market Trends, Growth Factors, and Opportunities
6.3.4 Geographic Segmentation Analysis
6.4 Oils
6.5 Spices & Herbs
6.6 Botanical Extracts
6.7 Gallic Acids
6.8 Nuts & Seeds
6.9 Petroleum
Chapter 7: Food Antioxidant Market by Form (2018-2032)
7.1 Food Antioxidant Market Snapshot and Growth Engine
7.2 Market Overview
7.3 Dry
7.3.1 Introduction and Market Overview
7.3.2 Historic and Forecasted Market Size in Value USD and Volume Units
7.3.3 Key Market Trends, Growth Factors, and Opportunities
7.3.4 Geographic Segmentation Analysis
7.4 Liquid
Chapter 8: Company Profiles and Competitive Analysis
8.1 Competitive Landscape
8.1.1 Competitive Benchmarking
8.1.2 Food Antioxidant Market Share by Manufacturer (2024)
8.1.3 Industry BCG Matrix
8.1.4 Heat Map Analysis
8.1.5 Mergers and Acquisitions
8.2 HARMONY WHOLE FOODS MARKET (CANADA)
8.2.1 Company Overview
8.2.2 Key Executives
8.2.3 Company Snapshot
8.2.4 Role of the Company in the Market
8.2.5 Sustainability and Social Responsibility
8.2.6 Operating Business Segments
8.2.7 Product Portfolio
8.2.8 Business Performance
8.2.9 Key Strategic Moves and Recent Developments
8.2.10 SWOT Analysis
8.3 AVANTI POLAR LIPIDS INC (ALABAMA)
8.4 KEWPIE CORPORATION (JAPAN)
8.5 VITAMIN RESEARCH PRODUCTS (US)
8.6 NOF AMERICA CORPORATION (US)
8.7 NATURAL FACTORS (CANADA)
8.8 JENA BIOSCIENCE GMBH (GERMANY)
8.9 KEWPIE CORPORATION (JAPAN)
8.10 NUTRASAL INC (US)
8.11 LIPOID (SWITZERLAND)
8.12 OTHERS MAJOR PLAYERS
Chapter 9: Global Food Antioxidant Market By Region
9.1 Overview
9.2. North America Food Antioxidant Market
9.2.1 Key Market Trends, Growth Factors and Opportunities
9.2.2 Top Key Companies
9.2.3 Historic and Forecasted Market Size by Segments
9.2.4 Historic and Forecasted Market Size by Type
9.2.4.1 Natural
9.2.4.2 Synthetic
9.2.5 Historic and Forecasted Market Size by Application
9.2.5.1 Prepared Foods
9.2.5.2 Prepared Meat & Poultry
9.2.5.3 Fats & Oils
9.2.5.4 Beverages
9.2.5.5 Bakery 7 Confectionery
9.2.5.6 Seafood And
9.2.5.7 Others
9.2.6 Historic and Forecasted Market Size by Source
9.2.6.1 Fruits & Vegetables
9.2.6.2 Oils
9.2.6.3 Spices & Herbs
9.2.6.4 Botanical Extracts
9.2.6.5 Gallic Acids
9.2.6.6 Nuts & Seeds
9.2.6.7 Petroleum
9.2.7 Historic and Forecasted Market Size by Form
9.2.7.1 Dry
9.2.7.2 Liquid
9.2.8 Historic and Forecast Market Size by Country
9.2.8.1 US
9.2.8.2 Canada
9.2.8.3 Mexico
9.3. Eastern Europe Food Antioxidant Market
9.3.1 Key Market Trends, Growth Factors and Opportunities
9.3.2 Top Key Companies
9.3.3 Historic and Forecasted Market Size by Segments
9.3.4 Historic and Forecasted Market Size by Type
9.3.4.1 Natural
9.3.4.2 Synthetic
9.3.5 Historic and Forecasted Market Size by Application
9.3.5.1 Prepared Foods
9.3.5.2 Prepared Meat & Poultry
9.3.5.3 Fats & Oils
9.3.5.4 Beverages
9.3.5.5 Bakery 7 Confectionery
9.3.5.6 Seafood And
9.3.5.7 Others
9.3.6 Historic and Forecasted Market Size by Source
9.3.6.1 Fruits & Vegetables
9.3.6.2 Oils
9.3.6.3 Spices & Herbs
9.3.6.4 Botanical Extracts
9.3.6.5 Gallic Acids
9.3.6.6 Nuts & Seeds
9.3.6.7 Petroleum
9.3.7 Historic and Forecasted Market Size by Form
9.3.7.1 Dry
9.3.7.2 Liquid
9.3.8 Historic and Forecast Market Size by Country
9.3.8.1 Russia
9.3.8.2 Bulgaria
9.3.8.3 The Czech Republic
9.3.8.4 Hungary
9.3.8.5 Poland
9.3.8.6 Romania
9.3.8.7 Rest of Eastern Europe
9.4. Western Europe Food Antioxidant Market
9.4.1 Key Market Trends, Growth Factors and Opportunities
9.4.2 Top Key Companies
9.4.3 Historic and Forecasted Market Size by Segments
9.4.4 Historic and Forecasted Market Size by Type
9.4.4.1 Natural
9.4.4.2 Synthetic
9.4.5 Historic and Forecasted Market Size by Application
9.4.5.1 Prepared Foods
9.4.5.2 Prepared Meat & Poultry
9.4.5.3 Fats & Oils
9.4.5.4 Beverages
9.4.5.5 Bakery 7 Confectionery
9.4.5.6 Seafood And
9.4.5.7 Others
9.4.6 Historic and Forecasted Market Size by Source
9.4.6.1 Fruits & Vegetables
9.4.6.2 Oils
9.4.6.3 Spices & Herbs
9.4.6.4 Botanical Extracts
9.4.6.5 Gallic Acids
9.4.6.6 Nuts & Seeds
9.4.6.7 Petroleum
9.4.7 Historic and Forecasted Market Size by Form
9.4.7.1 Dry
9.4.7.2 Liquid
9.4.8 Historic and Forecast Market Size by Country
9.4.8.1 Germany
9.4.8.2 UK
9.4.8.3 France
9.4.8.4 The Netherlands
9.4.8.5 Italy
9.4.8.6 Spain
9.4.8.7 Rest of Western Europe
9.5. Asia Pacific Food Antioxidant Market
9.5.1 Key Market Trends, Growth Factors and Opportunities
9.5.2 Top Key Companies
9.5.3 Historic and Forecasted Market Size by Segments
9.5.4 Historic and Forecasted Market Size by Type
9.5.4.1 Natural
9.5.4.2 Synthetic
9.5.5 Historic and Forecasted Market Size by Application
9.5.5.1 Prepared Foods
9.5.5.2 Prepared Meat & Poultry
9.5.5.3 Fats & Oils
9.5.5.4 Beverages
9.5.5.5 Bakery 7 Confectionery
9.5.5.6 Seafood And
9.5.5.7 Others
9.5.6 Historic and Forecasted Market Size by Source
9.5.6.1 Fruits & Vegetables
9.5.6.2 Oils
9.5.6.3 Spices & Herbs
9.5.6.4 Botanical Extracts
9.5.6.5 Gallic Acids
9.5.6.6 Nuts & Seeds
9.5.6.7 Petroleum
9.5.7 Historic and Forecasted Market Size by Form
9.5.7.1 Dry
9.5.7.2 Liquid
9.5.8 Historic and Forecast Market Size by Country
9.5.8.1 China
9.5.8.2 India
9.5.8.3 Japan
9.5.8.4 South Korea
9.5.8.5 Malaysia
9.5.8.6 Thailand
9.5.8.7 Vietnam
9.5.8.8 The Philippines
9.5.8.9 Australia
9.5.8.10 New Zealand
9.5.8.11 Rest of APAC
9.6. Middle East & Africa Food Antioxidant Market
9.6.1 Key Market Trends, Growth Factors and Opportunities
9.6.2 Top Key Companies
9.6.3 Historic and Forecasted Market Size by Segments
9.6.4 Historic and Forecasted Market Size by Type
9.6.4.1 Natural
9.6.4.2 Synthetic
9.6.5 Historic and Forecasted Market Size by Application
9.6.5.1 Prepared Foods
9.6.5.2 Prepared Meat & Poultry
9.6.5.3 Fats & Oils
9.6.5.4 Beverages
9.6.5.5 Bakery 7 Confectionery
9.6.5.6 Seafood And
9.6.5.7 Others
9.6.6 Historic and Forecasted Market Size by Source
9.6.6.1 Fruits & Vegetables
9.6.6.2 Oils
9.6.6.3 Spices & Herbs
9.6.6.4 Botanical Extracts
9.6.6.5 Gallic Acids
9.6.6.6 Nuts & Seeds
9.6.6.7 Petroleum
9.6.7 Historic and Forecasted Market Size by Form
9.6.7.1 Dry
9.6.7.2 Liquid
9.6.8 Historic and Forecast Market Size by Country
9.6.8.1 Turkiye
9.6.8.2 Bahrain
9.6.8.3 Kuwait
9.6.8.4 Saudi Arabia
9.6.8.5 Qatar
9.6.8.6 UAE
9.6.8.7 Israel
9.6.8.8 South Africa
9.7. South America Food Antioxidant Market
9.7.1 Key Market Trends, Growth Factors and Opportunities
9.7.2 Top Key Companies
9.7.3 Historic and Forecasted Market Size by Segments
9.7.4 Historic and Forecasted Market Size by Type
9.7.4.1 Natural
9.7.4.2 Synthetic
9.7.5 Historic and Forecasted Market Size by Application
9.7.5.1 Prepared Foods
9.7.5.2 Prepared Meat & Poultry
9.7.5.3 Fats & Oils
9.7.5.4 Beverages
9.7.5.5 Bakery 7 Confectionery
9.7.5.6 Seafood And
9.7.5.7 Others
9.7.6 Historic and Forecasted Market Size by Source
9.7.6.1 Fruits & Vegetables
9.7.6.2 Oils
9.7.6.3 Spices & Herbs
9.7.6.4 Botanical Extracts
9.7.6.5 Gallic Acids
9.7.6.6 Nuts & Seeds
9.7.6.7 Petroleum
9.7.7 Historic and Forecasted Market Size by Form
9.7.7.1 Dry
9.7.7.2 Liquid
9.7.8 Historic and Forecast Market Size by Country
9.7.8.1 Brazil
9.7.8.2 Argentina
9.7.8.3 Rest of SA
Chapter 10 Analyst Viewpoint and Conclusion
10.1 Recommendations and Concluding Analysis
10.2 Potential Market Strategies
Chapter 11 Research Methodology
11.1 Research Process
11.2 Primary Research
11.3 Secondary Research
|
Food Antioxidant Market |
|||
|
Base Year: |
2024 |
Forecast Period: |
2025-2032 |
|
Historical Data: |
2018 to 2023 |
Market Size in 2024: |
USD 1.62 billion |
|
Forecast Period 2024-32 CAGR: |
6.03 % |
Market Size in 2032: |
USD 2.59 billion |
|
Segments Covered: |
By Type |
|
|
|
By Application |
|
||
|
By Source |
|
||
|
By Form |
|
||
|
By Region |
|
||
|
Key Market Drivers: |
|
||
|
Key Market Restraints: |
|
||
|
Key Opportunities: |
|
||
|
Companies Covered in the report: |
|
||


