


Family Office Market Synopsis
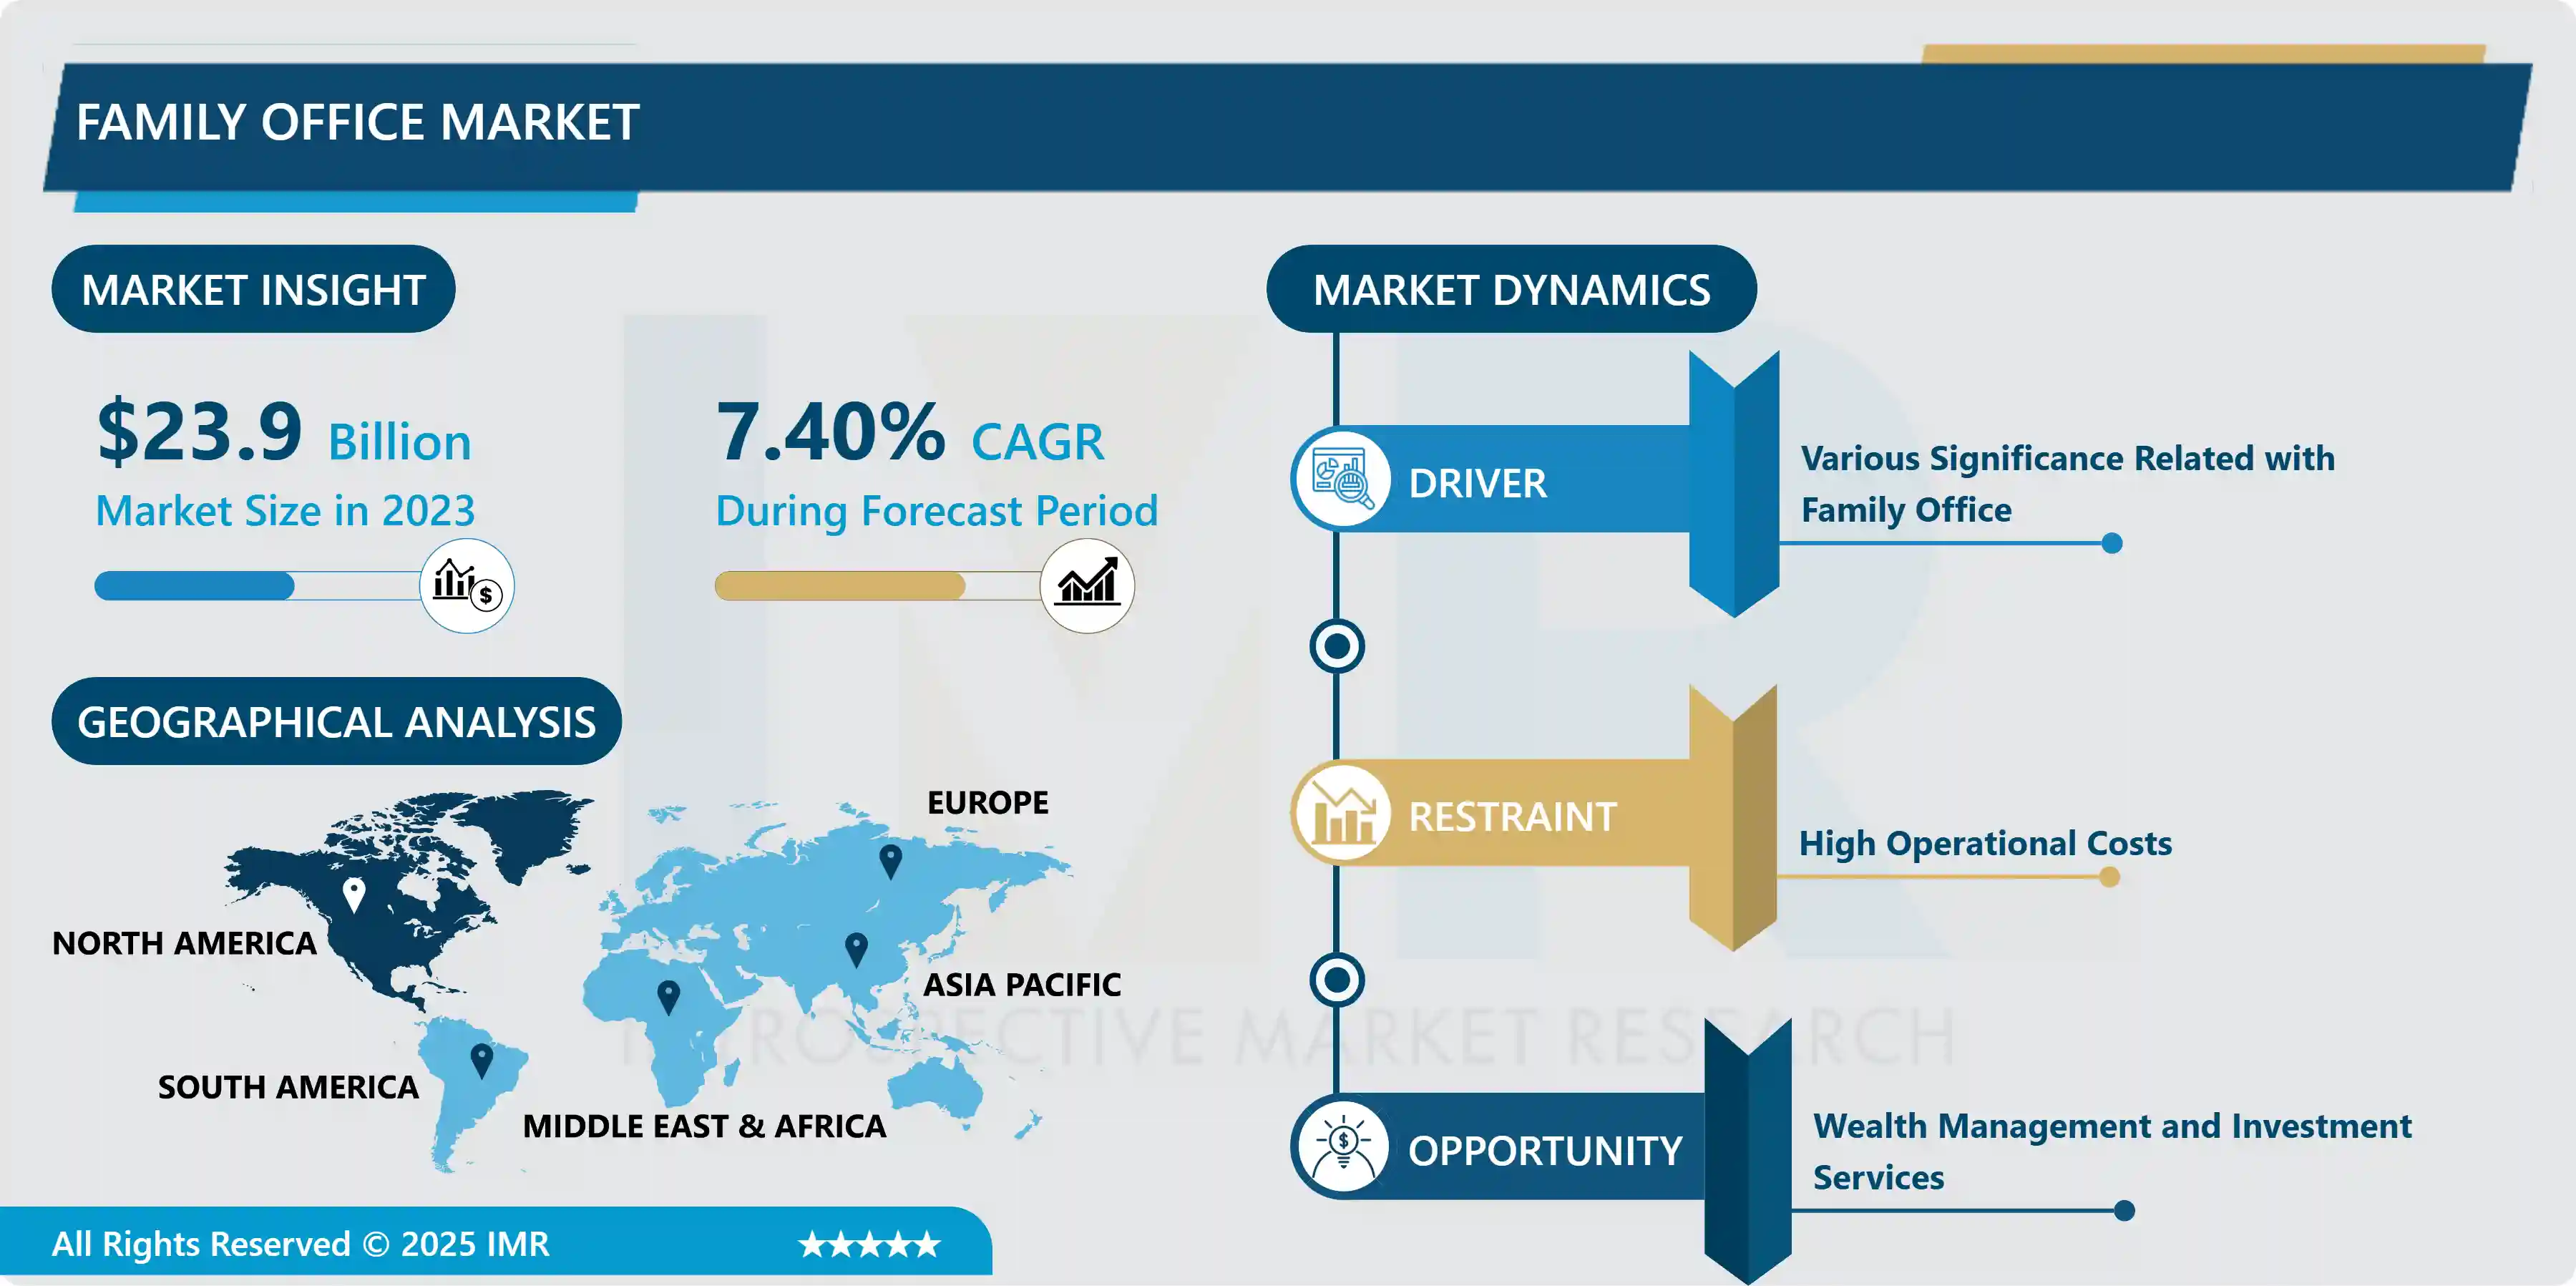
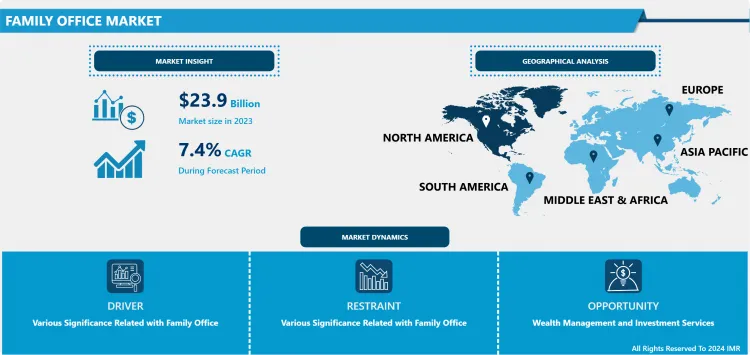
Family Office Market Was Valued at USD 23.9 Billion in 2023 and is Projected to Reach USD 45.44 Billion by 2032, Growing at a CAGR of 7.4% from 2024 to 2032.
A family office is a privately held corporation that manages the investments and fortune of a wealthy family, often with over $100 million in investable assets, to effectively grow and transfer wealth across generations. The family's wealth serves as the company's financial capital.
Management of household staff, travel arrangements, property management, day-to-day accounting and payroll activities, management of legal affairs, family management services, family governance, financial and investor education, coordination of philanthropy and private foundations, and succession planning are all examples of tasks that family offices may handle.
Family Offices are becoming a very significant force within the global business landscape, now managing almost half of the $9 trillion controlled by the world’s billionaires. EY estimates that there are currently 10,000 family offices, a ten-fold increase since 2008. The demand for family office services is being driven by the expanding number of UHNWIs (private wealth advisory firms). Because they have a shaky faith in private banks, wealthy families are increasingly turning to family offices to handle their fortune.
The industry is beset by a slew of legal, technological, and operational issues that are projected to stymie the market's expansion. In comparison to private equity, direct investments are stand-alone investments with good returns. Direct investments account for more than 65% of high-net-worth individuals' assets. It allows them to leverage their assets and helps the market become more varied around the world.
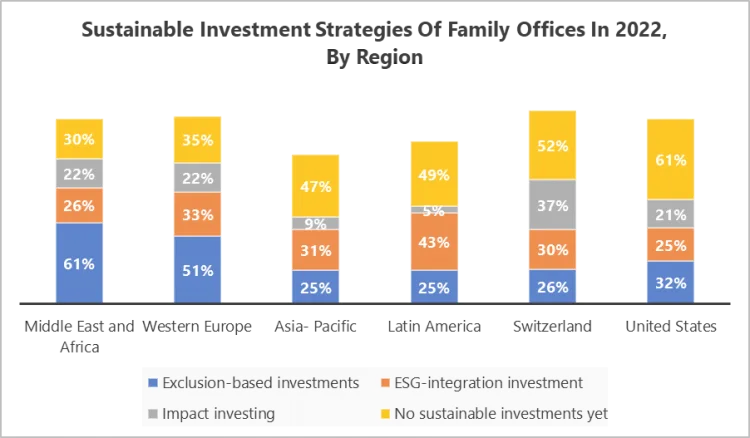
The given graph shows that the Exclusion-based investments was the most common sustainable investment strategy among family offices in Middle East and Africa, Western Europe, and the United States as of 2022, while environmental, social and governance (ESG) integration was the most common strategy in Latin America and the Asia-Pacific region. The United States had the highest share of family offices without sustainable investments, at 61 percent.
Family Office Market Trend Analysis
Various Significance Related with Family Office
- In the asset management of HNWIs, the family office plays an essential role. It also assists HNWIs with succession planning within their businesses as they grow into new regions throughout the world. With a growing interest in sustainability and impact investing, wealthy families are establishing family offices.
- The majority of family offices are formed as a result of succession planning and wealth transfer from one generation to the next. Furthermore, family offices give greater confidentiality and privacy, as well as higher returns, while also ensuring effective governance and better alignment of interests. It also solves a wide variety of financial services complexity requested by HNWIs. The worldwide family office market is expected to increase as a result of such reasons.
Wealth Management and Investment Services Create an Opportunity Family Office Market
- Wealth management and investment services present significant opportunities for the Family Office market in the current financial landscape. As high-net-worth individuals and families seek to optimize their financial portfolios, the demand for sophisticated wealth management solutions has grown. Family offices, with their tailored and comprehensive approach, are well-positioned to address these needs.
- In the realm of wealth management, Family Offices offer personalized investment strategies, risk management, and financial planning services, aligning with the unique goals and preferences of affluent clients. The integration of technology, data analytics, and innovative investment instruments further enhances the efficiency and effectiveness of these services.
- Moreover, the global investment landscape has become increasingly complex, with diverse asset classes and evolving market conditions. Family offices, equipped with expert advisors and extensive resources, can navigate this complexity to identify lucrative investment opportunities while managing risks. The emphasis on long-term wealth preservation and multi-generational planning makes family offices vital partners in securing and growing the financial legacies of affluent families.
Family Office Market Segment Analysis:
Family Office Market Segmented on the basis of type, Asset Classification.
By Type, single-family segment is expected to dominate the market during the forecast period
- the single-family office segment is expected to register the maximum family office market share during the forecast period. The single-family office market is primarily driven by the expanding need for wealth management, which is fueled by the growing number of billionaires. There is a considerable increase in the growth of single-family offices, which is driving the growth of the market, with numerous new organizations and enterprises being created every day.
- When establishing investments, single-family offices use either periodically adjusted term sheets or conventional protection standards. Family services such as accounting and tax management are provided by the majority of single-family offices, which are followed by succession planning.
By Asset Classification, alternative assets segment held the largest share of 45% in 2022
- Alternative assets classification segment is anticipated to register the maximum family office market share over the forecast period. Family offices are engaging specialized investment professionals to maintain and safeguard the family legacy, trust, and provide concierge services due to the evolution of asset classification, where family offices are changing from traditional asset management services to alternative asset classes. Almost a third of family offices participate in alternative assets, which will help the sector flourish.
Family Office Market Regional Insights:
North America is Expected to Dominate the Market Over the Forecast period
- North America is poised to dominate the family office market, reflecting a confluence of factors that position the region as a key player in wealth management. The robust economic landscape, technological advancements, and a concentration of high-net-worth individuals contribute to North America's prominence in this sector. The region's sophisticated financial infrastructure and a mature ecosystem of family offices further enhance its dominance.
- The United States, in particular, stands out as a hub for family offices, driven by a dynamic entrepreneurial culture and a history of successful wealth creation. The increasing complexity of financial instruments and the need for specialized services also play into the hands of family offices, making them indispensable for managing substantial fortunes. Regulatory stability and a well-established legal framework add to the attractiveness of North America for family office operations.
- As wealth continues to grow in the region, family offices are becoming integral to preserving and growing assets, providing a range of services from investment management to estate planning. North America's ascendancy in the family office market is indicative of its strategic position in global wealth management and its ability to cater to the diverse needs of affluent individuals and families.
Family Office Market Top Key Players:
- Campbell Family & Associates (USA)
- U.S. Trust - Bank of America Private Wealth Management (USA)
- Bespoke Wealth Management (USA)
- JPMorgan Chase Wealth Management (USA)
- Northern Trust Wealth Management (USA)
- Wells Fargo Private Bank(USA)
- Bessemer Trust (USA)
- Citi Private Bank (USA)
- BNY Mellon Wealth Management (USA)
- PNC Wealth Management (USA)
- Merrill Lynch Wealth Management (USA)
- Morgan Stanley Wealth Management (USA)
- Goldman Sachs Family Office (USA)
- Schroders Family Office (UK)
- Eaton Family Office (USA)
- Rockefeller Capital Management (USA)
- Prestige Family Office (USA)
- Tiedemann Trust (USA)
- GenSpring Family Offices (USA)
- Moss Adams LLP (, USA)
- Lord Abbett & Co. LLC (USA)
- Seix Investment Advisors (USA)
- Flexstone Partners (Switzerland)
- Credit Suisse Family Office (Switzerland)
- UBS Family Office (Switzerland)
Key Industry Developments in the Family Office Market:
- In October 2023, U.S. Trust Bank (Bank of America Private Wealth Management): Partnered with AI-powered wealth management platform "Abbove" to offer holistic financial planning solutions to their family office clients.
- In September 2023, Northern Trust: Launched "NT Invest", a digital wealth management platform for family offices and high-net-worth individuals, providing access to alternative investments and private market opportunities.
|
Family Office Market |
|||
|
Base Year: |
2023 |
Forecast Period: |
2024-2032 |
|
Historical Data: |
2017 to 2023 |
Market Size in 2023: |
USD 23.9 Billion |
|
Forecast Period 2024-32 CAGR: |
7.4 % |
Market Size in 2032: |
USD 45.44 Billion |
|
Segments Covered: |
By Type |
|
|
|
By Asset Classification |
|
||
|
By Region |
|
||
|
Key Market Drivers: |
|
||
|
Key Market Restraints: |
|
||
|
Key Opportunities: |
|
||
|
Companies Covered in the report: |
|
||
Chapter 1: Introduction
1.1 Scope and Coverage
Chapter 2:Executive Summary
Chapter 3: Market Landscape
3.1 Market Dynamics
3.1.1 Drivers
3.1.2 Restraints
3.1.3 Opportunities
3.1.4 Challenges
3.2 Market Trend Analysis
3.3 PESTLE Analysis
3.4 Porter's Five Forces Analysis
3.5 Industry Value Chain Analysis
3.6 Ecosystem
3.7 Regulatory Landscape
3.8 Price Trend Analysis
3.9 Patent Analysis
3.10 Technology Evolution
3.11 Investment Pockets
3.12 Import-Export Analysis
Chapter 4: Family Office Market by Type (2018-2032)
4.1 Family Office Market Snapshot and Growth Engine
4.2 Market Overview
4.3 Multi-Family Office
4.3.1 Introduction and Market Overview
4.3.2 Historic and Forecasted Market Size in Value USD and Volume Units
4.3.3 Key Market Trends, Growth Factors, and Opportunities
4.3.4 Geographic Segmentation Analysis
4.4 Single Family Office
4.5 Embedded Family Office
Chapter 5: Family Office Market by Asset Classification (2018-2032)
5.1 Family Office Market Snapshot and Growth Engine
5.2 Market Overview
5.3 Alternative Asset Classification
5.3.1 Introduction and Market Overview
5.3.2 Historic and Forecasted Market Size in Value USD and Volume Units
5.3.3 Key Market Trends, Growth Factors, and Opportunities
5.3.4 Geographic Segmentation Analysis
5.4 Traditional Asset Classification
5.5 Precious Metals
5.6 Art & Artifacts
Chapter 6: Company Profiles and Competitive Analysis
6.1 Competitive Landscape
6.1.1 Competitive Benchmarking
6.1.2 Family Office Market Share by Manufacturer (2024)
6.1.3 Industry BCG Matrix
6.1.4 Heat Map Analysis
6.1.5 Mergers and Acquisitions
6.2 ALFRED KARCHER GMBH & CO. KG
6.2.1 Company Overview
6.2.2 Key Executives
6.2.3 Company Snapshot
6.2.4 Role of the Company in the Market
6.2.5 Sustainability and Social Responsibility
6.2.6 Operating Business Segments
6.2.7 Product Portfolio
6.2.8 Business Performance
6.2.9 Key Strategic Moves and Recent Developments
6.2.10 SWOT Analysis
6.3 ALKOTA CLEANING SYSTEMS INCMI-T-M CORPORATION
6.4 ANDREAS STIHL AG & CO. KG
6.5 ANNOVI REVERBERI SPA
6.6 BRIGGS & STRATTON CORPORATION
6.7 CAMPBELL HAUSFELD
6.8 DEERE & COMPANY
6.9 FNA GROUP
6.10 GENERAC POWER SYSTEMS INCIP CLEANING SRL
6.11 HITACHI KOKI CO. LTDHUSQVARNA AB
6.12 KOBLENZ ELECTRICA SA DE CVLAVORGROUP
6.13 NILFISK A/S
6.14 ROBERT BOSCH GMBH
6.15 SIMONIZ
6.16 SNOW JOE
6.17 STANLEY BLACK & DECKER INCTECHTRONIC INDUSTRIES CO. LTDVAX LTDAND OTHERS MAJOR PLAYERS
Chapter 7: Global Family Office Market By Region
7.1 Overview
7.2. North America Family Office Market
7.2.1 Key Market Trends, Growth Factors and Opportunities
7.2.2 Top Key Companies
7.2.3 Historic and Forecasted Market Size by Segments
7.2.4 Historic and Forecasted Market Size by Type
7.2.4.1 Multi-Family Office
7.2.4.2 Single Family Office
7.2.4.3 Embedded Family Office
7.2.5 Historic and Forecasted Market Size by Asset Classification
7.2.5.1 Alternative Asset Classification
7.2.5.2 Traditional Asset Classification
7.2.5.3 Precious Metals
7.2.5.4 Art & Artifacts
7.2.6 Historic and Forecast Market Size by Country
7.2.6.1 US
7.2.6.2 Canada
7.2.6.3 Mexico
7.3. Eastern Europe Family Office Market
7.3.1 Key Market Trends, Growth Factors and Opportunities
7.3.2 Top Key Companies
7.3.3 Historic and Forecasted Market Size by Segments
7.3.4 Historic and Forecasted Market Size by Type
7.3.4.1 Multi-Family Office
7.3.4.2 Single Family Office
7.3.4.3 Embedded Family Office
7.3.5 Historic and Forecasted Market Size by Asset Classification
7.3.5.1 Alternative Asset Classification
7.3.5.2 Traditional Asset Classification
7.3.5.3 Precious Metals
7.3.5.4 Art & Artifacts
7.3.6 Historic and Forecast Market Size by Country
7.3.6.1 Russia
7.3.6.2 Bulgaria
7.3.6.3 The Czech Republic
7.3.6.4 Hungary
7.3.6.5 Poland
7.3.6.6 Romania
7.3.6.7 Rest of Eastern Europe
7.4. Western Europe Family Office Market
7.4.1 Key Market Trends, Growth Factors and Opportunities
7.4.2 Top Key Companies
7.4.3 Historic and Forecasted Market Size by Segments
7.4.4 Historic and Forecasted Market Size by Type
7.4.4.1 Multi-Family Office
7.4.4.2 Single Family Office
7.4.4.3 Embedded Family Office
7.4.5 Historic and Forecasted Market Size by Asset Classification
7.4.5.1 Alternative Asset Classification
7.4.5.2 Traditional Asset Classification
7.4.5.3 Precious Metals
7.4.5.4 Art & Artifacts
7.4.6 Historic and Forecast Market Size by Country
7.4.6.1 Germany
7.4.6.2 UK
7.4.6.3 France
7.4.6.4 The Netherlands
7.4.6.5 Italy
7.4.6.6 Spain
7.4.6.7 Rest of Western Europe
7.5. Asia Pacific Family Office Market
7.5.1 Key Market Trends, Growth Factors and Opportunities
7.5.2 Top Key Companies
7.5.3 Historic and Forecasted Market Size by Segments
7.5.4 Historic and Forecasted Market Size by Type
7.5.4.1 Multi-Family Office
7.5.4.2 Single Family Office
7.5.4.3 Embedded Family Office
7.5.5 Historic and Forecasted Market Size by Asset Classification
7.5.5.1 Alternative Asset Classification
7.5.5.2 Traditional Asset Classification
7.5.5.3 Precious Metals
7.5.5.4 Art & Artifacts
7.5.6 Historic and Forecast Market Size by Country
7.5.6.1 China
7.5.6.2 India
7.5.6.3 Japan
7.5.6.4 South Korea
7.5.6.5 Malaysia
7.5.6.6 Thailand
7.5.6.7 Vietnam
7.5.6.8 The Philippines
7.5.6.9 Australia
7.5.6.10 New Zealand
7.5.6.11 Rest of APAC
7.6. Middle East & Africa Family Office Market
7.6.1 Key Market Trends, Growth Factors and Opportunities
7.6.2 Top Key Companies
7.6.3 Historic and Forecasted Market Size by Segments
7.6.4 Historic and Forecasted Market Size by Type
7.6.4.1 Multi-Family Office
7.6.4.2 Single Family Office
7.6.4.3 Embedded Family Office
7.6.5 Historic and Forecasted Market Size by Asset Classification
7.6.5.1 Alternative Asset Classification
7.6.5.2 Traditional Asset Classification
7.6.5.3 Precious Metals
7.6.5.4 Art & Artifacts
7.6.6 Historic and Forecast Market Size by Country
7.6.6.1 Turkiye
7.6.6.2 Bahrain
7.6.6.3 Kuwait
7.6.6.4 Saudi Arabia
7.6.6.5 Qatar
7.6.6.6 UAE
7.6.6.7 Israel
7.6.6.8 South Africa
7.7. South America Family Office Market
7.7.1 Key Market Trends, Growth Factors and Opportunities
7.7.2 Top Key Companies
7.7.3 Historic and Forecasted Market Size by Segments
7.7.4 Historic and Forecasted Market Size by Type
7.7.4.1 Multi-Family Office
7.7.4.2 Single Family Office
7.7.4.3 Embedded Family Office
7.7.5 Historic and Forecasted Market Size by Asset Classification
7.7.5.1 Alternative Asset Classification
7.7.5.2 Traditional Asset Classification
7.7.5.3 Precious Metals
7.7.5.4 Art & Artifacts
7.7.6 Historic and Forecast Market Size by Country
7.7.6.1 Brazil
7.7.6.2 Argentina
7.7.6.3 Rest of SA
Chapter 8 Analyst Viewpoint and Conclusion
8.1 Recommendations and Concluding Analysis
8.2 Potential Market Strategies
Chapter 9 Research Methodology
9.1 Research Process
9.2 Primary Research
9.3 Secondary Research
|
Family Office Market |
|||
|
Base Year: |
2023 |
Forecast Period: |
2024-2032 |
|
Historical Data: |
2017 to 2023 |
Market Size in 2023: |
USD 23.9 Billion |
|
Forecast Period 2024-32 CAGR: |
7.4 % |
Market Size in 2032: |
USD 45.44 Billion |
|
Segments Covered: |
By Type |
|
|
|
By Asset Classification |
|
||
|
By Region |
|
||
|
Key Market Drivers: |
|
||
|
Key Market Restraints: |
|
||
|
Key Opportunities: |
|
||
|
Companies Covered in the report: |
|
||


