


Shared Office Space Market Synopsis
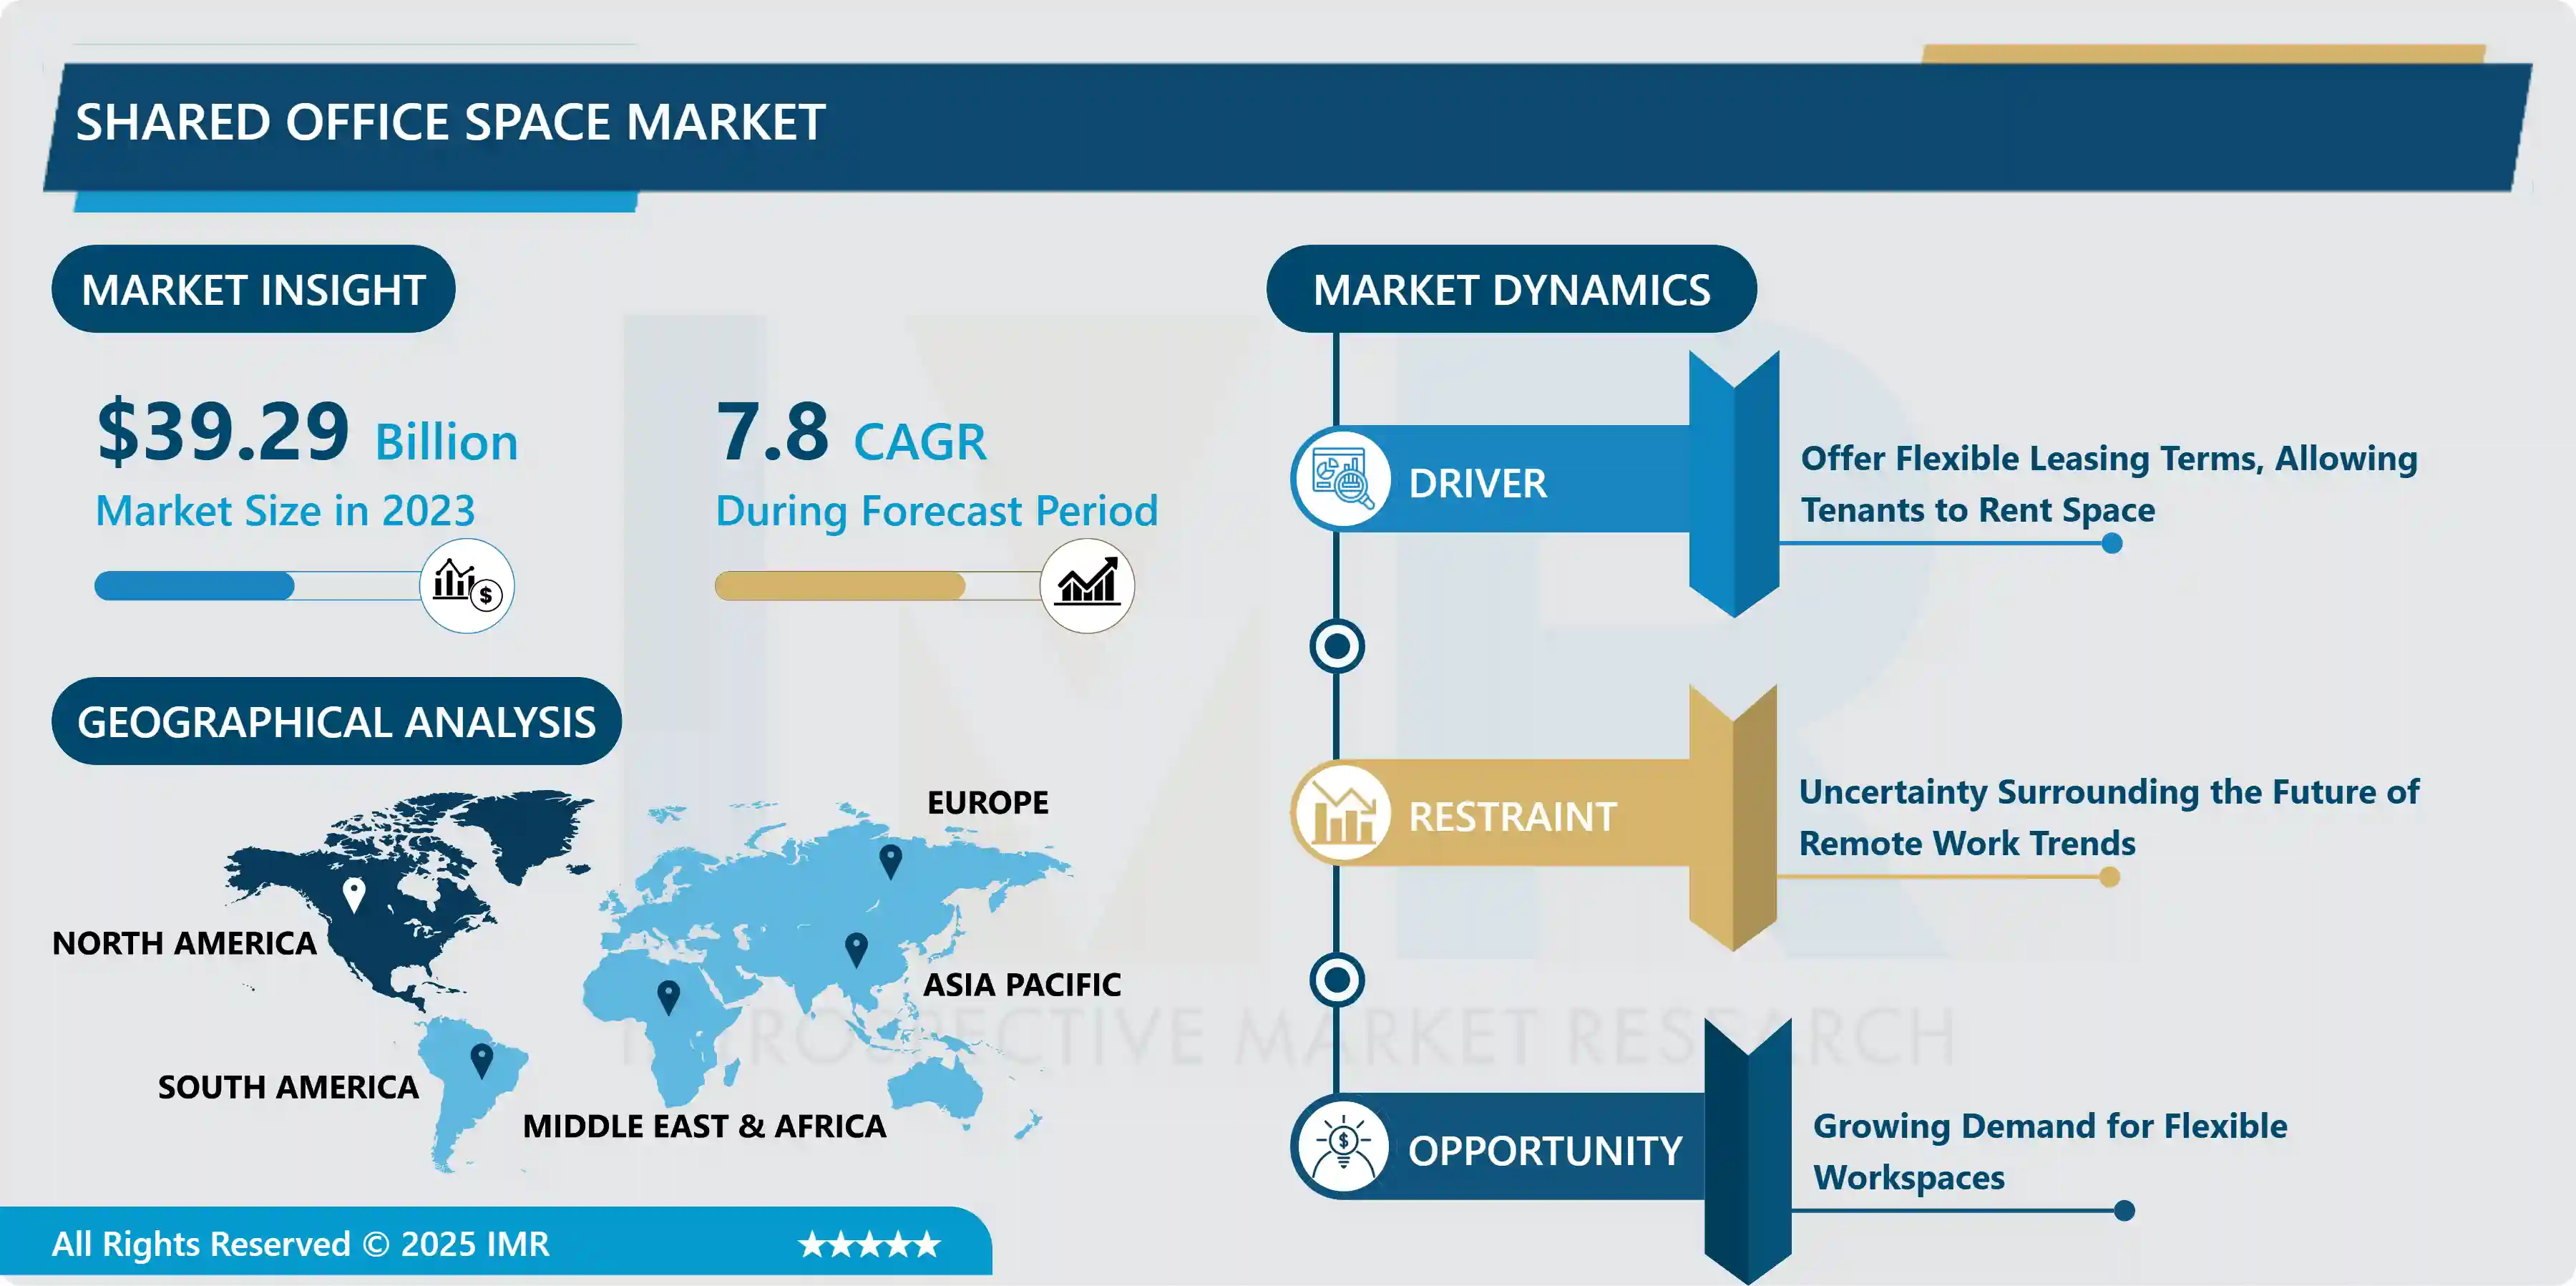
Shared Office Space Market Size Was Valued at USD 39.29 Billion in 2023, and is Projected to Reach USD 66.47 Billion by 2032, Growing at a CAGR of 7.8% From 2024-2032.
Shared office space refers to a flexible workspace arrangement where multiple individuals or companies share a common office environment. These spaces typically provide amenities such as desks, meeting rooms, and communal areas, offering professionals a cost-effective and collaborative alternative to traditional office leases.
Shared office spaces, also known as coworking spaces, are gaining popularity due to their flexibility, cost-effectiveness, and collaborative environments. They are used by freelancers, remote workers, startups, small businesses, remote teams, and traveling professionals. Freelancers and remote workers can use these spaces as an alternative to traditional offices, providing a professional environment with amenities like desks, chairs, and high-speed internet. Startups can benefit from these spaces, offering affordable office solutions, networking opportunities, mentorship, and access to resources. Small businesses can rent desks, private offices, or meeting rooms on a short-term or long-term basis without committing to a traditional lease.
Remote teams can use these spaces as a central hub for collaboration, fostering communication and camaraderie. Networking and community-building opportunities are also provided by shared office spaces, hosting events, workshops, and social gatherings. Temporary workspaces are available for business travelers, while large corporations can rent dedicated desks or private offices without the overhead costs of leasing and maintaining a traditional office space. Shared office spaces foster creativity, innovation, and collaboration by bringing together individuals from different industries and backgrounds.
The demand for shared office spaces, or coworking spaces, has increased due to their flexibility, cost-effectiveness, community, and networking opportunities. These spaces offer short-term lease terms, making them attractive to freelancers, startups, and small businesses who don't want to commit to long-term leases or incur overhead costs. They also provide a cost-effective alternative to traditional office leases, allowing tenants to rent desks, offices, or meeting rooms as needed, reducing overhead expenses. coworking spaces enhance the perceived credibility and professionalism of tenants, making them an attractive option for freelancers and small businesses.
Coworking spaces foster a sense of community and collaboration among tenants, allowing for knowledge sharing and collaboration on projects. They offer access to amenities and services, such as high-speed internet, printing facilities, meeting rooms, kitchen areas, and onsite staff. They can accommodate businesses of various sizes, allowing tenants to easily scale up or down as their needs change. Location flexibility is another advantage of coworking spaces, as many are located in prime urban centers or near public transportation hubs. These spaces prioritize work-life balance, offering ergonomic furniture, natural lighting, and communal areas for relaxation or socializing.

Shared Office Space Market Trend Analysis
Offer Flexible Leasing Terms, Allowing Tenants to Rent Space
- Shared office spaces, also known as coworking spaces, have gained popularity due to their flexibility in leasing terms. These spaces cater to the diverse needs of tenants, offering shorter lease durations ranging from daily to hourly. This flexibility allows tenants to scale their space usage according to fluctuating business needs, such as temporary projects or team expansions. Unlike traditional office leases, coworking spaces do not involve long-term commitments, allowing tenants to rent space for a duration that suits their specific needs.
- Flexible leasing terms eliminate the need for large upfront investments or ongoing overhead expenses associated with traditional office spaces, allowing tenants to access professional work environments on a pay-as-you-go basis. This allows tenants to scale their operations quickly and adapt to changing market conditions with minimal disruption. This is particularly beneficial for startups, freelancers, and small businesses with limited budgets or uncertain growth trajectories.
- Flexible leasing terms also foster a dynamic and collaborative environment, attracting entrepreneurs, freelancers, and remote workers seeking shared experiences and collaborative opportunities. the provision of flexible leasing terms has significantly contributed to the growth and popularity of shared office spaces.
Restraints
Uncertainty Surrounding the Future of Remote Work Trends
- The companies decide to return to traditional office settings or adopt hybrid work models, the demand for shared office spaces may decrease, affecting occupancy rates and revenue streams for coworking providers. Economic instability and fluctuating market conditions can influence companies' decisions regarding office space requirements, leading to decreased demand for shared office spaces and increased competition among providers.
- Advancements in remote work technology, such as virtual collaboration tools and cloud-based productivity software, may lead some companies to invest more in remote work infrastructure. Tenant preferences may evolve, with some preferring the convenience of remote work while others prefer in-person collaboration. Coworking providers must adapt their offerings to align with changing tenant preferences and expectations. Regulatory and health concerns can impact the operations and viability of shared office spaces, creating challenges in capacity limits, sanitation protocols, and business continuity planning.
Opportunity
Growing Demand for Flexible Workspaces
- The rise of remote work, driven by technological advancements and changing work-life balance attitudes, has led to a growing demand for flexible work arrangements. Professionals are seeking on-demand access to workspaces that accommodate their changing schedules and locations. The gig economy has seen substantial growth, with more individuals opting for freelancing, consulting, or starting their businesses.
- Shared office spaces offer cost-effective and professional environments for independent professionals, allowing them to work, collaborate, and network with like-minded individuals. Shared office spaces are cost-efficient for startups and SMEs, offering a flexible solution to expand or downsize their workspace without long-term leases or upfront costs.
- Shared office spaces are available in various locations, including urban centers, suburban areas, and remote destinations, enhancing accessibility and convenience for users. Larger corporations are also recognizing the benefits of flexible workspaces for accommodating remote teams, project-based work, or satellite offices, driving expansion and investment in the industry. They foster a sense of community and collaboration among tenants, facilitating networking opportunities, knowledge sharing, and potential partnerships.
Challenges
Managing and Maintaining Shared Office Spaces can be Expensive
- Managing and maintaining shared office spaces can be a significant challenge for coworking providers due to various factors. These include facility costs, such as leasing or owning commercial real estate in desirable locations, and the cost of fitting out and furnishing the space. Maintenance and repairs are also necessary to ensure the space remains clean, safe, and functional.
- Shared office spaces often offer amenities and services to attract tenants and differentiate themselves in the market. These services incur ongoing operational costs. Staffing is another significant expense, as managing a shared office space requires personnel to handle administrative tasks, customer service, facility management, and community engagement.
- Community building is another significant challenge for coworking spaces. Successful spaces invest in building a vibrant and supportive community among their members, which requires resources and coordination. To address these challenges, providers can employ strategies such as efficient space utilization, economies of scale, technology integration, sustainable practices, and revenue diversification.
Shared Office Space Market Segment Analysis:
Shared Office Space Market Segmented based on amenities, location, and specialized.
By Amenities, Industry-specific Facilities segment is expected to dominate the market during the forecast period
- Employee Management Software is a crucial tool for coworking space operators, enhancing operational efficiency, reducing manual errors, and allocating resources more effectively. This leads to cost savings and better service delivery, enhancing the overall experience for tenants and attracting more clients. Coworking spaces are investing in amenities to promote employee well-being and satisfaction, such as fitness centers, wellness rooms, recreational areas, and on-site cafes.
- Industry-specific facilities cater to the unique needs of different business sectors, such as technology, healthcare, creative arts, and finance. These specialized spaces offer unique facilities, attract niche communities, and differentiate themselves from generic office spaces. These amenities help create a positive work-life balance, foster social connections, and increase tenant retention rates.
- As the workforce becomes more mobile and remote, organizations are seeking flexible office solutions that can adapt to their evolving needs. Employee Management Software enables seamless booking of desks, meeting rooms, and amenities on-demand, providing tenants with flexibility and choice. Offering value-added services and facilities can give coworking space operators a competitive advantage, commanding premium pricing, increasing occupancy rates, and establishing a strong brand presence in the market.
By Location, Urban Centers segment held the largest share of 54.2% in 2023
- Urban centers, often situated in prime business districts or commercial hubs, offer convenient access to transportation networks, amenities, and services, making shared office spaces a popular choice for professionals and businesses. These areas attract a diverse range of businesses, startups, freelancers, and entrepreneurs, creating a dynamic ecosystem of collaboration and networking.
- The presence of a business in an urban center enhances its perceived credibility and prestige, attracting clients, investors, and top talent. Urban shared office spaces provide a wide range of amenities and infrastructure, such as high-speed internet, meeting rooms, event spaces, coworking areas, cafes, fitness centers, and concierge services. These amenities enhance the value proposition of urban office spaces and attract tenants seeking a comprehensive workspace solution.
- Urban centers also offer flexibility in lease terms, workspace configurations, and scalability, appealing to startups, small businesses, and remote teams seeking agile workspace solutions. The proximity to a thriving ecosystem of business support services, such as legal, financial, marketing, consulting firms, industry associations, incubators, and accelerators, further benefits shared office spaces in urban areas.
Shared Office Space Market Regional Insights:
North America is Expected to Dominate the Market Over the Forecast Period
- North America, particularly the US, is a major hub for coworking spaces, with cities like New York City, San Francisco, and Los Angeles emerging as major hubs. The market is mature, with well-established operators like WeWork, Industrious, and Knotel offering a wide range of options to businesses, freelancers, and remote workers. The region's entrepreneurial culture and high concentration of startups, technology companies, and creative industries make coworking spaces an ideal environment for these businesses.
- The demand for flexible workspaces is driven by the rise of remote work, freelancing, and the gig economy. The densely populated urban centers in North America, such as New York City, San Francisco, Chicago, and Toronto, have high demand for coworking spaces due to limited office space availability and high real estate costs. Large corporations are also adopting hybrid work models, combining remote work with office-based collaboration, leading to increased demand for coworking spaces that can accommodate flexible and on-demand access for employees.
Shared Office Space Market Top Key Players:
- WeWork (US)
- NeueHouse (US)
- The Farm SoHo (US)
- Serendipity Labs (US)
- Venture X (US)
- Launch Workplaces (US)
- Greendesk (US)
- The Wing (US)
- MakeOffices (US)
- Bond Collective (US)
- Alley (US)
- Industrious Office (US)
- Knotel (US)
- Convene (US)
- Industrious (US)
- TechSpace (US)
- Novel Coworking (US)
- IWG plc (UK)
- Regus (UK)
- The Office Group (UK)
- TOG (UK)
- Second Home (UK)
- Spaces (Netherlands)
- Servcorp (Australia)
- Mindspace (Israel), and other major players
Key Industry Developments in the Shared Office Space Market:
- In February 2024, WeWork, a leading global flexible space provider, announced three new lease assumptions in the U.S. as part of its strategic restructuring process and ongoing negotiations with its landlords. The assumptions, which are subject to court approval, demonstrate WeWork’s momentum in its financial reorganization and include the first alternative lease structure process.
- In April 2022, The Farm Soho’s thriving affordable coworking spaces in NYC are now seeking to share their unique business model and know-how with property owners. The company launched The Barn, its new brand intended to offer property owners a turnkey solution to have their commercial properties successfully turned into affordable and profitable coworking spaces.
|
Shared Office Space Market |
|||
|
Base Year: |
2023 |
Forecast Period: |
2024-2032 |
|
Historical Data: |
2017 to 2023 |
Market Size in 2023: |
39.29 Bn. |
|
Forecast Period 2024-32 CAGR: |
7.8 % |
Market Size in 2032: |
66.47 Bn. |
|
Segments Covered: |
By Amenities |
|
|
|
By Location |
|
||
|
By Specialized |
|
||
|
By Region |
|
||
|
Key Market Drivers: |
|
||
|
Key Market Restraints: |
|
||
|
Key Opportunities: |
|
||
|
Companies Covered in the report: |
|
||
Chapter 1: Introduction
1.1 Scope and Coverage
Chapter 2:Executive Summary
Chapter 3: Market Landscape
3.1 Market Dynamics
3.1.1 Drivers
3.1.2 Restraints
3.1.3 Opportunities
3.1.4 Challenges
3.2 Market Trend Analysis
3.3 PESTLE Analysis
3.4 Porter's Five Forces Analysis
3.5 Industry Value Chain Analysis
3.6 Ecosystem
3.7 Regulatory Landscape
3.8 Price Trend Analysis
3.9 Patent Analysis
3.10 Technology Evolution
3.11 Investment Pockets
3.12 Import-Export Analysis
Chapter 4: Shared Office Space Market by Amenities (2018-2032)
4.1 Shared Office Space Market Snapshot and Growth Engine
4.2 Market Overview
4.3 Premium Facilities
4.3.1 Introduction and Market Overview
4.3.2 Historic and Forecasted Market Size in Value USD and Volume Units
4.3.3 Key Market Trends, Growth Factors, and Opportunities
4.3.4 Geographic Segmentation Analysis
4.4 Industry-specific Facilities
4.5 Basic Facilities
Chapter 5: Shared Office Space Market by Location (2018-2032)
5.1 Shared Office Space Market Snapshot and Growth Engine
5.2 Market Overview
5.3 Urban Centers
5.3.1 Introduction and Market Overview
5.3.2 Historic and Forecasted Market Size in Value USD and Volume Units
5.3.3 Key Market Trends, Growth Factors, and Opportunities
5.3.4 Geographic Segmentation Analysis
5.4 Suburban Areas
Chapter 6: Shared Office Space Market by Specialized (2018-2032)
6.1 Shared Office Space Market Snapshot and Growth Engine
6.2 Market Overview
6.3 Niche Communities
6.3.1 Introduction and Market Overview
6.3.2 Historic and Forecasted Market Size in Value USD and Volume Units
6.3.3 Key Market Trends, Growth Factors, and Opportunities
6.3.4 Geographic Segmentation Analysis
6.4 Corporate Coworking
Chapter 7: Company Profiles and Competitive Analysis
7.1 Competitive Landscape
7.1.1 Competitive Benchmarking
7.1.2 Shared Office Space Market Share by Manufacturer (2024)
7.1.3 Industry BCG Matrix
7.1.4 Heat Map Analysis
7.1.5 Mergers and Acquisitions
7.2 TOPVIEW INFORMATION (US)
7.2.1 Company Overview
7.2.2 Key Executives
7.2.3 Company Snapshot
7.2.4 Role of the Company in the Market
7.2.5 Sustainability and Social Responsibility
7.2.6 Operating Business Segments
7.2.7 Product Portfolio
7.2.8 Business Performance
7.2.9 Key Strategic Moves and Recent Developments
7.2.10 SWOT Analysis
7.3 EDMODO (US)
7.4 ADOBE INC (US)
7.5 CENGAGE LEARNING INC (US)
7.6 CISCO SYSTEMS INC (US)
7.7 JOHN WILEY AND SONS INC. (US)
7.8 IFLYTEK (CHINA)
7.9 SHIYUAN SHARES (SHIWO) (CHINA)
7.10 HONGHE TECHNOLOGY (CHINA)
7.11 TIANYU INFORMATION (CHINA)
7.12 NEWCAPEC (CHINA)
7.13 TASC SOFTWARE SOLUTIONS LTD (UK)
7.14 PEARSON PLC. (UK)
7.15 JIAFA EDUCATION (INDIA)
7.16 SAMSUNG ELECTRONICS CO. LTD. (SOUTH KOREA)
7.17
Chapter 8: Global Shared Office Space Market By Region
8.1 Overview
8.2. North America Shared Office Space Market
8.2.1 Key Market Trends, Growth Factors and Opportunities
8.2.2 Top Key Companies
8.2.3 Historic and Forecasted Market Size by Segments
8.2.4 Historic and Forecasted Market Size by Amenities
8.2.4.1 Premium Facilities
8.2.4.2 Industry-specific Facilities
8.2.4.3 Basic Facilities
8.2.5 Historic and Forecasted Market Size by Location
8.2.5.1 Urban Centers
8.2.5.2 Suburban Areas
8.2.6 Historic and Forecasted Market Size by Specialized
8.2.6.1 Niche Communities
8.2.6.2 Corporate Coworking
8.2.7 Historic and Forecast Market Size by Country
8.2.7.1 US
8.2.7.2 Canada
8.2.7.3 Mexico
8.3. Eastern Europe Shared Office Space Market
8.3.1 Key Market Trends, Growth Factors and Opportunities
8.3.2 Top Key Companies
8.3.3 Historic and Forecasted Market Size by Segments
8.3.4 Historic and Forecasted Market Size by Amenities
8.3.4.1 Premium Facilities
8.3.4.2 Industry-specific Facilities
8.3.4.3 Basic Facilities
8.3.5 Historic and Forecasted Market Size by Location
8.3.5.1 Urban Centers
8.3.5.2 Suburban Areas
8.3.6 Historic and Forecasted Market Size by Specialized
8.3.6.1 Niche Communities
8.3.6.2 Corporate Coworking
8.3.7 Historic and Forecast Market Size by Country
8.3.7.1 Russia
8.3.7.2 Bulgaria
8.3.7.3 The Czech Republic
8.3.7.4 Hungary
8.3.7.5 Poland
8.3.7.6 Romania
8.3.7.7 Rest of Eastern Europe
8.4. Western Europe Shared Office Space Market
8.4.1 Key Market Trends, Growth Factors and Opportunities
8.4.2 Top Key Companies
8.4.3 Historic and Forecasted Market Size by Segments
8.4.4 Historic and Forecasted Market Size by Amenities
8.4.4.1 Premium Facilities
8.4.4.2 Industry-specific Facilities
8.4.4.3 Basic Facilities
8.4.5 Historic and Forecasted Market Size by Location
8.4.5.1 Urban Centers
8.4.5.2 Suburban Areas
8.4.6 Historic and Forecasted Market Size by Specialized
8.4.6.1 Niche Communities
8.4.6.2 Corporate Coworking
8.4.7 Historic and Forecast Market Size by Country
8.4.7.1 Germany
8.4.7.2 UK
8.4.7.3 France
8.4.7.4 The Netherlands
8.4.7.5 Italy
8.4.7.6 Spain
8.4.7.7 Rest of Western Europe
8.5. Asia Pacific Shared Office Space Market
8.5.1 Key Market Trends, Growth Factors and Opportunities
8.5.2 Top Key Companies
8.5.3 Historic and Forecasted Market Size by Segments
8.5.4 Historic and Forecasted Market Size by Amenities
8.5.4.1 Premium Facilities
8.5.4.2 Industry-specific Facilities
8.5.4.3 Basic Facilities
8.5.5 Historic and Forecasted Market Size by Location
8.5.5.1 Urban Centers
8.5.5.2 Suburban Areas
8.5.6 Historic and Forecasted Market Size by Specialized
8.5.6.1 Niche Communities
8.5.6.2 Corporate Coworking
8.5.7 Historic and Forecast Market Size by Country
8.5.7.1 China
8.5.7.2 India
8.5.7.3 Japan
8.5.7.4 South Korea
8.5.7.5 Malaysia
8.5.7.6 Thailand
8.5.7.7 Vietnam
8.5.7.8 The Philippines
8.5.7.9 Australia
8.5.7.10 New Zealand
8.5.7.11 Rest of APAC
8.6. Middle East & Africa Shared Office Space Market
8.6.1 Key Market Trends, Growth Factors and Opportunities
8.6.2 Top Key Companies
8.6.3 Historic and Forecasted Market Size by Segments
8.6.4 Historic and Forecasted Market Size by Amenities
8.6.4.1 Premium Facilities
8.6.4.2 Industry-specific Facilities
8.6.4.3 Basic Facilities
8.6.5 Historic and Forecasted Market Size by Location
8.6.5.1 Urban Centers
8.6.5.2 Suburban Areas
8.6.6 Historic and Forecasted Market Size by Specialized
8.6.6.1 Niche Communities
8.6.6.2 Corporate Coworking
8.6.7 Historic and Forecast Market Size by Country
8.6.7.1 Turkiye
8.6.7.2 Bahrain
8.6.7.3 Kuwait
8.6.7.4 Saudi Arabia
8.6.7.5 Qatar
8.6.7.6 UAE
8.6.7.7 Israel
8.6.7.8 South Africa
8.7. South America Shared Office Space Market
8.7.1 Key Market Trends, Growth Factors and Opportunities
8.7.2 Top Key Companies
8.7.3 Historic and Forecasted Market Size by Segments
8.7.4 Historic and Forecasted Market Size by Amenities
8.7.4.1 Premium Facilities
8.7.4.2 Industry-specific Facilities
8.7.4.3 Basic Facilities
8.7.5 Historic and Forecasted Market Size by Location
8.7.5.1 Urban Centers
8.7.5.2 Suburban Areas
8.7.6 Historic and Forecasted Market Size by Specialized
8.7.6.1 Niche Communities
8.7.6.2 Corporate Coworking
8.7.7 Historic and Forecast Market Size by Country
8.7.7.1 Brazil
8.7.7.2 Argentina
8.7.7.3 Rest of SA
Chapter 9 Analyst Viewpoint and Conclusion
9.1 Recommendations and Concluding Analysis
9.2 Potential Market Strategies
Chapter 10 Research Methodology
10.1 Research Process
10.2 Primary Research
10.3 Secondary Research
|
Shared Office Space Market |
|||
|
Base Year: |
2023 |
Forecast Period: |
2024-2032 |
|
Historical Data: |
2017 to 2023 |
Market Size in 2023: |
39.29 Bn. |
|
Forecast Period 2024-32 CAGR: |
7.8 % |
Market Size in 2032: |
66.47 Bn. |
|
Segments Covered: |
By Amenities |
|
|
|
By Location |
|
||
|
By Specialized |
|
||
|
By Region |
|
||
|
Key Market Drivers: |
|
||
|
Key Market Restraints: |
|
||
|
Key Opportunities: |
|
||
|
Companies Covered in the report: |
|
||


