


Electric Mobility Market Synopsis
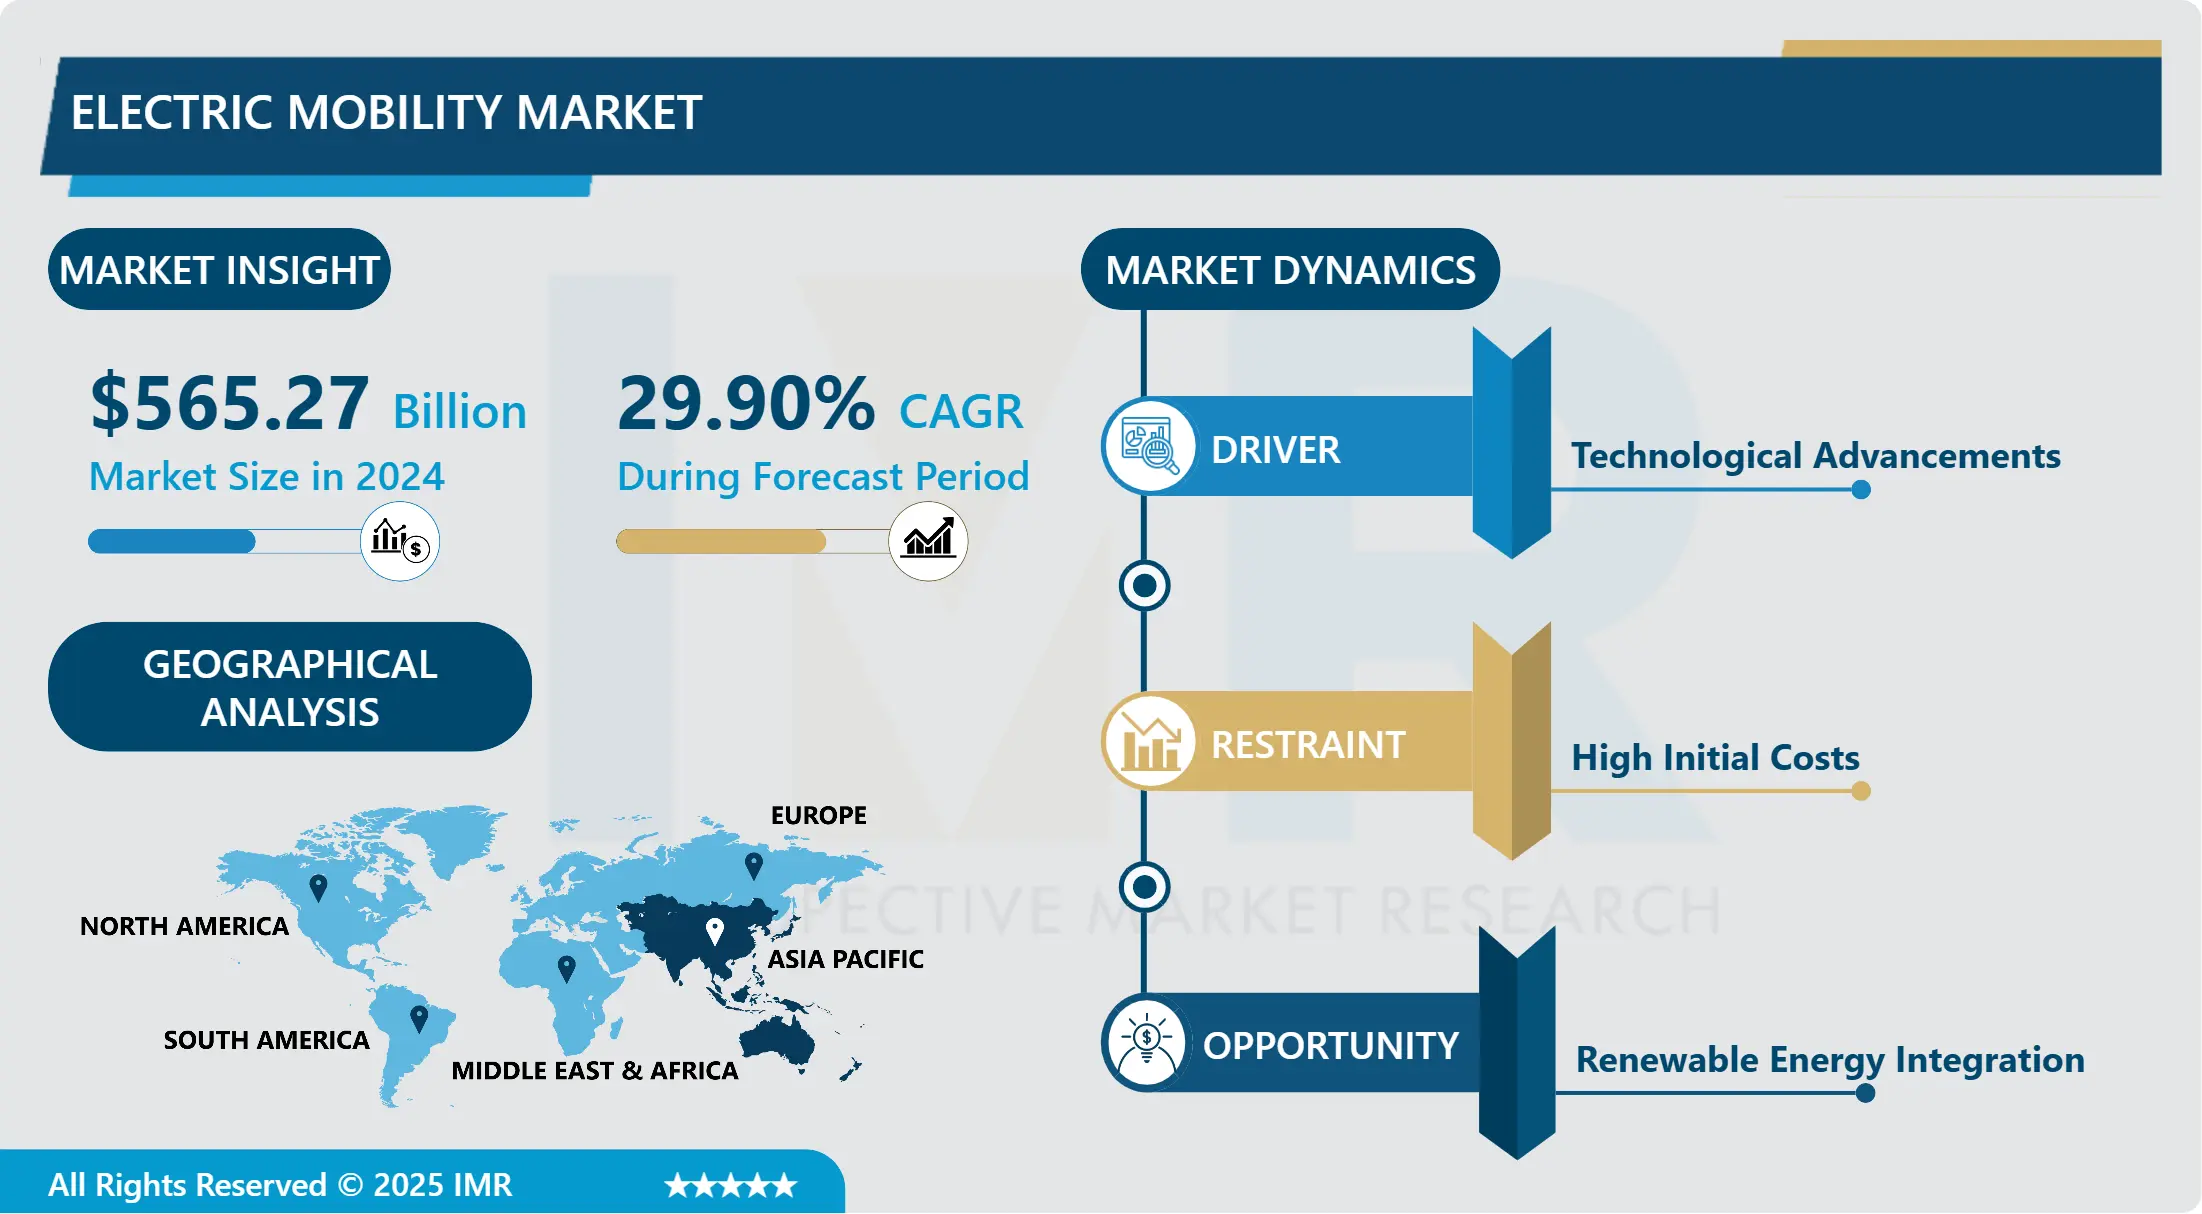
Electric Mobility Market Size Was Valued at USD 565.27 Billion in 2024, and is Projected to Reach USD 4582.78 Billion by 2032, Growing at a CAGR of 29.90% From 2025-2032.
Electric mobility refers to transportation powered by electric propulsion systems, including electric vehicles (EVs), e-bikes, e-scooters, electric buses, and the supporting infrastructure like charging stations and energy management systems. This rapidly growing market is driven by the need to reduce greenhouse gas emissions, improve air quality, and decrease reliance on fossil fuels. Government incentives, technological advancements in batteries, and growing environmental awareness have accelerated adoption. Major automakers, tech giants, and startups are all competing in this space. Consumers are increasingly choosing electric vehicles due to climate change awareness and rising fuel costs.
Challenges remain, such as high initial vehicle costs, raw material supply issues, and insufficient charging infrastructure, especially in rural and developing regions. Despite this, ongoing investments in battery innovation, wireless charging, and autonomous technology promise to transform the transport sector. With supportive policies, advancing technology, and collective action from businesses, governments, and consumers, electric mobility is set to play a crucial role in building a more sustainable and cleaner global transportation system.

Electric Mobility Market Trend Analysis
Global Surge in Electric Vehicle Adoption
- Globally, the automotive industry is shifting rapidly toward electric vehicles (EVs) due to growing environmental concerns and government action to cut greenhouse gas emissions. Strict policies, emissions targets, tax credits, and subsidies are encouraging consumers to adopt EVs and compelling manufacturers to transition from internal combustion engines (ICEs) to electric powertrains. Major automakers are investing heavily in EV research and development. Technological breakthroughs, especially in high energy-density lithium-ion batteries, have reduced charging times and extended driving ranges.
- Enhanced energy management systems and electric drives have improved vehicle performance, making EVs comparable to ICE vehicles. Additionally, public and private investments in charging infrastructure have reduced range anxiety, making EVs more practical for everyday use. These developments collectively support the global push for green mobility, transforming not only the automotive industry but also urban transportation systems. As technology and regulations continue to evolve, electric mobility is expected to reshape the future of global transportation and significantly reduce dependence on fossil fuels.
Infrastructure Development in Electric Vehicle Charging
-
The growth of charging infrastructure is a key factor in overcoming one of the biggest barriers to electric vehicle (EV) adoption—range anxiety. Governments and private companies worldwide recognize the importance of infrastructure in accelerating EV use. Fast-charging stations are strategically placed along major highways to support long-distance travel, using high-power chargers that quickly restore battery capacity. Slower Level 2 chargers are common in urban areas, offices, and homes, allowing overnight or continuous charging while vehicles are parked. Workplace charging boosts convenience and encourages daily EV use by ensuring employees leave work with fully charged vehicles.
-
Accessible, reliable charging options help build consumer confidence by eliminating fears of battery depletion. Beyond practical benefits, charging infrastructure plays a strategic role in promoting electric mobility, supporting reduced fossil fuel use and improved urban air quality. As networks expand and evolve with new technologies, they contribute to a more sustainable transportation system and align with broader environmental and climate goals, benefiting both society and the planet.
Electric Mobility Market Segment Analysis:
Electric Mobility Market is Segmented based on Product, Drive, Battery, End-user and Region.
By Product, Electric Scooterssegment is expected to dominate the market during the forecast period
-
Modern electric scooters have become the leading choice in the electric two-wheeler segment, especially for short-range and urban mobility. Their appeal lies in affordability, ease of use, and low maintenance compared to electric bikes and motorbikes. Compact and lightweight, scooters can navigate through congested city traffic and narrow streets, helping commuters save time and reduce fuel costs. With simple, gearless operation, they are accessible to a wide range of users, from beginners to experienced riders. In contrast, electric bikes cater to a niche market of cycling enthusiasts and commuters traveling longer distances.
-
Equipped with features like pedal assist and throttle control, e-bikes offer versatility for fitness, leisure, and rough terrain travel. They attract environmentally conscious consumers seeking both exercise and sustainability. While less popular than scooters, electric bikes are vital in promoting green mobility. As consumer preferences evolve and technology improves, both electric scooters and bikes are set to play key roles in transforming urban transportation and advancing sustainable mobility solutions.
By Drive, Hub Drive segment held the largest share in 2024
- Hub motors are the most popular drives for electric bicycles due to their numerous advantages that appeal to a wide range of consumers. One key benefit is their ease of integration into existing bicycle designs without requiring major modifications to the frame or drivetrain. Unlike mid-drive systems, hub motors fit directly into the wheel hub, preserving the traditional bike’s smooth and comfortable ride. This simple installation process also maintains the bike’s original aesthetics and reduces complexity when converting a standard bike into an e-bike. Additionally, hub drives are highly reliable and require minimal maintenance.
- Since the motor is enclosed within the wheel hub, it is better protected from dirt, water, and debris, resulting in increased durability. Their low maintenance and long lifespan make them cost-effective and user-friendly, especially for daily commuters and casual riders. Because of their ease of use, efficiency, and adaptability for both leisure and transportation, hub motors continue to dominate the electric bicycle market and remain a preferred choice for many riders.
Electric Mobility Market Regional Insights:
Asia-Pacific is Expected to Dominate the Market Over the Forecast period
-
The electric mobility market has seen rapid growth across the Asia-Pacific region due to several key drivers. China, the world’s largest market for electric vehicles (EVs), has led this expansion through ambitious government targets, heavy investment in charging infrastructure, and strict pollution control policies. These measures have not only increased consumer confidence but also spurred innovation among domestic automakers. The shift to EVs aligns with China's broader environmental goals, particularly in addressing urban air quality issues and promoting battery and renewable energy technologies.
-
India and Southeast Asian countries are also emerging as important players. India is prioritizing electric mobility to reduce reliance on imported oil and curb urban pollution, supported by tax incentives, subsidies, and investments in charging infrastructure. Meanwhile, nations like Thailand, Indonesia, and Vietnam are witnessing rising EV demand due to growing environmental awareness and urbanization. Technological advancements in battery manufacturing and strategic partnerships with global automakers are accelerating adoption. Despite infrastructure challenges, legislative support and environmental concerns continue to fuel regional growth.
Active Key Players in the Electric Mobility Market
- BMW Motorrad International
- Gogoro, Inc.
- Honda Motor Co. Ltd.
- KTM AG
- Mahindra Group
- Ninebot Ltd.
- Suzuki Motor Corporation
- Other Active Players
|
Global Electric Mobility Market |
|||
|
Base Year: |
2024 |
Forecast Period: |
2025-2032 |
|
Historical Data: |
2018 to 2023 |
Market Size in 2024: |
USD 565.27 Bn. |
|
Forecast Period 2025-32 CAGR: |
29.90% |
Market Size in 2032: |
USD 4582.78 Bn. |
|
Segments Covered: |
By Product |
|
|
|
By Drive |
|
||
|
By Battery |
|
||
|
By End-user |
|
||
|
By Region |
|
||
|
Key Market Drivers: |
|
||
|
Key Market Restraints: |
|
||
|
Key Opportunities: |
|
||
|
Companies Covered in the report: |
|
||
Chapter 1: Introduction
1.1 Scope and Coverage
Chapter 2:Executive Summary
Chapter 3: Market Landscape
3.1 Market Dynamics
3.1.1 Drivers
3.1.2 Restraints
3.1.3 Opportunities
3.1.4 Challenges
3.2 Market Trend Analysis
3.3 PESTLE Analysis
3.4 Porter's Five Forces Analysis
3.5 Industry Value Chain Analysis
3.6 Ecosystem
3.7 Regulatory Landscape
3.8 Price Trend Analysis
3.9 Patent Analysis
3.10 Technology Evolution
3.11 Investment Pockets
3.12 Import-Export Analysis
Chapter 4: Electric Mobility Market by Product (2018-2032)
4.1 Electric Mobility Market Snapshot and Growth Engine
4.2 Market Overview
4.3 Electric Bikes
4.3.1 Introduction and Market Overview
4.3.2 Historic and Forecasted Market Size in Value USD and Volume Units
4.3.3 Key Market Trends, Growth Factors, and Opportunities
4.3.4 Geographic Segmentation Analysis
4.4 Electric Scooters
4.5 Electric Motorized Scooters
4.6 Electric Motorcycles
Chapter 5: Electric Mobility Market by Drive (2018-2032)
5.1 Electric Mobility Market Snapshot and Growth Engine
5.2 Market Overview
5.3 Belt Drive
5.3.1 Introduction and Market Overview
5.3.2 Historic and Forecasted Market Size in Value USD and Volume Units
5.3.3 Key Market Trends, Growth Factors, and Opportunities
5.3.4 Geographic Segmentation Analysis
5.4 Chain Drive
5.5 Hub Drive
Chapter 6: Electric Mobility Market by Battery (2018-2032)
6.1 Electric Mobility Market Snapshot and Growth Engine
6.2 Market Overview
6.3 Lead Acid Battery
6.3.1 Introduction and Market Overview
6.3.2 Historic and Forecasted Market Size in Value USD and Volume Units
6.3.3 Key Market Trends, Growth Factors, and Opportunities
6.3.4 Geographic Segmentation Analysis
6.4 Li-Ion Battery
6.5 Others
Chapter 7: Electric Mobility Market by End-user (2018-2032)
7.1 Electric Mobility Market Snapshot and Growth Engine
7.2 Market Overview
7.3 Personal
7.3.1 Introduction and Market Overview
7.3.2 Historic and Forecasted Market Size in Value USD and Volume Units
7.3.3 Key Market Trends, Growth Factors, and Opportunities
7.3.4 Geographic Segmentation Analysis
7.4 Commercial
Chapter 8: Company Profiles and Competitive Analysis
8.1 Competitive Landscape
8.1.1 Competitive Benchmarking
8.1.2 Electric Mobility Market Share by Manufacturer (2024)
8.1.3 Industry BCG Matrix
8.1.4 Heat Map Analysis
8.1.5 Mergers and Acquisitions
8.2 BENTELER
8.2.1 Company Overview
8.2.2 Key Executives
8.2.3 Company Snapshot
8.2.4 Role of the Company in the Market
8.2.5 Sustainability and Social Responsibility
8.2.6 Operating Business Segments
8.2.7 Product Portfolio
8.2.8 Business Performance
8.2.9 Key Strategic Moves and Recent Developments
8.2.10 SWOT Analysis
8.3 CONSTELLIUM
8.4 STANDARD TECHNOLOGIES
8.5 ZEISS
8.6 FOSHAN SHIJUN HONGMAO ALUMINUM TECHNOLOGY CO. LTDGESTAMP
8.7 WALDASCHAFF AUTOMOTIVE GMBH
8.8 ALUMINUM EXTRUDERS COUNCIL
8.9 ATLAS COPCO AB
8.10 DURA AUTOMOTIVE SYSTEMS
8.11 PRATIC CNC TECHNOLOGY CO. LTD
8.12 FSM GROUP
8.13 FARASIS ENERGY (USA)
8.14 INERGY AUTOMOTIVE SYSTEMS (FRANCE)
8.15 NOVELIS INC (USA)
8.16 SIKA AUTOMOTIVE (SWITZERLAND)
8.17 WEBASTO GROUP (GERMANY)
8.18 OTHER MAJOR PLAYERS.
Chapter 9: Global Electric Mobility Market By Region
9.1 Overview
9.2. North America Electric Mobility Market
9.2.1 Key Market Trends, Growth Factors and Opportunities
9.2.2 Top Key Companies
9.2.3 Historic and Forecasted Market Size by Segments
9.2.4 Historic and Forecasted Market Size by Product
9.2.4.1 Electric Bikes
9.2.4.2 Electric Scooters
9.2.4.3 Electric Motorized Scooters
9.2.4.4 Electric Motorcycles
9.2.5 Historic and Forecasted Market Size by Drive
9.2.5.1 Belt Drive
9.2.5.2 Chain Drive
9.2.5.3 Hub Drive
9.2.6 Historic and Forecasted Market Size by Battery
9.2.6.1 Lead Acid Battery
9.2.6.2 Li-Ion Battery
9.2.6.3 Others
9.2.7 Historic and Forecasted Market Size by End-user
9.2.7.1 Personal
9.2.7.2 Commercial
9.2.8 Historic and Forecast Market Size by Country
9.2.8.1 US
9.2.8.2 Canada
9.2.8.3 Mexico
9.3. Eastern Europe Electric Mobility Market
9.3.1 Key Market Trends, Growth Factors and Opportunities
9.3.2 Top Key Companies
9.3.3 Historic and Forecasted Market Size by Segments
9.3.4 Historic and Forecasted Market Size by Product
9.3.4.1 Electric Bikes
9.3.4.2 Electric Scooters
9.3.4.3 Electric Motorized Scooters
9.3.4.4 Electric Motorcycles
9.3.5 Historic and Forecasted Market Size by Drive
9.3.5.1 Belt Drive
9.3.5.2 Chain Drive
9.3.5.3 Hub Drive
9.3.6 Historic and Forecasted Market Size by Battery
9.3.6.1 Lead Acid Battery
9.3.6.2 Li-Ion Battery
9.3.6.3 Others
9.3.7 Historic and Forecasted Market Size by End-user
9.3.7.1 Personal
9.3.7.2 Commercial
9.3.8 Historic and Forecast Market Size by Country
9.3.8.1 Russia
9.3.8.2 Bulgaria
9.3.8.3 The Czech Republic
9.3.8.4 Hungary
9.3.8.5 Poland
9.3.8.6 Romania
9.3.8.7 Rest of Eastern Europe
9.4. Western Europe Electric Mobility Market
9.4.1 Key Market Trends, Growth Factors and Opportunities
9.4.2 Top Key Companies
9.4.3 Historic and Forecasted Market Size by Segments
9.4.4 Historic and Forecasted Market Size by Product
9.4.4.1 Electric Bikes
9.4.4.2 Electric Scooters
9.4.4.3 Electric Motorized Scooters
9.4.4.4 Electric Motorcycles
9.4.5 Historic and Forecasted Market Size by Drive
9.4.5.1 Belt Drive
9.4.5.2 Chain Drive
9.4.5.3 Hub Drive
9.4.6 Historic and Forecasted Market Size by Battery
9.4.6.1 Lead Acid Battery
9.4.6.2 Li-Ion Battery
9.4.6.3 Others
9.4.7 Historic and Forecasted Market Size by End-user
9.4.7.1 Personal
9.4.7.2 Commercial
9.4.8 Historic and Forecast Market Size by Country
9.4.8.1 Germany
9.4.8.2 UK
9.4.8.3 France
9.4.8.4 The Netherlands
9.4.8.5 Italy
9.4.8.6 Spain
9.4.8.7 Rest of Western Europe
9.5. Asia Pacific Electric Mobility Market
9.5.1 Key Market Trends, Growth Factors and Opportunities
9.5.2 Top Key Companies
9.5.3 Historic and Forecasted Market Size by Segments
9.5.4 Historic and Forecasted Market Size by Product
9.5.4.1 Electric Bikes
9.5.4.2 Electric Scooters
9.5.4.3 Electric Motorized Scooters
9.5.4.4 Electric Motorcycles
9.5.5 Historic and Forecasted Market Size by Drive
9.5.5.1 Belt Drive
9.5.5.2 Chain Drive
9.5.5.3 Hub Drive
9.5.6 Historic and Forecasted Market Size by Battery
9.5.6.1 Lead Acid Battery
9.5.6.2 Li-Ion Battery
9.5.6.3 Others
9.5.7 Historic and Forecasted Market Size by End-user
9.5.7.1 Personal
9.5.7.2 Commercial
9.5.8 Historic and Forecast Market Size by Country
9.5.8.1 China
9.5.8.2 India
9.5.8.3 Japan
9.5.8.4 South Korea
9.5.8.5 Malaysia
9.5.8.6 Thailand
9.5.8.7 Vietnam
9.5.8.8 The Philippines
9.5.8.9 Australia
9.5.8.10 New Zealand
9.5.8.11 Rest of APAC
9.6. Middle East & Africa Electric Mobility Market
9.6.1 Key Market Trends, Growth Factors and Opportunities
9.6.2 Top Key Companies
9.6.3 Historic and Forecasted Market Size by Segments
9.6.4 Historic and Forecasted Market Size by Product
9.6.4.1 Electric Bikes
9.6.4.2 Electric Scooters
9.6.4.3 Electric Motorized Scooters
9.6.4.4 Electric Motorcycles
9.6.5 Historic and Forecasted Market Size by Drive
9.6.5.1 Belt Drive
9.6.5.2 Chain Drive
9.6.5.3 Hub Drive
9.6.6 Historic and Forecasted Market Size by Battery
9.6.6.1 Lead Acid Battery
9.6.6.2 Li-Ion Battery
9.6.6.3 Others
9.6.7 Historic and Forecasted Market Size by End-user
9.6.7.1 Personal
9.6.7.2 Commercial
9.6.8 Historic and Forecast Market Size by Country
9.6.8.1 Turkiye
9.6.8.2 Bahrain
9.6.8.3 Kuwait
9.6.8.4 Saudi Arabia
9.6.8.5 Qatar
9.6.8.6 UAE
9.6.8.7 Israel
9.6.8.8 South Africa
9.7. South America Electric Mobility Market
9.7.1 Key Market Trends, Growth Factors and Opportunities
9.7.2 Top Key Companies
9.7.3 Historic and Forecasted Market Size by Segments
9.7.4 Historic and Forecasted Market Size by Product
9.7.4.1 Electric Bikes
9.7.4.2 Electric Scooters
9.7.4.3 Electric Motorized Scooters
9.7.4.4 Electric Motorcycles
9.7.5 Historic and Forecasted Market Size by Drive
9.7.5.1 Belt Drive
9.7.5.2 Chain Drive
9.7.5.3 Hub Drive
9.7.6 Historic and Forecasted Market Size by Battery
9.7.6.1 Lead Acid Battery
9.7.6.2 Li-Ion Battery
9.7.6.3 Others
9.7.7 Historic and Forecasted Market Size by End-user
9.7.7.1 Personal
9.7.7.2 Commercial
9.7.8 Historic and Forecast Market Size by Country
9.7.8.1 Brazil
9.7.8.2 Argentina
9.7.8.3 Rest of SA
Chapter 10 Analyst Viewpoint and Conclusion
10.1 Recommendations and Concluding Analysis
10.2 Potential Market Strategies
Chapter 11 Research Methodology
11.1 Research Process
11.2 Primary Research
11.3 Secondary Research
|
Global Electric Mobility Market |
|||
|
Base Year: |
2024 |
Forecast Period: |
2025-2032 |
|
Historical Data: |
2018 to 2023 |
Market Size in 2024: |
USD 565.27 Bn. |
|
Forecast Period 2025-32 CAGR: |
29.90% |
Market Size in 2032: |
USD 4582.78 Bn. |
|
Segments Covered: |
By Product |
|
|
|
By Drive |
|
||
|
By Battery |
|
||
|
By End-user |
|
||
|
By Region |
|
||
|
Key Market Drivers: |
|
||
|
Key Market Restraints: |
|
||
|
Key Opportunities: |
|
||
|
Companies Covered in the report: |
|
||


