


Distribution Boards Market Synopsis
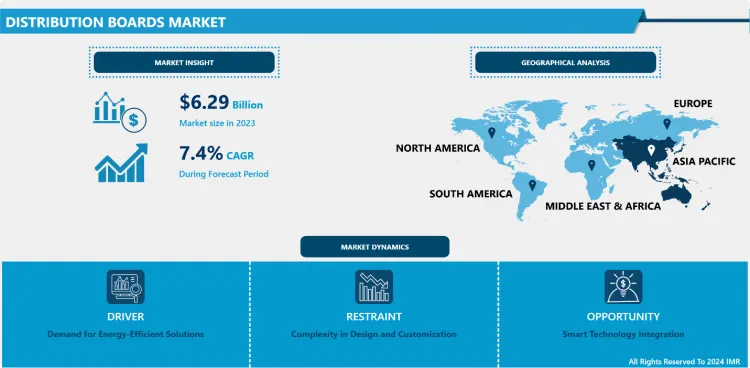
Distribution Boards Market Size Was Valued at USD 6.29 Billion in 2023 and is Projected to Reach USD 11.96 Billion by 2032, Growing at a CAGR of 7.4% From 2024-2032.
Distribution boards, also known as breaker panels or fuse boxes, are critical components within electrical systems. Their primary function is to manage and distribute electrical power from the main supply to subsidiary circuits, ensuring safe and efficient electricity distribution throughout a building or facility.
These panels contain circuit breakers, fuses, or residual-current devices (RCDs) that safeguard the electrical network by interrupting power flow in case of overcurrent, short circuits, or earth faults. Distribution boards come in various sizes and configurations to accommodate different voltage levels and loads, catering to both residential and commercial applications.
They serve as central hubs where incoming electrical supply is divided into smaller circuits, each dedicated to powering specific areas or appliances within a structure. Labels or diagrams on the distribution board denote the circuits they control, aiding in easy identification and maintenance.
Regular inspection and maintenance of distribution boards are crucial to ensure their proper functioning and to prevent electrical hazards. Qualified electricians typically install, upgrade, or repair these boards to comply with safety standards and local regulations, prioritizing the protection of both property and individuals against electrical faults.
.webp)
Distribution Boards Market Trend Analysis
Demand for Energy-Efficient Solutions
- As global awareness regarding sustainability and energy conservation intensifies, there's a heightened emphasis on reducing electricity consumption and optimizing energy usage within buildings and industries.
- Energy-efficient distribution boards play a crucial role in this landscape by offering advanced features that minimize power losses, enhance electrical system performance, and enable more efficient distribution of electricity. These boards integrate innovative technologies such as smart meters, power monitoring systems, and intelligent circuitry that enable precise energy management, identifying areas of excessive consumption and optimizing electricity flow.
- Businesses and consumers alike seek distribution boards with improved energy efficiency to lower operational costs, adhere to environmental regulations, and reduce their carbon footprint. Additionally, government initiatives promoting energy efficiency, along with incentives and regulations favouring the use of energy-efficient electrical systems, further bolster the market growth for these solutions.
- Manufacturers continually invest in research and development to create distribution boards that not only ensure electrical safety and reliability but also prioritize energy conservation. This market trend towards energy efficiency reflects a fundamental shift in consumer preferences and industry standards, driving the robust growth of energy-efficient distribution boards across various sectors worldwide.
Smart Technology Integration
- The advent of smart grids and the proliferation of the Internet of Things (IoT) have paved the way for distribution boards equipped with intelligent features, presenting a range of benefits and opportunities.
- Smart technology integration enables distribution boards to incorporate advanced functionalities such as remote monitoring, real-time data analytics, and automated control mechanisms. These boards can facilitate seamless communication between various components, allowing for predictive maintenance, load balancing, and identification of energy consumption patterns.
- Moreover, IoT-enabled distribution boards empower users with remote access and control, providing insights into energy usage, fault detection, and system performance through mobile applications or centralized platforms. This capability not only enhances operational efficiency but also assists in proactive decision-making for optimizing energy distribution and consumption.
- The market opportunity lies in the development of smart distribution boards capable of adapting to changing energy demands, integrating renewable energy sources, and ensuring grid stability. Manufacturers investing in research and development to create intelligent, interconnected boards can meet the escalating demand for sophisticated energy management solutions in residential, commercial, and industrial sectors.
- The potential for smart technology integration within distribution boards not only meets the growing consumer demand for energy-efficient and digitally enabled solutions but also positions the industry to contribute significantly to the evolution of smarter and more sustainable electrical distribution systems.
Distribution Boards Market Segment Analysis:
Distribution Boards Market Segmented on the basis of type, application, and end-users.
By Type, Medium segment is expected to dominate the market during the forecast period
- In the forecast period, the medium segment is anticipated to dominate the distribution board market due to its widespread application across various sectors. Medium-sized distribution boards cater to a broad spectrum of consumers, including commercial establishments, small industries, and mid-sized residential complexes.
- This segment's dominance stems from its versatility, offering solutions that balance capacity and functionality, making them suitable for a range of applications. Medium-sized boards efficiently manage moderate to high electrical loads while providing adequate circuitry for diverse requirements, aligning with the needs of expanding businesses and growing residential complexes.
- Additionally, advancements in technology have led to the development of medium-sized boards with enhanced safety features, energy efficiency, and smart capabilities, further boosting their appeal across industries. Their adaptability, optimal size-to-functionality ratio, and compatibility with evolving energy needs position the medium segment to command a significant market share in the forecasted period.
By End User, Transmission & Distribution Utilities segment held the largest market share of 54% in 2022
- The Transmission & Distribution Utilities segment has consistently held the largest market share in the distribution board industry due to its pivotal role in electricity transmission and distribution infrastructure. Utilities responsible for transmitting and distributing electricity across regions heavily rely on distribution boards as essential components within their grid systems.
- These utilities operate vast networks comprising substations, power lines, and distribution systems where distribution boards play a critical role in managing and directing electricity flow to various endpoints. Distribution boards within this segment are designed to handle high voltage levels, ensuring efficient power distribution while maintaining system reliability and safety.
- The continuous expansion and modernization of power grids, coupled with the need for enhanced grid stability and reliability, drive the demand for robust and technologically advanced distribution boards. This segment's dominance is sustained by ongoing investments in grid infrastructure upgrades, smart grid initiatives, and the adoption of advanced distribution board solutions, consolidating its position as the largest market share holder in the distribution board industry.
Distribution Boards Market Regional Insights:
Asia Pacific is Expected to Dominate the Market Over the Forecast period
- Asia Pacific is poised to dominate the distribution board market over the forecast period due to several key factors driving its growth in the region. Rapid urbanization, substantial infrastructural developments, and expanding industrialization across countries like China, India, Japan, and Southeast Asian nations contribute to the increasing demand for electrical distribution systems.
- The region's burgeoning population drives the need for residential infrastructure, commercial spaces, and industrial facilities, consequently boosting the demand for distribution boards across diverse sectors. Additionally, supportive government initiatives promoting urban development, electrification projects, and the integration of renewable energy sources stimulate market growth.
- Furthermore, the region's inclination towards energy-efficient solutions and the adoption of smart technologies within electrical systems fuel the demand for advanced distribution boards. With escalating investments in upgrading electrical infrastructure and the ongoing expansion of power generation capacities, Asia Pacific stands as a pivotal hub for the distribution board market, poised to maintain its dominance in the industry over the forecasted period.
Distribution Boards Market Top Key Players:
- Abb (Switzerland)
- Al Mina (Saudi Arabia)
- Ap Power Technologies (India)
- Blakley Electrics (UK)
- East Coast Power Systems (US)
- Eaton (Ireland)
- Esl Power Station (Taiwan)
- General Electric Inc. (US)
- Havells India Limited (India)
- Iem (Malaysia)
- Larsen & Toubro Limited (India)
- Legrand (France)
- Lewden Palazzoli (Italy)
- Lyntec (US)
- Nhp Electrical Engineering Products Pty Ltd (Australia)
- Omran Holding Group (Saudi Arabia)
- S. J. Controls (UAE)
- Schneider Electric (France)
- Sdk Power Tech (South Korea)
- Siemens Ag (Germany)
- Sterlite Power Transmission Ltd. (India) and Other Major Players
Key Industry Developments in the Distribution Boards Market:
- In November 2023, ABB launched Protecta Power panel board supporting flexible power distribution.
-
In November 2023, ABB introduced Protecta Power, its latest panel board designed for commercial, industrial, and institutional buildings. Equipped with advanced digital monitoring and control, Protecta Power ensures stable and flexible power distribution. The innovative Tmax XT smart molded case circuit breakers (MCCBs) enable integrated protection, control, and remote monitoring capabilities. With optional remote sub-metering, users can conveniently access consumption and billing data. Protecta Power sets a new standard for reliable, smart electrical distribution across diverse facilities.
|
Global Distribution Boards Market |
|||
|
Base Year: |
2023 |
Forecast Period: |
2024-2032 |
|
Historical Data: |
2017 to 2023 |
Market Size in 2023: |
USD 6.29 Bn. |
|
Forecast Period 2023-30 CAGR: |
7.40% |
Market Size in 2032: |
USD 11.96 Bn. |
|
Segments Covered: |
By Voltage Type |
|
|
|
By End User |
|
||
|
By Region |
|
||
|
Key Market Drivers: |
|
||
|
Key Market Restraints: |
|
||
|
Key Opportunities: |
|
||
|
Companies Covered in the report: |
|
||
Chapter 1: Introduction
1.1 Scope and Coverage
Chapter 2:Executive Summary
Chapter 3: Market Landscape
3.1 Market Dynamics
3.1.1 Drivers
3.1.2 Restraints
3.1.3 Opportunities
3.1.4 Challenges
3.2 Market Trend Analysis
3.3 PESTLE Analysis
3.4 Porter's Five Forces Analysis
3.5 Industry Value Chain Analysis
3.6 Ecosystem
3.7 Regulatory Landscape
3.8 Price Trend Analysis
3.9 Patent Analysis
3.10 Technology Evolution
3.11 Investment Pockets
3.12 Import-Export Analysis
Chapter 4: Distribution Boards Market by Voltage Type (2018-2032)
4.1 Distribution Boards Market Snapshot and Growth Engine
4.2 Market Overview
4.3 Low Voltage
4.3.1 Introduction and Market Overview
4.3.2 Historic and Forecasted Market Size in Value USD and Volume Units
4.3.3 Key Market Trends, Growth Factors, and Opportunities
4.3.4 Geographic Segmentation Analysis
4.4 Medium Voltage
Chapter 5: Distribution Boards Market by End User (2018-2032)
5.1 Distribution Boards Market Snapshot and Growth Engine
5.2 Market Overview
5.3 Transmission & Distribution Utilities
5.3.1 Introduction and Market Overview
5.3.2 Historic and Forecasted Market Size in Value USD and Volume Units
5.3.3 Key Market Trends, Growth Factors, and Opportunities
5.3.4 Geographic Segmentation Analysis
5.4 Manufacturing & Processing Industry
5.5 Commercial & Residential Sector
Chapter 6: Company Profiles and Competitive Analysis
6.1 Competitive Landscape
6.1.1 Competitive Benchmarking
6.1.2 Distribution Boards Market Share by Manufacturer (2024)
6.1.3 Industry BCG Matrix
6.1.4 Heat Map Analysis
6.1.5 Mergers and Acquisitions
6.2 CARGILL INCORPORATED (U.S.)
6.2.1 Company Overview
6.2.2 Key Executives
6.2.3 Company Snapshot
6.2.4 Role of the Company in the Market
6.2.5 Sustainability and Social Responsibility
6.2.6 Operating Business Segments
6.2.7 Product Portfolio
6.2.8 Business Performance
6.2.9 Key Strategic Moves and Recent Developments
6.2.10 SWOT Analysis
6.3 CP KELCO U.SINC. (U.S.)
6.4 INTERNATIONAL FLAVORS & FRAGRANCES INC. (U.S.)
6.5 FMC CORPORATION (U.S.)
6.6 ADM (U.S.)
6.7 INGREDION INCORPORATED (U.S.)
6.8 TATE & LYLE INGREDIENTS AMERICAS LLC (U.S.)
6.9 SYMRISE AG (GERMANY)
6.10 DÖHLER GMBH (GERMANY)
6.11 KERRY GROUP PLC (IRELAND)
6.12 CHR. HANSEN HOLDING A/S (DENMARK)
6.13 AAK AB (SWEDEN)
6.14 CORBION INC (NETHERLANDS)
6.15 KONINKLIJKE DSM N.V. (NETHERLANDS)
6.16 FIRMENICH SA. (SWITZERLAND)
6.17
Chapter 7: Global Distribution Boards Market By Region
7.1 Overview
7.2. North America Distribution Boards Market
7.2.1 Key Market Trends, Growth Factors and Opportunities
7.2.2 Top Key Companies
7.2.3 Historic and Forecasted Market Size by Segments
7.2.4 Historic and Forecasted Market Size by Voltage Type
7.2.4.1 Low Voltage
7.2.4.2 Medium Voltage
7.2.5 Historic and Forecasted Market Size by End User
7.2.5.1 Transmission & Distribution Utilities
7.2.5.2 Manufacturing & Processing Industry
7.2.5.3 Commercial & Residential Sector
7.2.6 Historic and Forecast Market Size by Country
7.2.6.1 US
7.2.6.2 Canada
7.2.6.3 Mexico
7.3. Eastern Europe Distribution Boards Market
7.3.1 Key Market Trends, Growth Factors and Opportunities
7.3.2 Top Key Companies
7.3.3 Historic and Forecasted Market Size by Segments
7.3.4 Historic and Forecasted Market Size by Voltage Type
7.3.4.1 Low Voltage
7.3.4.2 Medium Voltage
7.3.5 Historic and Forecasted Market Size by End User
7.3.5.1 Transmission & Distribution Utilities
7.3.5.2 Manufacturing & Processing Industry
7.3.5.3 Commercial & Residential Sector
7.3.6 Historic and Forecast Market Size by Country
7.3.6.1 Russia
7.3.6.2 Bulgaria
7.3.6.3 The Czech Republic
7.3.6.4 Hungary
7.3.6.5 Poland
7.3.6.6 Romania
7.3.6.7 Rest of Eastern Europe
7.4. Western Europe Distribution Boards Market
7.4.1 Key Market Trends, Growth Factors and Opportunities
7.4.2 Top Key Companies
7.4.3 Historic and Forecasted Market Size by Segments
7.4.4 Historic and Forecasted Market Size by Voltage Type
7.4.4.1 Low Voltage
7.4.4.2 Medium Voltage
7.4.5 Historic and Forecasted Market Size by End User
7.4.5.1 Transmission & Distribution Utilities
7.4.5.2 Manufacturing & Processing Industry
7.4.5.3 Commercial & Residential Sector
7.4.6 Historic and Forecast Market Size by Country
7.4.6.1 Germany
7.4.6.2 UK
7.4.6.3 France
7.4.6.4 The Netherlands
7.4.6.5 Italy
7.4.6.6 Spain
7.4.6.7 Rest of Western Europe
7.5. Asia Pacific Distribution Boards Market
7.5.1 Key Market Trends, Growth Factors and Opportunities
7.5.2 Top Key Companies
7.5.3 Historic and Forecasted Market Size by Segments
7.5.4 Historic and Forecasted Market Size by Voltage Type
7.5.4.1 Low Voltage
7.5.4.2 Medium Voltage
7.5.5 Historic and Forecasted Market Size by End User
7.5.5.1 Transmission & Distribution Utilities
7.5.5.2 Manufacturing & Processing Industry
7.5.5.3 Commercial & Residential Sector
7.5.6 Historic and Forecast Market Size by Country
7.5.6.1 China
7.5.6.2 India
7.5.6.3 Japan
7.5.6.4 South Korea
7.5.6.5 Malaysia
7.5.6.6 Thailand
7.5.6.7 Vietnam
7.5.6.8 The Philippines
7.5.6.9 Australia
7.5.6.10 New Zealand
7.5.6.11 Rest of APAC
7.6. Middle East & Africa Distribution Boards Market
7.6.1 Key Market Trends, Growth Factors and Opportunities
7.6.2 Top Key Companies
7.6.3 Historic and Forecasted Market Size by Segments
7.6.4 Historic and Forecasted Market Size by Voltage Type
7.6.4.1 Low Voltage
7.6.4.2 Medium Voltage
7.6.5 Historic and Forecasted Market Size by End User
7.6.5.1 Transmission & Distribution Utilities
7.6.5.2 Manufacturing & Processing Industry
7.6.5.3 Commercial & Residential Sector
7.6.6 Historic and Forecast Market Size by Country
7.6.6.1 Turkiye
7.6.6.2 Bahrain
7.6.6.3 Kuwait
7.6.6.4 Saudi Arabia
7.6.6.5 Qatar
7.6.6.6 UAE
7.6.6.7 Israel
7.6.6.8 South Africa
7.7. South America Distribution Boards Market
7.7.1 Key Market Trends, Growth Factors and Opportunities
7.7.2 Top Key Companies
7.7.3 Historic and Forecasted Market Size by Segments
7.7.4 Historic and Forecasted Market Size by Voltage Type
7.7.4.1 Low Voltage
7.7.4.2 Medium Voltage
7.7.5 Historic and Forecasted Market Size by End User
7.7.5.1 Transmission & Distribution Utilities
7.7.5.2 Manufacturing & Processing Industry
7.7.5.3 Commercial & Residential Sector
7.7.6 Historic and Forecast Market Size by Country
7.7.6.1 Brazil
7.7.6.2 Argentina
7.7.6.3 Rest of SA
Chapter 8 Analyst Viewpoint and Conclusion
8.1 Recommendations and Concluding Analysis
8.2 Potential Market Strategies
Chapter 9 Research Methodology
9.1 Research Process
9.2 Primary Research
9.3 Secondary Research
|
Global Distribution Boards Market |
|||
|
Base Year: |
2023 |
Forecast Period: |
2024-2032 |
|
Historical Data: |
2017 to 2023 |
Market Size in 2023: |
USD 6.29 Bn. |
|
Forecast Period 2023-30 CAGR: |
7.40% |
Market Size in 2032: |
USD 11.96 Bn. |
|
Segments Covered: |
By Voltage Type |
|
|
|
By End User |
|
||
|
By Region |
|
||
|
Key Market Drivers: |
|
||
|
Key Market Restraints: |
|
||
|
Key Opportunities: |
|
||
|
Companies Covered in the report: |
|
||


