


Dietary Fibers Market Synopsis
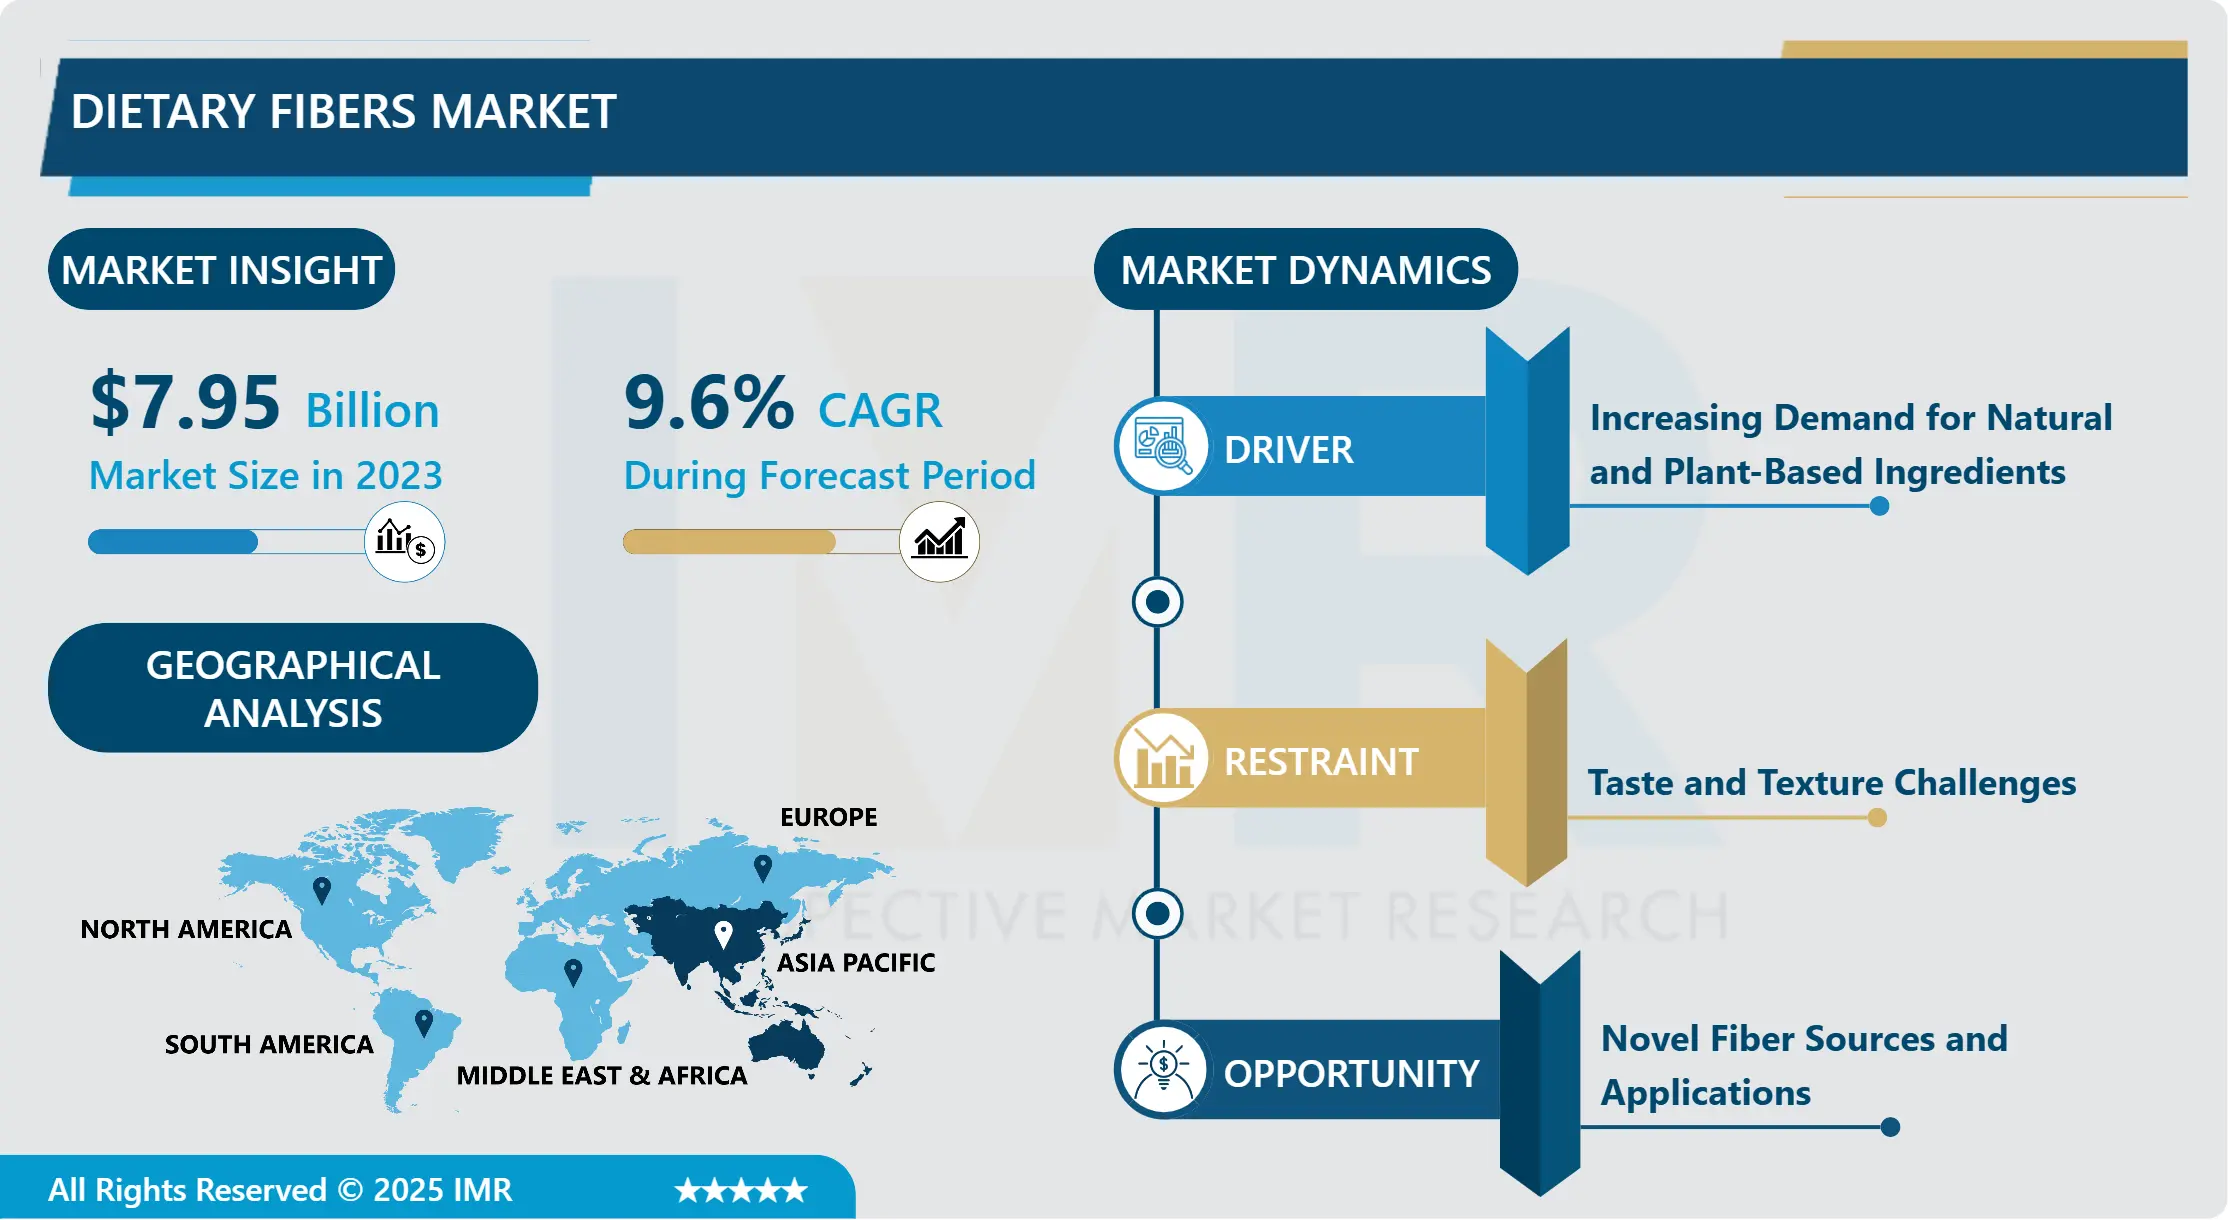
Dietary Fibers Market Size Was Valued at USD 8.71 Billion in 2024 and is Projected to Reach USD 18.14 Billion by 2032, Growing at a CAGR of 9.6% From 2025-2032.
Dietary fibers are indigestible plant-based carbohydrates that pass through the digestive system, supporting gut health, regulating blood sugar, and lowering cholesterol. Found in fruits, vegetables, whole grains, and legumes, they are categorized as soluble (dissolves in water) or insoluble (adds bulk to stool), aiding digestion and promoting overall health.
The global dietary fibers market is expected to experience significant growth due to a shift from pharmaceutical to nutraceutical products and increasing investments in the pharmaceutical industry. Rising consumer awareness about the importance of maintaining a healthy diet to prevent lifestyle diseases such as hypertension, diabetes, and cardiovascular issues is driving the demand for dietary fibers. Fresh fruits and vegetables, rich in soluble and insoluble fibres, cater to various health needs, making dietary fibers a key element in promoting overall well-being and digestive health.
The demand for dietary fibers is further fueled by concerns over lifestyle-related diseases and the growing recognition of fibres' health benefits, particularly for cardiovascular health and digestive function. Soluble fibers are known to help lower LDL cholesterol levels, contributing to better heart health, and this is expected to drive market growth. The increasing preference for natural and clean-label products, along with weight management concerns, is pushing manufacturers to fortify food products with fibres to meet consumer demand for functional foods.
Dietary fiber supplements are designed to regulate gastrointestinal issues and enhance general well-being, heightened interest in functional foods and drinks enriched with dietary fibers, increased recognition of the health advantages of dietary fibers, the growth of the clean label movement, and the implementation of sustainable sourcing and manufacturing practices.

Dietary Fibers Market Trend Analysis
Increasing Demand for Natural and Plant-Based Ingredients
- The rising desire for natural and plant-based ingredients stands as a pivotal driving factor propelling the growth of the dietary fibers market. With a heightened emphasis on health and wellness globally, consumers are increasingly drawn to products perceived as wholesome, unadulterated, and minimally processed. Natural and plant-based ingredients, encompassing fruits, vegetables, grains, legumes, nuts, and seeds, inherently boast rich stores of dietary fibers, offering an array of health advantages.
- Consumers are actively seeking out foods and beverages incorporating these natural fibers to bolster digestive health, manage weight, and enhance overall well-being. Furthermore, the surging popularity of plant-centric diets and vegetarian/vegan lifestyles further amplifies the demand for fiber-rich plant sources.
- The clean label movement, advocating for transparency and simplicity in food ingredients, prompts manufacturers to prioritize natural and plant-based fibers over synthetic or chemically derived alternatives. Consequently, the escalating quest for natural and plant-based ingredients continues to fuel the expansion of the dietary fibers market, with consumers gravitating towards products aligning with their health-conscious and ethical preferences.
Novel Fiber Sources and Applications
- The advent of innovative fiber sources and their versatile applications represents a significant opportunity within the dietary fibers market. Emerging sources such as seaweed, algae, fruit peels, and food processing by-products introduce novel possibilities for integrating dietary fibers into a wide array of products. These fresh sources not only diversify the range of available fibers but also offer distinctive nutritional profiles and functional attributes.
- The utilization of these novel fiber sources extends across various sectors, including the food and beverage industry, pharmaceuticals, and dietary supplements. In food and beverages, these fibers can fortify an assortment of products like baked goods, snacks, dairy alternatives, and functional beverages. In pharmaceuticals, they can be incorporated into dietary supplements or pharmaceutical formulations targeting specific health concerns. Moreover, leveraging novel fiber sources in dietary supplements presents opportunities for crafting innovative formulations tailored to cater to specific consumer demographics or health needs.
- Novel fiber sources are addressing sustainability concerns in the food industry by utilizing underutilized materials, reducing waste, and promoting circular economy principles. These sources offer health benefits beyond traditional fibers, such as antioxidant properties and immune-boosting effects. As consumer awareness of fiber-rich diets grows, manufacturers can differentiate their products and meet the demand for functional foods and beverages. By leveraging these innovative ingredients, the dietary fibers market can capitalize on growing consumer interest in health, sustainability, and novel food experiences.
Dietary Fibers Market Segment Analysis:
Dietary Fibers Market Segmented based on type, application, and end-users.
By Type, Soluble Dietary Fibers segment is expected to dominate the market during the forecast period
- The dominance of the Soluble Dietary Fibers segment in the dietary fibers market can be attributed to several factors. Firstly, these fibers possess distinctive functional characteristics, rendering them highly adaptable and sought after across various applications. Soluble fibers, including types like pectin, beta-glucan, and inulin, exhibit the ability to dissolve in water, forming viscous solutions that enhance the texture, mouthfeel, and stability of food and beverage products.
- Furthermore, soluble dietary fibers offer an array of health advantages, such as lowering cholesterol, regulating blood sugar levels, and promoting digestive health. With increasing consumer awareness regarding health consciousness and the desire for products supporting overall well-being, there's a growing demand for soluble fiber-enriched foods and supplements. Soluble fibers are typically sourced from natural origins like fruits, vegetables, and grains, aligning with consumer preferences for clean-label ingredients. This further drives the popularity of products containing soluble dietary fibers in the market.
- Soluble dietary fibers form gel-like substances in the digestive tract, slowing down nutrient absorption, and making them beneficial for managing blood sugar levels and reducing cardiovascular disease risk. They also support gut health by serving as a prebiotic substrate for beneficial bacteria in the colon, leading to the increased popularity of soluble fiber-rich foods and supplements.
By Raw Materials, the Cereals & Grains segment is expected to dominate the market during the forecast period
- The dominance of the Cereals & Grains segment in the dietary fibers market is anticipated for several compelling reasons. Firstly, cereals and grains stand as widely consumed and abundant sources of dietary fibers globally, offering vital nutrients and fiber-rich components like bran, husks, and germ. Their prevalence and accessibility make them favored choices for integrating dietary fibers into a diverse array of food and beverage products.
- Moreover, cereals and grains provide formulation versatility, enabling the creation of fiber-rich products with various textures, flavors, and applications. They can be easily processed into forms such as flours, bran, and flakes, suitable for incorporation into bakery items, breakfast cereals, snacks, and functional foods.
- Additionally, the increasing awareness among consumers regarding the health advantages associated with fiber-rich diets, including enhanced digestive health, weight management, and lowered risk of chronic diseases, drives demand for cereals and grains as sources of dietary fibers. As consumers increasingly seek healthier food alternatives, manufacturers are responding by enriching their products with fiber-rich ingredients, thereby reinforcing the dominance of the Cereals & Grains segment in the dietary fibers market.
Dietary Fibers Market Regional Insights:
Asia Pacific is Expected to Dominate the Market Over the Forecast period
- Asia Pacific is poised to lead the dietary fibers market for several compelling reasons. Firstly, the region's substantial and swiftly expanding population, particularly in nations like China, India, and various Southeast Asian countries, propels considerable demand for functional foods and beverages, including those fortified with dietary fibers. As health awareness rises among consumers in Asia Pacific, there is a heightened interest in products that promote digestive health, weight management, and overall wellness, fueling the need for fiber-rich options.
- Rapid urbanization and evolving lifestyles within the region contribute to dietary changes, with a growing consumption of processed foods and sedentary behaviors. This shift increases the demand for fiber-enriched products to counteract adverse health effects associated with urban living, such as digestive ailments and obesity.
- Governmental efforts to encourage healthier eating habits and address diet-related health issues are further driving the adoption of fiber-rich diets across many Asia Pacific nations. These collective factors position Asia Pacific as a dominant player in the dietary fibers market, offering significant opportunities for market expansion and growth in the region.
Dietary Fibers Market Top Key Players:
- Cargill, Incorporated (US)
- DuPont de Nemours, Inc. (US)
- Archer Daniels Midland Company (ADM) (US)
- Ingredion Incorporated (US)
- Grain Processing Corporation (GPC) (US)
- Fiberstar, Inc. (US)
- Grain Millers, Inc. (US)
- NOW Health Group, Inc. (US)
- CP Kelco (US)
- Nutri-Pea Limited (Canada)
- SunOpta, Inc. (Canada)
- BENEO GmbH (Germany)
- J. Rettenmaier & Söhne GmbH (JRS) (Germany)
- KONINKLIJKE DSM N.V. (DSM) (Netherlands)
- Sensus BV (Netherlands)
- Roquette Frères (France)
- Nexira SAS (France)
- Tate & Lyle PLC (UK)
- Kerry Group plc (Ireland)
- Lonza Group Ltd. (Switzerland)
- Cosucra Groupe Warcoing SA (Belgium)
- Taiyo International, Inc. (Japan)
- Shandong Baolingbao Biology Co., Ltd. (China)
- GELYMAR S.A. (Chile), and Other Active Players.
Key Industry Developments in the Dietary Fibers Market:
-
In May 2023, Nestlé India announced the launch of Resource Fiber Choice, a gut health product featuring Partially Hydrolyzed Guar Gum (PHGG), a prebiotic fiber derived from guar gum beans. Designed to relieve constipation and improve gut health, the product offered a gentle solution enriched with Immuno-Nutrients, delivering 30% of the daily allowance of essential vitamins and minerals. This innovation marked Nestlé’s commitment to enhancing digestive wellness.
-
In February 2023, Azelis, a leading distributor in the specialty chemicals and food ingredients industry, announced a distribution agreement with Tereos. The partnership expanded Azelis' portfolio to include native starches, maltodextrin, gluten, dietary fibers, sugars, and sweeteners. This collaboration enhanced Azelis' offerings in the food and animal nutrition markets, reinforcing its position as a comprehensive solutions provider in these sectors.
|
Dietary Fibers Market |
|||
|
Base Year: |
2024 |
Forecast Period: |
2025-2032 |
|
Historical Data: |
2018 to 2023 |
Market Size in 2024: |
USD 8.71 Bn. |
|
Forecast Period 2025-32 CAGR: |
9.6 % |
Market Size in 2032: |
USD 18.14 Bn. |
|
Segments Covered: |
By Type |
|
|
|
By Raw Material |
|
||
|
By End-User |
|
||
|
By Region |
|
||
|
Key Market Drivers: |
|
||
|
Key Market Restraints: |
|
||
|
Key Opportunities: |
|
||
|
Companies Covered in the Report: |
|
||
Chapter 1: Introduction
1.1 Scope and Coverage
Chapter 2:Executive Summary
Chapter 3: Market Landscape
3.1 Market Dynamics
3.1.1 Drivers
3.1.2 Restraints
3.1.3 Opportunities
3.1.4 Challenges
3.2 Market Trend Analysis
3.3 PESTLE Analysis
3.4 Porter's Five Forces Analysis
3.5 Industry Value Chain Analysis
3.6 Ecosystem
3.7 Regulatory Landscape
3.8 Price Trend Analysis
3.9 Patent Analysis
3.10 Technology Evolution
3.11 Investment Pockets
3.12 Import-Export Analysis
Chapter 4: Dietary Fibers Market by Type (2018-2032)
4.1 Dietary Fibers Market Snapshot and Growth Engine
4.2 Market Overview
4.3 Soluble Dietary Fibers
4.3.1 Introduction and Market Overview
4.3.2 Historic and Forecasted Market Size in Value USD and Volume Units
4.3.3 Key Market Trends, Growth Factors, and Opportunities
4.3.4 Geographic Segmentation Analysis
4.4 Insoluble Dietary Fibers
4.5 Resistant Starch
4.6 Functional Fiber
Chapter 5: Dietary Fibers Market by Raw Material (2018-2032)
5.1 Dietary Fibers Market Snapshot and Growth Engine
5.2 Market Overview
5.3 Fruits & Vegetables
5.3.1 Introduction and Market Overview
5.3.2 Historic and Forecasted Market Size in Value USD and Volume Units
5.3.3 Key Market Trends, Growth Factors, and Opportunities
5.3.4 Geographic Segmentation Analysis
5.4 Cereals & Grains
5.5 Legumes & Nuts & Seeds
Chapter 6: Dietary Fibers Market by End-User (2018-2032)
6.1 Dietary Fibers Market Snapshot and Growth Engine
6.2 Market Overview
6.3 Food & Beverage Industry
6.3.1 Introduction and Market Overview
6.3.2 Historic and Forecasted Market Size in Value USD and Volume Units
6.3.3 Key Market Trends, Growth Factors, and Opportunities
6.3.4 Geographic Segmentation Analysis
6.4 Pharmaceutical Industry
6.5 Animal Feed Industry
6.6 Dietary Supplement Manufacturers
Chapter 7: Company Profiles and Competitive Analysis
7.1 Competitive Landscape
7.1.1 Competitive Benchmarking
7.1.2 Dietary Fibers Market Share by Manufacturer (2024)
7.1.3 Industry BCG Matrix
7.1.4 Heat Map Analysis
7.1.5 Mergers and Acquisitions
7.2 KELLOGG COMPANY (US)
7.2.1 Company Overview
7.2.2 Key Executives
7.2.3 Company Snapshot
7.2.4 Role of the Company in the Market
7.2.5 Sustainability and Social Responsibility
7.2.6 Operating Business Segments
7.2.7 Product Portfolio
7.2.8 Business Performance
7.2.9 Key Strategic Moves and Recent Developments
7.2.10 SWOT Analysis
7.3 GENERAL MILLS INC. (US)
7.4 MOM BRANDS COMPANY (POST HOLDINGS) (US)
7.5 KASHI COMPANY (KELLOGG) (US)
7.6 BARBARA'S BAKERY (POST HOLDINGS) (US)
7.7 HAIN CELESTIAL GROUP INC. (US)
7.8 ATTUNE FOODS (US)
7.9 ARROWHEAD MILLS INC. (US)
7.10 POST-CONSUMER BRANDS (US)
7.11 GLANBIA PLC (IRELAND)
7.12 GOLDEN TEMPLE (US)
7.13 MCCANN'S IRISH OATMEAL (US)
7.14 POST HOLDINGS INC. (US)
7.15 NATURE'S PATH FOODS INC. (CANADA)
7.16 BACK TO NATURE FOODS COMPANY
7.17 LLC (US)
7.18 PEPSICO INC. (US)
7.19 THE QUAKER OATS COMPANY (US)
7.20 WEETABIX LIMITED (UK)
7.21 DORSET CEREALS (UK)
7.22 SANTE NATURKOSMETIK (GERMANY)
7.23 CEREAL PARTNERS WORLDWIDE (SWITZERLAND)
7.24 NESTLÉ S.A. (SWITZERLAND)
7.25 RAISIO GROUP (FINLAND)
7.26 FREEDOM FOODS GROUP LIMITED (AUSTRALIA)
7.27 MARICO LIMITED (INDIA)
Chapter 8: Global Dietary Fibers Market By Region
8.1 Overview
8.2. North America Dietary Fibers Market
8.2.1 Key Market Trends, Growth Factors and Opportunities
8.2.2 Top Key Companies
8.2.3 Historic and Forecasted Market Size by Segments
8.2.4 Historic and Forecasted Market Size by Type
8.2.4.1 Soluble Dietary Fibers
8.2.4.2 Insoluble Dietary Fibers
8.2.4.3 Resistant Starch
8.2.4.4 Functional Fiber
8.2.5 Historic and Forecasted Market Size by Raw Material
8.2.5.1 Fruits & Vegetables
8.2.5.2 Cereals & Grains
8.2.5.3 Legumes & Nuts & Seeds
8.2.6 Historic and Forecasted Market Size by End-User
8.2.6.1 Food & Beverage Industry
8.2.6.2 Pharmaceutical Industry
8.2.6.3 Animal Feed Industry
8.2.6.4 Dietary Supplement Manufacturers
8.2.7 Historic and Forecast Market Size by Country
8.2.7.1 US
8.2.7.2 Canada
8.2.7.3 Mexico
8.3. Eastern Europe Dietary Fibers Market
8.3.1 Key Market Trends, Growth Factors and Opportunities
8.3.2 Top Key Companies
8.3.3 Historic and Forecasted Market Size by Segments
8.3.4 Historic and Forecasted Market Size by Type
8.3.4.1 Soluble Dietary Fibers
8.3.4.2 Insoluble Dietary Fibers
8.3.4.3 Resistant Starch
8.3.4.4 Functional Fiber
8.3.5 Historic and Forecasted Market Size by Raw Material
8.3.5.1 Fruits & Vegetables
8.3.5.2 Cereals & Grains
8.3.5.3 Legumes & Nuts & Seeds
8.3.6 Historic and Forecasted Market Size by End-User
8.3.6.1 Food & Beverage Industry
8.3.6.2 Pharmaceutical Industry
8.3.6.3 Animal Feed Industry
8.3.6.4 Dietary Supplement Manufacturers
8.3.7 Historic and Forecast Market Size by Country
8.3.7.1 Russia
8.3.7.2 Bulgaria
8.3.7.3 The Czech Republic
8.3.7.4 Hungary
8.3.7.5 Poland
8.3.7.6 Romania
8.3.7.7 Rest of Eastern Europe
8.4. Western Europe Dietary Fibers Market
8.4.1 Key Market Trends, Growth Factors and Opportunities
8.4.2 Top Key Companies
8.4.3 Historic and Forecasted Market Size by Segments
8.4.4 Historic and Forecasted Market Size by Type
8.4.4.1 Soluble Dietary Fibers
8.4.4.2 Insoluble Dietary Fibers
8.4.4.3 Resistant Starch
8.4.4.4 Functional Fiber
8.4.5 Historic and Forecasted Market Size by Raw Material
8.4.5.1 Fruits & Vegetables
8.4.5.2 Cereals & Grains
8.4.5.3 Legumes & Nuts & Seeds
8.4.6 Historic and Forecasted Market Size by End-User
8.4.6.1 Food & Beverage Industry
8.4.6.2 Pharmaceutical Industry
8.4.6.3 Animal Feed Industry
8.4.6.4 Dietary Supplement Manufacturers
8.4.7 Historic and Forecast Market Size by Country
8.4.7.1 Germany
8.4.7.2 UK
8.4.7.3 France
8.4.7.4 The Netherlands
8.4.7.5 Italy
8.4.7.6 Spain
8.4.7.7 Rest of Western Europe
8.5. Asia Pacific Dietary Fibers Market
8.5.1 Key Market Trends, Growth Factors and Opportunities
8.5.2 Top Key Companies
8.5.3 Historic and Forecasted Market Size by Segments
8.5.4 Historic and Forecasted Market Size by Type
8.5.4.1 Soluble Dietary Fibers
8.5.4.2 Insoluble Dietary Fibers
8.5.4.3 Resistant Starch
8.5.4.4 Functional Fiber
8.5.5 Historic and Forecasted Market Size by Raw Material
8.5.5.1 Fruits & Vegetables
8.5.5.2 Cereals & Grains
8.5.5.3 Legumes & Nuts & Seeds
8.5.6 Historic and Forecasted Market Size by End-User
8.5.6.1 Food & Beverage Industry
8.5.6.2 Pharmaceutical Industry
8.5.6.3 Animal Feed Industry
8.5.6.4 Dietary Supplement Manufacturers
8.5.7 Historic and Forecast Market Size by Country
8.5.7.1 China
8.5.7.2 India
8.5.7.3 Japan
8.5.7.4 South Korea
8.5.7.5 Malaysia
8.5.7.6 Thailand
8.5.7.7 Vietnam
8.5.7.8 The Philippines
8.5.7.9 Australia
8.5.7.10 New Zealand
8.5.7.11 Rest of APAC
8.6. Middle East & Africa Dietary Fibers Market
8.6.1 Key Market Trends, Growth Factors and Opportunities
8.6.2 Top Key Companies
8.6.3 Historic and Forecasted Market Size by Segments
8.6.4 Historic and Forecasted Market Size by Type
8.6.4.1 Soluble Dietary Fibers
8.6.4.2 Insoluble Dietary Fibers
8.6.4.3 Resistant Starch
8.6.4.4 Functional Fiber
8.6.5 Historic and Forecasted Market Size by Raw Material
8.6.5.1 Fruits & Vegetables
8.6.5.2 Cereals & Grains
8.6.5.3 Legumes & Nuts & Seeds
8.6.6 Historic and Forecasted Market Size by End-User
8.6.6.1 Food & Beverage Industry
8.6.6.2 Pharmaceutical Industry
8.6.6.3 Animal Feed Industry
8.6.6.4 Dietary Supplement Manufacturers
8.6.7 Historic and Forecast Market Size by Country
8.6.7.1 Turkiye
8.6.7.2 Bahrain
8.6.7.3 Kuwait
8.6.7.4 Saudi Arabia
8.6.7.5 Qatar
8.6.7.6 UAE
8.6.7.7 Israel
8.6.7.8 South Africa
8.7. South America Dietary Fibers Market
8.7.1 Key Market Trends, Growth Factors and Opportunities
8.7.2 Top Key Companies
8.7.3 Historic and Forecasted Market Size by Segments
8.7.4 Historic and Forecasted Market Size by Type
8.7.4.1 Soluble Dietary Fibers
8.7.4.2 Insoluble Dietary Fibers
8.7.4.3 Resistant Starch
8.7.4.4 Functional Fiber
8.7.5 Historic and Forecasted Market Size by Raw Material
8.7.5.1 Fruits & Vegetables
8.7.5.2 Cereals & Grains
8.7.5.3 Legumes & Nuts & Seeds
8.7.6 Historic and Forecasted Market Size by End-User
8.7.6.1 Food & Beverage Industry
8.7.6.2 Pharmaceutical Industry
8.7.6.3 Animal Feed Industry
8.7.6.4 Dietary Supplement Manufacturers
8.7.7 Historic and Forecast Market Size by Country
8.7.7.1 Brazil
8.7.7.2 Argentina
8.7.7.3 Rest of SA
Chapter 9 Analyst Viewpoint and Conclusion
9.1 Recommendations and Concluding Analysis
9.2 Potential Market Strategies
Chapter 10 Research Methodology
10.1 Research Process
10.2 Primary Research
10.3 Secondary Research
|
Dietary Fibers Market |
|||
|
Base Year: |
2024 |
Forecast Period: |
2025-2032 |
|
Historical Data: |
2018 to 2023 |
Market Size in 2024: |
USD 8.71 Bn. |
|
Forecast Period 2025-32 CAGR: |
9.6 % |
Market Size in 2032: |
USD 18.14 Bn. |
|
Segments Covered: |
By Type |
|
|
|
By Raw Material |
|
||
|
By End-User |
|
||
|
By Region |
|
||
|
Key Market Drivers: |
|
||
|
Key Market Restraints: |
|
||
|
Key Opportunities: |
|
||
|
Companies Covered in the Report: |
|
||


