


Dairy Blends Market Overview
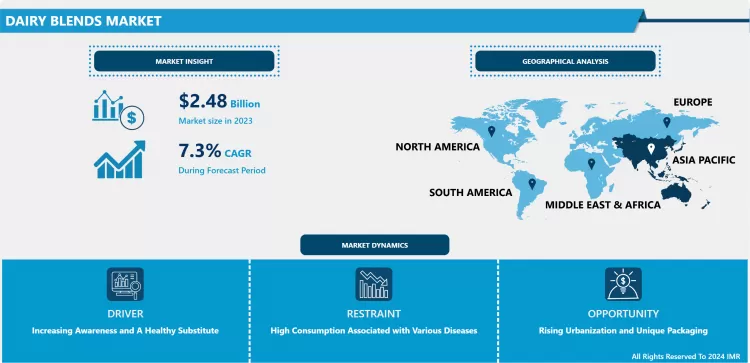
Dairy Blends Market Was Valued at USD 2.48 Billion in 2023 and is Projected to Reach USD 4.68 Billion by 2032, Growing at a CAGR of 7.3% from 2024 to 2032.
Dairy blends are dairy mixtures which are made from concentrated cream or butter and are mixed with vegetable oils. Dairy blends provide additional nutrition and an absolute taste enhancement to the products. The high cost of traditional dairy products, combined with the significant health benefits of dairy blends, has been cushioning the dairy blends industry globally. Varied taste and flavors cater the growing demand of dairy blends market. Moreover, dairy blends can be utilized in various forms in industries. For instance, dairy blends can be used in powdered form as stabilizers and sweeteners in many icecreams and yogurts. The inclination of consumers towards a healthy and nutritious alternative with low- fat content, and great taste is most likely to drive the market growth of dairy blends in the forecasted years. Dairy blends are also an excellent option for traditional baby foods such as rice and porridge as the dairy blends help in cutting down the time needed to cook baby food. Additionally, they possess essential nutrients that enhances baby health. Thus, the numerous applications in different industries and households, product advances and the increase in blending technology are estimated to boost the dairy blends market growth over the projected period.

Market Dynamics And Factors For Dairy Blends Market
Drivers:
Increasing Awareness and A Healthy Substitute
- Owing to the changes in social and economic patterns and rapid increase in awareness about healthy foods, the functional dairy blends are widely utilized in many food processing units. The demand for dairy blend products is growing faster as consumers are becoming aware about the health benefits associated by consumption such as reduced risk of diabetes, improvement in immunity and others. Dairy blends are becoming popular among the working- class people, children as well as bachelors due to the enhanced taste and a healthy substitute to the rich in oil and fat products as well as milk powders and traditional products. Healthy substitutes, such as dairy snacks from dairy blends are easily available, convenient, ready-to-eat and fuel the human body. Moreover, the changing buyer power, changes in meal pattern and food habits and the desire to switch for healthy substitutes is driving the market growth of dairy blends.
Restraints:
High Consumption Associated with Various Diseases
- The dairy blends market is growing rapidly due to the high consumption of spreadable dairy blends as it can be used as a low-fat alternative to margarine and butter. However, high consumption of such blended products may lead to emergence of various diseases and restrict the growth of the dairy blends market. Consuming such products on a daily basis may cause various gastrointestinal problems and heart diseases and further cause a decline in dairy blends industry. People who are lactose intolerant may also face several side effects with the consumption of dairy blends. Henceforth, the high consumption may lead to a decline in the market growth over the projected period.
Opportunity:
Rising Urbanization and Unique Packaging
- Rising urbanization and hectic lifestyle have brought a considerable impact on the dairy blends market growth in recent years. A busier lifestyle has made it more difficult for both women and men to cook food at home, and even worsens in the case of working moms who have to manage both home and kids. In such cases, dairy blends have emerged as a perfect alternative to traditional baby foods such as rice or porridge. They cut down the time for cooking food and possess essential nutrients required to promote baby health. Furthermore, the market players in the dairy blends industry are upbringing innovations with different flavors, aggressive marketing strategies and attractive packagings that garners the market growth of dairy blends and ultimately provides an opportunity for rapid development over the projected period.
Segmentation Analysis Of Dairy Blends Market
- By Type, Dairy as functional ingredient is estimate to dominate the dairy blends market over the projected period. Milk and dairy products such as yogurt and cheese are essential for delivering functional ingredients. Functional foods or ingredients are essential to enhance human health and dairy blends play a vital role in supplying functional ingredients. Additionally, they also provide bioactive proteins, fiber and probiotic bacteria through consumption which drives the market growth and helps the functional ingredient segment to dominate the market.
- By Application, Bakery segment is expected to hold the largest share in the upcoming years. Increase in awareness related to health benefits, is propelling the demand for low-calorie bakery products among consumers. This is estimated to boost the market for dairy blends as functional ingredients in this particular segment. Dairy blends are further a cost-effective alternative to butter, with comparatively low- fat content, and do not have any negative impact on the product taste like margarine does. Hence, their demand in bakery as a replacement for these two ingredients is rapidly increasing.
- By Form, Spreadable form of dairy blends market segment is anticipated to grow rapidly in the upcoming years. The spreadable form is easy and convenient to use in various food processing units. The spreadable form is majorly used as a substitute for butter and margarine and led to rise in demand for the same. This form has many applications in industries such as bakery, ice cream, yogurt cheese & butter blends, feed and infant formula. These factors are increasing the demand for spreadable form of dairy blends.
Regional Analysis Of Dairy Blends Market
- Asia-Pacific is projected to dominate the dairy blends market in thee forecasted period. Rapid increase in disposable income as well as growth in demand from developing nations such as India, Japan, China and South Korea and the presence of a large-scale dairy sector in Australia & New Zealand are most likely to drive the market growth in the Asia Pacific region. Rising concerns regarding health and rapid increase in urbanization is propelling the market growth in this region. The Asia-Pacific dairy market also shows a growing interest in dairy blends as the demand for milk fat grows. Milk fat is a natural product and offers a better taste in contrast to other vegetable fats. Counties like India produces the largest amount of milk and milk fats in the region that further adds to the growth of dairy blends market.
- North America is the second region that dominates the dairy blends market. The market is characterized by huge competition owing to the presence of a number of small and large- scale firms in this region. Additionally, the presence of many food processing units creates huge demand for dairy blends as an active ingredient in processing food. Growing urbanization and lifestyle has boosted the market growth, as the working population tend to purchase products which cut down their cooking time and provide healthy and nutritious foods products. The Canada and U.s region has high demand for dairy blended products which further causes rapid rise in growth of dairy blends market.
- Europe region is anticipated to grow steadily in the forecast period. Despite numerous health and nutrition advantages of dairy blends, consumers in this region are unwilling to use them over traditional dairy products. In some developed as well as developing markets, food & beverage manufacturers prefer to use butter, margarine, and other conventional dairy products instead of dairy blends. But owing to the health benefits and growing demand for dairy proteins, this region is expected to witness growth in the upcoming years. Also, the changing lifestyle and trends can boost the market growth. Thus, there is a steady growth in the European region for dairy blends market in the forecasted years.
Top Key Players Covered In Dairy Blends Market
- Anchor (Auckland, New Zealand)
- Abbott Nutrition (US)
- Advanced Food Products (PA)
- Agri- Mark Inc. (US)
- Agropur Ingredients (US)
- All American Foods, Inc. (US)
- Friesland Campina (Netherlands)
- Cargill(US)
- Bakels Edible Oils (New Zealand)
- Lactopur (Canada)
- Pacificblends (Canada)
- Galloway Company (US)
- Dohler (Germany)
- Kerry Foods (Ireland)
- Fonterra Co-operative group (New Zealand) and other major players.
Key Industry Development In The Dairy Blends Market
- In July 2024, Frisian Flag Indonesia, a subsidiary of Friesland Campina, announced the opening of a new dairy facility in the West Java province of Indonesia. This factory would serve as the company’s primary hub in Southeast Asia and would enable the global expansion of its dairy business. The plant will operate at an annual production capacity of 700 million kilograms for dairy products, including milk blends.
- In May 2024, Fonterra Co-operative Group Ltd announced a step-change in its strategic direction, as it commits to deepening its position as a world-leading provider of high-value, innovative dairy ingredients. As part of this, the Co-op has announced it is exploring full or partial divestment options for some or all of its global Consumer business, as well as its integrated businesses Fonterra Oceania and Fonterra Sri Lanka. Chairman Peter McBride says this is a significant move for the Co-op which will set it up to grow long-term value for farmer shareholders and unit holders.
|
Dairy Blends Market |
|||
|
Base Year: |
2023 |
Forecast Period: |
2024-2032 |
|
Historical Data: |
2017 to 2023 |
Market Size in 2023: |
USD 2.48 Billion |
|
Forecast Period 2024-32 CAGR: |
7.3 % |
Market Size in 2032: |
USD 4.68 Billion |
|
Segments Covered: |
By Type |
|
|
|
By Application |
|
||
|
By Form |
|
||
|
By Region |
|
||
|
Key Market Drivers: |
|
||
|
Key Market Restraints: |
|
||
|
Key Opportunities: |
|
||
|
Companies Covered in the report: |
|
||
1.1 Scope and Coverage
Chapter 2:Executive Summary
Chapter 3: Market Landscape
3.1 Market Dynamics
3.1.1 Drivers
3.1.2 Restraints
3.1.3 Opportunities
3.1.4 Challenges
3.2 Market Trend Analysis
3.3 PESTLE Analysis
3.4 Porter's Five Forces Analysis
3.5 Industry Value Chain Analysis
3.6 Ecosystem
3.7 Regulatory Landscape
3.8 Price Trend Analysis
3.9 Patent Analysis
3.10 Technology Evolution
3.11 Investment Pockets
3.12 Import-Export Analysis
Chapter 4: Dairy Blends Market by Type (2018-2032)
4.1 Dairy Blends Market Snapshot and Growth Engine
4.2 Market Overview
4.3 Dairy Mixtures
4.3.1 Introduction and Market Overview
4.3.2 Historic and Forecasted Market Size in Value USD and Volume Units
4.3.3 Key Market Trends, Growth Factors, and Opportunities
4.3.4 Geographic Segmentation Analysis
4.4 Dairy/Non-dairy ingredients
4.5 Dairy as functional ingredient
4.6 Dairy as carrier
Chapter 5: Dairy Blends Market by Application (2018-2032)
5.1 Dairy Blends Market Snapshot and Growth Engine
5.2 Market Overview
5.3 Ice- cream
5.3.1 Introduction and Market Overview
5.3.2 Historic and Forecasted Market Size in Value USD and Volume Units
5.3.3 Key Market Trends, Growth Factors, and Opportunities
5.3.4 Geographic Segmentation Analysis
5.4 Yoghurt
5.5 Infant formula
5.6 Bakery
5.7 Feed
Chapter 6: Dairy Blends Market by Form (2018-2032)
6.1 Dairy Blends Market Snapshot and Growth Engine
6.2 Market Overview
6.3 Spreadable
6.3.1 Introduction and Market Overview
6.3.2 Historic and Forecasted Market Size in Value USD and Volume Units
6.3.3 Key Market Trends, Growth Factors, and Opportunities
6.3.4 Geographic Segmentation Analysis
6.4 Powder
6.5 Liquid
Chapter 7: Company Profiles and Competitive Analysis
7.1 Competitive Landscape
7.1.1 Competitive Benchmarking
7.1.2 Dairy Blends Market Share by Manufacturer (2024)
7.1.3 Industry BCG Matrix
7.1.4 Heat Map Analysis
7.1.5 Mergers and Acquisitions
7.2 ARCHER DANIELS MIDLAND COMPANY (US)
7.2.1 Company Overview
7.2.2 Key Executives
7.2.3 Company Snapshot
7.2.4 Role of the Company in the Market
7.2.5 Sustainability and Social Responsibility
7.2.6 Operating Business Segments
7.2.7 Product Portfolio
7.2.8 Business Performance
7.2.9 Key Strategic Moves and Recent Developments
7.2.10 SWOT Analysis
7.3 AJINOMOTO INC. (JAPAN)
7.4 ANGEL YEASTCO. LTD. (CHINA)
7.5 CARGILL INC (US)
7.6 CHR HANSEN (DENMARK)
7.7 CSK FOOD ENRICHMENT (NETHERLANDS)
7.8 DANONE S.A (FRANCE)
7.9 DOHLER GMBH (GERMANY)
7.10 GENERAL MILLS IN (US)
7.11 KERRY GROUP (IRELAND)
7.12 KEVIT (INDIA)
7.13 NESTLÉS.A (SWITZERLAND)
7.14 NOVOZYMES A/S (DENMARK)
7.15 ROYAL FRIESLANDCAMPINA N.V (NETHERLANDS)
7.16 TETRA PAK INTERNATIONAL S.A (SWITZERLAND)
7.17
Chapter 8: Global Dairy Blends Market By Region
8.1 Overview
8.2. North America Dairy Blends Market
8.2.1 Key Market Trends, Growth Factors and Opportunities
8.2.2 Top Key Companies
8.2.3 Historic and Forecasted Market Size by Segments
8.2.4 Historic and Forecasted Market Size by Type
8.2.4.1 Dairy Mixtures
8.2.4.2 Dairy/Non-dairy ingredients
8.2.4.3 Dairy as functional ingredient
8.2.4.4 Dairy as carrier
8.2.5 Historic and Forecasted Market Size by Application
8.2.5.1 Ice- cream
8.2.5.2 Yoghurt
8.2.5.3 Infant formula
8.2.5.4 Bakery
8.2.5.5 Feed
8.2.6 Historic and Forecasted Market Size by Form
8.2.6.1 Spreadable
8.2.6.2 Powder
8.2.6.3 Liquid
8.2.7 Historic and Forecast Market Size by Country
8.2.7.1 US
8.2.7.2 Canada
8.2.7.3 Mexico
8.3. Eastern Europe Dairy Blends Market
8.3.1 Key Market Trends, Growth Factors and Opportunities
8.3.2 Top Key Companies
8.3.3 Historic and Forecasted Market Size by Segments
8.3.4 Historic and Forecasted Market Size by Type
8.3.4.1 Dairy Mixtures
8.3.4.2 Dairy/Non-dairy ingredients
8.3.4.3 Dairy as functional ingredient
8.3.4.4 Dairy as carrier
8.3.5 Historic and Forecasted Market Size by Application
8.3.5.1 Ice- cream
8.3.5.2 Yoghurt
8.3.5.3 Infant formula
8.3.5.4 Bakery
8.3.5.5 Feed
8.3.6 Historic and Forecasted Market Size by Form
8.3.6.1 Spreadable
8.3.6.2 Powder
8.3.6.3 Liquid
8.3.7 Historic and Forecast Market Size by Country
8.3.7.1 Russia
8.3.7.2 Bulgaria
8.3.7.3 The Czech Republic
8.3.7.4 Hungary
8.3.7.5 Poland
8.3.7.6 Romania
8.3.7.7 Rest of Eastern Europe
8.4. Western Europe Dairy Blends Market
8.4.1 Key Market Trends, Growth Factors and Opportunities
8.4.2 Top Key Companies
8.4.3 Historic and Forecasted Market Size by Segments
8.4.4 Historic and Forecasted Market Size by Type
8.4.4.1 Dairy Mixtures
8.4.4.2 Dairy/Non-dairy ingredients
8.4.4.3 Dairy as functional ingredient
8.4.4.4 Dairy as carrier
8.4.5 Historic and Forecasted Market Size by Application
8.4.5.1 Ice- cream
8.4.5.2 Yoghurt
8.4.5.3 Infant formula
8.4.5.4 Bakery
8.4.5.5 Feed
8.4.6 Historic and Forecasted Market Size by Form
8.4.6.1 Spreadable
8.4.6.2 Powder
8.4.6.3 Liquid
8.4.7 Historic and Forecast Market Size by Country
8.4.7.1 Germany
8.4.7.2 UK
8.4.7.3 France
8.4.7.4 The Netherlands
8.4.7.5 Italy
8.4.7.6 Spain
8.4.7.7 Rest of Western Europe
8.5. Asia Pacific Dairy Blends Market
8.5.1 Key Market Trends, Growth Factors and Opportunities
8.5.2 Top Key Companies
8.5.3 Historic and Forecasted Market Size by Segments
8.5.4 Historic and Forecasted Market Size by Type
8.5.4.1 Dairy Mixtures
8.5.4.2 Dairy/Non-dairy ingredients
8.5.4.3 Dairy as functional ingredient
8.5.4.4 Dairy as carrier
8.5.5 Historic and Forecasted Market Size by Application
8.5.5.1 Ice- cream
8.5.5.2 Yoghurt
8.5.5.3 Infant formula
8.5.5.4 Bakery
8.5.5.5 Feed
8.5.6 Historic and Forecasted Market Size by Form
8.5.6.1 Spreadable
8.5.6.2 Powder
8.5.6.3 Liquid
8.5.7 Historic and Forecast Market Size by Country
8.5.7.1 China
8.5.7.2 India
8.5.7.3 Japan
8.5.7.4 South Korea
8.5.7.5 Malaysia
8.5.7.6 Thailand
8.5.7.7 Vietnam
8.5.7.8 The Philippines
8.5.7.9 Australia
8.5.7.10 New Zealand
8.5.7.11 Rest of APAC
8.6. Middle East & Africa Dairy Blends Market
8.6.1 Key Market Trends, Growth Factors and Opportunities
8.6.2 Top Key Companies
8.6.3 Historic and Forecasted Market Size by Segments
8.6.4 Historic and Forecasted Market Size by Type
8.6.4.1 Dairy Mixtures
8.6.4.2 Dairy/Non-dairy ingredients
8.6.4.3 Dairy as functional ingredient
8.6.4.4 Dairy as carrier
8.6.5 Historic and Forecasted Market Size by Application
8.6.5.1 Ice- cream
8.6.5.2 Yoghurt
8.6.5.3 Infant formula
8.6.5.4 Bakery
8.6.5.5 Feed
8.6.6 Historic and Forecasted Market Size by Form
8.6.6.1 Spreadable
8.6.6.2 Powder
8.6.6.3 Liquid
8.6.7 Historic and Forecast Market Size by Country
8.6.7.1 Turkiye
8.6.7.2 Bahrain
8.6.7.3 Kuwait
8.6.7.4 Saudi Arabia
8.6.7.5 Qatar
8.6.7.6 UAE
8.6.7.7 Israel
8.6.7.8 South Africa
8.7. South America Dairy Blends Market
8.7.1 Key Market Trends, Growth Factors and Opportunities
8.7.2 Top Key Companies
8.7.3 Historic and Forecasted Market Size by Segments
8.7.4 Historic and Forecasted Market Size by Type
8.7.4.1 Dairy Mixtures
8.7.4.2 Dairy/Non-dairy ingredients
8.7.4.3 Dairy as functional ingredient
8.7.4.4 Dairy as carrier
8.7.5 Historic and Forecasted Market Size by Application
8.7.5.1 Ice- cream
8.7.5.2 Yoghurt
8.7.5.3 Infant formula
8.7.5.4 Bakery
8.7.5.5 Feed
8.7.6 Historic and Forecasted Market Size by Form
8.7.6.1 Spreadable
8.7.6.2 Powder
8.7.6.3 Liquid
8.7.7 Historic and Forecast Market Size by Country
8.7.7.1 Brazil
8.7.7.2 Argentina
8.7.7.3 Rest of SA
Chapter 9 Analyst Viewpoint and Conclusion
9.1 Recommendations and Concluding Analysis
9.2 Potential Market Strategies
Chapter 10 Research Methodology
10.1 Research Process
10.2 Primary Research
10.3 Secondary Research
|
Dairy Blends Market |
|||
|
Base Year: |
2023 |
Forecast Period: |
2024-2032 |
|
Historical Data: |
2017 to 2023 |
Market Size in 2023: |
USD 2.48 Billion |
|
Forecast Period 2024-32 CAGR: |
7.3 % |
Market Size in 2032: |
USD 4.68 Billion |
|
Segments Covered: |
By Type |
|
|
|
By Application |
|
||
|
By Form |
|
||
|
By Region |
|
||
|
Key Market Drivers: |
|
||
|
Key Market Restraints: |
|
||
|
Key Opportunities: |
|
||
|
Companies Covered in the report: |
|
||
Frequently Asked Questions :
The forecast period in the Dairy Blends Market research report is 20234-2032.
Anchor (Auckland, New Zealand), Abbott Nutrition (US), Advanced Food Products (PA), Agri- Mark Inc. (US), Agropur Ingredients (US), All American Foods, Inc. (US), Friesland Campina (Netherlands), Cargill (US), Bakels Edible Oils (New Zealand), Lactopur (Canada), Pacificblends (Canada), Galloway Company (US), Dohler (Germany), Kerry Foods (Ireland), Fonterra Co-operative group (New Zealand), and other major players.
The Dairy Blends Market is segmented into type, application, form and region. By Type, the market is categorized into Dairy Mixtures, Dairy/Non-dairy ingredients, Dairy as functional ingredient, Dairy as carrier, others. By Application, the market is categorized into Ice cream, Yogurt, Infant formula, Bakery, Feed. By Form, the market is categorized into spreadable, powder, liquid. By region, it is analyzed across North America (U.S.; Canada; Mexico), Europe (Germany; U.K.; France; Italy; Russia; Spain, etc.), Asia-Pacific (China; India; Japan; Southeast Asia, etc.), South America (Brazil; Argentina, etc.), Middle East & Africa (Saudi Arabia; South Africa, etc.).
Dairy blends are dairy mixtures which are made from concentrated cream or butter and are mixed with vegetable oils. Dairy blends provide additional nutrition and an absolute taste enhancement to the products which drives the market growth.
Dairy Blends Market Was Valued at USD 2.48 Billion in 2023 and is Projected to Reach USD 4.68 Billion by 2032, Growing at a CAGR of 7.3% from 2024 to 2032.


