


Dairy Alternatives Market Synopsis
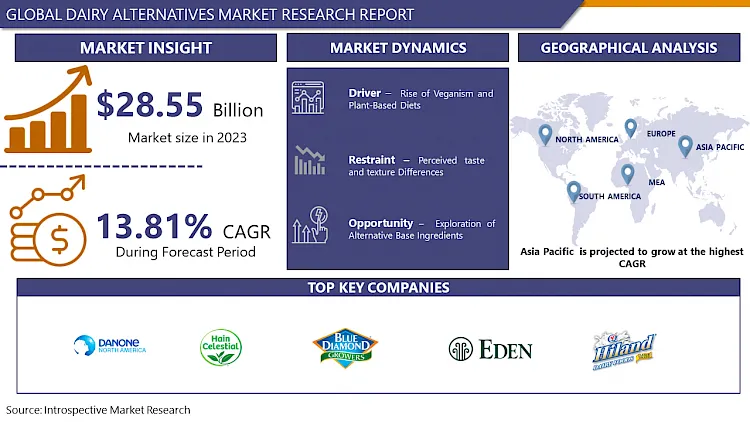
Dairy Alternatives Market Size Was Valued at USD 32.49 Billion in 2024, and is Projected to Reach USD 91.45 Billion by 2032, Growing at a CAGR of 13.81% From 2025-2032.
Dairy alternatives are plant-based products that mimic traditional dairy products like milk, cheese, and yogurt. Made from almonds, soybeans, oats, and coconuts, they cater to dietary restrictions like lactose intolerance and vegan lifestyles. These nutritious, sustainable alternatives offer a sustainable, environmentally friendly alternative to conventional dairy.
Dairy alternatives, also referred to as plant-based dairy substitutes, present numerous benefits, fueling their growing demand and versatile applications across the food industry. Firstly, these substitutes cater to individuals with dietary limitations such as lactose intolerance, dairy allergies, or those adhering to vegan or plant-based diets. Additionally, dairy alternatives typically boast lower calorie, cholesterol, and saturated fat content compared to traditional dairy products, appealing to health-conscious consumers. With options ranging from almond milk to soy yogurt and oat-based cheese, these alternatives offer flexibility for diverse culinary uses.
The surge in demand for dairy alternatives is driven by changing consumer preferences favoring healthier, more sustainable, and ethical food options. Increased awareness of animal welfare issues, environmental sustainability concerns, and the health advantages associated with plant-based eating has propelled the adoption of dairy alternatives globally.
These substitutes find application across various food and beverage segments, including beverages, snacks, desserts, and baked goods. They serve as ingredients in cooking, baking, and food preparation, providing functional attributes and taste profiles akin to conventional dairy items. Moreover, emerging trends in the dairy alternative realm encompass the development of innovative formulations, flavors, and packaging, alongside a heightened emphasis on organic, non-GMO, and sustainably sourced ingredients to meet evolving consumer demands for clean-label products and environmental stewardship.

Dairy Alternatives Market Trend Analysis
Rise of Veganism and Plant-Based Diets
- The surge in veganism and plant-based diets is a pivotal driving force propelling the dairy alternatives market forward. Veganism, which refrains from all animal products including dairy, and plant-based diets, prioritizing plant-derived foods, has garnered widespread traction in recent years.
- This trend is fueled by various factors, encompassing ethical concerns regarding animal welfare, environmental anxieties related to the ecological footprint of animal agriculture, and health considerations linked to plant-centric eating patterns. Consumers are increasingly adopting vegan and plant-based lifestyles to reduce their environmental impact, promote sustainable food systems, and enhance personal well-being.
- There is a burgeoning demand for dairy alternatives that offer plant-based substitutes to traditional dairy staples like milk, cheese, yogurt, and butter. This shift in consumer preferences is catalyzing innovation and product advancement within the dairy alternatives market, fostering a broader array of options, improved taste and texture, and greater accessibility of dairy-free alternatives on a global scale.
Exploration of Alternative Base Ingredients
- Exploring alternative base ingredients emerges as a promising opportunity within the dairy alternatives market. With increasing consumer demand for dairy-free options, there's a growing necessity for innovative plant-based elements to serve as the core of these alternatives. This trend allows for experimentation with diverse plant sources beyond conventional choices like soy, almond, and coconut.
- Ingredients such as oats, hemp, quinoa, cashews, peas, and rice offer distinctive nutritional profiles, flavors, and textures, enhancing the variety and appeal of dairy alternatives. Moreover, these alternatives cater to consumers with specific dietary preferences, allergies, or sensitivities, widening the market scope of dairy alternative products.
- Delving into alternative base ingredients aligns with consumer preferences for natural, minimally processed foods, as many plant sources are perceived as sustainable and wholesome. By leveraging the versatility and nutritional advantages of alternative base ingredients, businesses in the dairy alternatives sector can distinguish their offerings, address evolving consumer needs, and foster innovation in the realm of plant-based foods.
Dairy Alternatives Market Segment Analysis:
Dairy Alternatives Market Segmented on the basis of Type, Source, Application, Formulation, Distribution Channel and Region.
By Type, Plant-Based Milk Alternatives segment is expected to dominate the market during the forecast period
- The Plant-Based Milk Alternatives segment is poised to dominate the dairy alternatives market due to several pivotal factors. Firstly, these alternatives have garnered widespread consumer acceptance as individuals increasingly opt for dairy-free options driven by health, ethical, and environmental considerations. Offering a diverse range of choices including almond, soy, coconut, oat, and rice milk, these alternatives cater to a broad spectrum of dietary preferences and tastes.
- Moreover, their versatility is a key driver, as plant-based milk alternatives find application in various uses such as beverages, cooking, baking, and cereal consumption. This versatility extends their appeal across different consumer segments. The rising prevalence of lactose intolerance, dairy allergies, and vegan lifestyles further propels the demand for plant-based milk alternatives, providing a suitable alternative to traditional dairy milk without compromising on taste, texture, or nutritional value.
- Furthermore, ongoing advancements in processing techniques and product formulations have led to notable enhancements in the taste, texture, and nutritional profiles of plant-based milk alternatives, further boosting their attractiveness to consumers. Hence, it is anticipated that the Plant-Based Milk Alternatives segment will continue to maintain its dominant position in the dairy alternatives market moving forward.
By Source, Soy segment is expected to dominate the market during the forecast period
- The Soy segment is anticipated to lead the dairy alternatives market due to several key factors. Firstly, soy-based products have enjoyed early and extensive availability, establishing a robust presence in the market. This early introduction has fostered broad consumer acceptance and familiarity with soy-derived alternatives.
- Soy-based dairy alternatives offer a diverse array of products, including milk, cheese, yogurt, and ice cream, providing consumers with versatile options to substitute traditional dairy items. This flexibility appeals to individuals seeking alternatives for various dairy products in their diet.
- Additionally, soy is renowned for its nutritional value, serving as a rich source of protein, essential amino acids, vitamins, and minerals. As health-conscious consumers increasingly prioritize nutrient-dense foods, soy-based dairy alternatives emerge as a viable and wholesome choice. Soy's widespread cultivation and relatively economical production compared to some other plant-based options ensure accessibility to soy-based dairy alternatives across diverse socio-economic demographics.
Dairy Alternatives Market Regional Insights:
Asia Pacific is Expected to Dominate the Market Over the Forecast period
- Asia Pacific is poised to dominate the dairy alternatives market due to several significant factors. Firstly, the region's rapid urbanization and economic growth have led to a burgeoning middle class with increased disposable incomes. This demographic shift fuels the demand for healthier and more sustainable food options, including dairy alternatives.
- Changing dietary preferences and heightened awareness of health and environmental issues are driving the adoption of plant-based diets and dairy-free alternatives across the Asia Pacific. Consumers in the region are increasingly seeking out dairy alternatives as substitutes for traditional dairy products. Asia Pacific boasts some of the world's largest populations, such as China and India, where lactose intolerance and dairy allergies are prevalent. This demographic factor significantly contributes to the demand for dairy alternatives in the region.
- The presence of key industry players and investments in product innovation and marketing further propel market growth in Asia Pacific. Consequently, Asia Pacific is anticipated to emerge as the dominant force in the global dairy alternatives market in the foreseeable future.
Dairy Alternatives Market Top Key Players:
- Danone North America Public Benefit Corporation (US)
- The Hain Celestial Group, Inc. (US)
- Blue Diamond Growers (US)
- Eden Foods, Inc. (US)
- Hiland Dairy (US)
- Ripple Foods (US)
- Kite Hill (US)
- Califia Farms, LLC (US)
- Rude Health (US)
- Miyoko’s Creamery (US)
- PANOS Brand (US)
- Earth’s Own Food Company Inc. (Canada)
- Daiya Foods Inc. (Canada)
- SunOpta (Canada)
- Elmhurst Milked Direct LLC (New York)
- Valsoia S.p.A (Italy)
- Nutriops, S.L. (Spain)
- Qatly Group AB (Sweden)
- Triballat Noyal (France)
- One Good (India)
- Freedom Foods Group Limited (Australia)
- PureHarvest (Australia)
- Sanitarium (New Zealand)
- Green Spot Co., Ltd. (Thailand)
- Other Active Players.
Key Industry Developments in the Dairy Alternatives Market:
- In March 2024, Kerry Dairy Consumer Foods launched its "category-first" Smug Dairy range, blending oats and dairy, in response to health, environmental, and ethical concerns cited by one in four UK shoppers according to YouGov and ComRes data. The range, featuring three 'cheddar' alternatives, two butter-style products, and milk, debuted gradually across Tesco, Sainsbury’s, Morrisons, and The Co-op, with Tesco and Morrisons stocking the full range by May. The move aimed to introduce innovation to the dairy category, challenging traditional perceptions of dairy and non-dairy markets.
- In October 2023, Little Freddie introduced its dairy-free yogurt alternatives to the baby food category. The organic brand unveiled two flavors, Banana & Raspberry and Strawberry, priced at £1.50/90g. Packaged in recyclable pouches, the range utilized a Sri Lankan coconut yogurt base, addressing the need for a calcium source in the baby food aisle. Little Freddie aimed to cater to parents with cow’s milk protein-allergic babies and those opting for plant-based weaning.
|
Global Dairy Alternatives Market |
|||
|
Base Year: |
2024 |
Forecast Period: |
2025-2032 |
|
Historical Data: |
2018 to 2023 |
Market Size in 2024: |
USD 32.49 Bn. |
|
Forecast Period 2025-32 CAGR: |
13.81% |
Market Size in 2032: |
USD 91.45 Bn. |
|
Segments Covered: |
By Type |
|
|
|
By Source |
|
||
|
By Application |
|
||
|
By Formulation |
|
||
|
By Distribution Channel |
|
||
|
By Region |
|
||
|
Key Market Drivers: |
|
||
|
Key Market Restraints: |
|
||
|
Key Opportunities: |
|
||
|
Companies Covered in the Report: |
|
||
Chapter 1: Introduction
1.1 Scope and Coverage
Chapter 2:Executive Summary
Chapter 3: Market Landscape
3.1 Market Dynamics
3.1.1 Drivers
3.1.2 Restraints
3.1.3 Opportunities
3.1.4 Challenges
3.2 Market Trend Analysis
3.3 PESTLE Analysis
3.4 Porter's Five Forces Analysis
3.5 Industry Value Chain Analysis
3.6 Ecosystem
3.7 Regulatory Landscape
3.8 Price Trend Analysis
3.9 Patent Analysis
3.10 Technology Evolution
3.11 Investment Pockets
3.12 Import-Export Analysis
Chapter 4: Dairy Alternatives Market by Type (2018-2032)
4.1 Dairy Alternatives Market Snapshot and Growth Engine
4.2 Market Overview
4.3 Plant-Based Milk Alternatives
4.3.1 Introduction and Market Overview
4.3.2 Historic and Forecasted Market Size in Value USD and Volume Units
4.3.3 Key Market Trends, Growth Factors, and Opportunities
4.3.4 Geographic Segmentation Analysis
4.4 Cheese Alternatives
4.5 Yogurt Alternatives
4.6 Butter Alternatives
4.7 Cream Alternatives
Chapter 5: Dairy Alternatives Market by Source (2018-2032)
5.1 Dairy Alternatives Market Snapshot and Growth Engine
5.2 Market Overview
5.3 Soy
5.3.1 Introduction and Market Overview
5.3.2 Historic and Forecasted Market Size in Value USD and Volume Units
5.3.3 Key Market Trends, Growth Factors, and Opportunities
5.3.4 Geographic Segmentation Analysis
5.4 Almond
5.5 Coconut
5.6 Oat
5.7 Rice
5.8 Others
Chapter 6: Dairy Alternatives Market by Application (2018-2032)
6.1 Dairy Alternatives Market Snapshot and Growth Engine
6.2 Market Overview
6.3 Beverages
6.3.1 Introduction and Market Overview
6.3.2 Historic and Forecasted Market Size in Value USD and Volume Units
6.3.3 Key Market Trends, Growth Factors, and Opportunities
6.3.4 Geographic Segmentation Analysis
6.4 Food Products
Chapter 7: Dairy Alternatives Market by Formulation (2018-2032)
7.1 Dairy Alternatives Market Snapshot and Growth Engine
7.2 Market Overview
7.3 Original/Plain
7.3.1 Introduction and Market Overview
7.3.2 Historic and Forecasted Market Size in Value USD and Volume Units
7.3.3 Key Market Trends, Growth Factors, and Opportunities
7.3.4 Geographic Segmentation Analysis
7.4 Flavored
7.5 Sweetened
7.6 Unsweetened
Chapter 8: Dairy Alternatives Market by Distribution Channel (2018-2032)
8.1 Dairy Alternatives Market Snapshot and Growth Engine
8.2 Market Overview
8.3 Supermarkets/Hypermarkets
8.3.1 Introduction and Market Overview
8.3.2 Historic and Forecasted Market Size in Value USD and Volume Units
8.3.3 Key Market Trends, Growth Factors, and Opportunities
8.3.4 Geographic Segmentation Analysis
8.4 Convenience Stores
8.5 Specialty Stores
8.6 Online Retailers
8.7 Foodservice
Chapter 9: Company Profiles and Competitive Analysis
9.1 Competitive Landscape
9.1.1 Competitive Benchmarking
9.1.2 Dairy Alternatives Market Share by Manufacturer (2024)
9.1.3 Industry BCG Matrix
9.1.4 Heat Map Analysis
9.1.5 Mergers and Acquisitions
9.2 A&B INGREDIENTS (CANADA)
9.2.1 Company Overview
9.2.2 Key Executives
9.2.3 Company Snapshot
9.2.4 Role of the Company in the Market
9.2.5 Sustainability and Social Responsibility
9.2.6 Operating Business Segments
9.2.7 Product Portfolio
9.2.8 Business Performance
9.2.9 Key Strategic Moves and Recent Developments
9.2.10 SWOT Analysis
9.3 CARGILL INCORPORATED (US)
9.4 DOWDUPONTINC. (US)
9.5 ARCHER DANIELS MIDLAND COMPANY (US)
9.6 KERRY GROUP (IRELAND)
9.7 INGREDION INCORPORATED (US)
9.8 AMY'S KITCHENINC. (US)
9.9 ROQUETTE FRÈRES (FRANCE)
9.10 PURIS (US)
9.11 THE NISSHIN OILLIO GROUP LTD (JAPAN)
9.12 AXIOM FOODS (US)
9.13 BENEO (GERMANY)
9.14 MGP INGREDIENTS INC. (US)
9.15 THE TOP HEALTH INGREDIENTS (CANADA)
9.16 SONIC BIOCHEM LTD (INDIA)
9.17 VBITES FOODS LIMITED (UK)
9.18 CRESPEL & DEITERS (GERMANY)
9.19 QUORN FOODS (UK)
9.20 WILMAR INTERNATIONAL LIMITED (SINGAPORE)
9.21 SOTEXPRO S.A (FRANCE)
9.22 BATORY FOODS (US)
9.23 MORNINGSTAR FARMS L.C. (US)
9.24 ALL ORGANIC TREASURES GMBH (GERMANY)
9.25 THE GREEN LABS LLC (US)
9.26 SHANDONG JIANYUAN GROUP (CHINA)
9.27 ET CHEM (CHINA)
9.28 BEYOND MEAT (US)
9.29 GARDEIN
9.30 MEATLESS (CANADA)AND OTHERS MAJOR KEY PLAYERS.
Chapter 10: Global Dairy Alternatives Market By Region
10.1 Overview
10.2. North America Dairy Alternatives Market
10.2.1 Key Market Trends, Growth Factors and Opportunities
10.2.2 Top Key Companies
10.2.3 Historic and Forecasted Market Size by Segments
10.2.4 Historic and Forecasted Market Size by Type
10.2.4.1 Plant-Based Milk Alternatives
10.2.4.2 Cheese Alternatives
10.2.4.3 Yogurt Alternatives
10.2.4.4 Butter Alternatives
10.2.4.5 Cream Alternatives
10.2.5 Historic and Forecasted Market Size by Source
10.2.5.1 Soy
10.2.5.2 Almond
10.2.5.3 Coconut
10.2.5.4 Oat
10.2.5.5 Rice
10.2.5.6 Others
10.2.6 Historic and Forecasted Market Size by Application
10.2.6.1 Beverages
10.2.6.2 Food Products
10.2.7 Historic and Forecasted Market Size by Formulation
10.2.7.1 Original/Plain
10.2.7.2 Flavored
10.2.7.3 Sweetened
10.2.7.4 Unsweetened
10.2.8 Historic and Forecasted Market Size by Distribution Channel
10.2.8.1 Supermarkets/Hypermarkets
10.2.8.2 Convenience Stores
10.2.8.3 Specialty Stores
10.2.8.4 Online Retailers
10.2.8.5 Foodservice
10.2.9 Historic and Forecast Market Size by Country
10.2.9.1 US
10.2.9.2 Canada
10.2.9.3 Mexico
10.3. Eastern Europe Dairy Alternatives Market
10.3.1 Key Market Trends, Growth Factors and Opportunities
10.3.2 Top Key Companies
10.3.3 Historic and Forecasted Market Size by Segments
10.3.4 Historic and Forecasted Market Size by Type
10.3.4.1 Plant-Based Milk Alternatives
10.3.4.2 Cheese Alternatives
10.3.4.3 Yogurt Alternatives
10.3.4.4 Butter Alternatives
10.3.4.5 Cream Alternatives
10.3.5 Historic and Forecasted Market Size by Source
10.3.5.1 Soy
10.3.5.2 Almond
10.3.5.3 Coconut
10.3.5.4 Oat
10.3.5.5 Rice
10.3.5.6 Others
10.3.6 Historic and Forecasted Market Size by Application
10.3.6.1 Beverages
10.3.6.2 Food Products
10.3.7 Historic and Forecasted Market Size by Formulation
10.3.7.1 Original/Plain
10.3.7.2 Flavored
10.3.7.3 Sweetened
10.3.7.4 Unsweetened
10.3.8 Historic and Forecasted Market Size by Distribution Channel
10.3.8.1 Supermarkets/Hypermarkets
10.3.8.2 Convenience Stores
10.3.8.3 Specialty Stores
10.3.8.4 Online Retailers
10.3.8.5 Foodservice
10.3.9 Historic and Forecast Market Size by Country
10.3.9.1 Russia
10.3.9.2 Bulgaria
10.3.9.3 The Czech Republic
10.3.9.4 Hungary
10.3.9.5 Poland
10.3.9.6 Romania
10.3.9.7 Rest of Eastern Europe
10.4. Western Europe Dairy Alternatives Market
10.4.1 Key Market Trends, Growth Factors and Opportunities
10.4.2 Top Key Companies
10.4.3 Historic and Forecasted Market Size by Segments
10.4.4 Historic and Forecasted Market Size by Type
10.4.4.1 Plant-Based Milk Alternatives
10.4.4.2 Cheese Alternatives
10.4.4.3 Yogurt Alternatives
10.4.4.4 Butter Alternatives
10.4.4.5 Cream Alternatives
10.4.5 Historic and Forecasted Market Size by Source
10.4.5.1 Soy
10.4.5.2 Almond
10.4.5.3 Coconut
10.4.5.4 Oat
10.4.5.5 Rice
10.4.5.6 Others
10.4.6 Historic and Forecasted Market Size by Application
10.4.6.1 Beverages
10.4.6.2 Food Products
10.4.7 Historic and Forecasted Market Size by Formulation
10.4.7.1 Original/Plain
10.4.7.2 Flavored
10.4.7.3 Sweetened
10.4.7.4 Unsweetened
10.4.8 Historic and Forecasted Market Size by Distribution Channel
10.4.8.1 Supermarkets/Hypermarkets
10.4.8.2 Convenience Stores
10.4.8.3 Specialty Stores
10.4.8.4 Online Retailers
10.4.8.5 Foodservice
10.4.9 Historic and Forecast Market Size by Country
10.4.9.1 Germany
10.4.9.2 UK
10.4.9.3 France
10.4.9.4 The Netherlands
10.4.9.5 Italy
10.4.9.6 Spain
10.4.9.7 Rest of Western Europe
10.5. Asia Pacific Dairy Alternatives Market
10.5.1 Key Market Trends, Growth Factors and Opportunities
10.5.2 Top Key Companies
10.5.3 Historic and Forecasted Market Size by Segments
10.5.4 Historic and Forecasted Market Size by Type
10.5.4.1 Plant-Based Milk Alternatives
10.5.4.2 Cheese Alternatives
10.5.4.3 Yogurt Alternatives
10.5.4.4 Butter Alternatives
10.5.4.5 Cream Alternatives
10.5.5 Historic and Forecasted Market Size by Source
10.5.5.1 Soy
10.5.5.2 Almond
10.5.5.3 Coconut
10.5.5.4 Oat
10.5.5.5 Rice
10.5.5.6 Others
10.5.6 Historic and Forecasted Market Size by Application
10.5.6.1 Beverages
10.5.6.2 Food Products
10.5.7 Historic and Forecasted Market Size by Formulation
10.5.7.1 Original/Plain
10.5.7.2 Flavored
10.5.7.3 Sweetened
10.5.7.4 Unsweetened
10.5.8 Historic and Forecasted Market Size by Distribution Channel
10.5.8.1 Supermarkets/Hypermarkets
10.5.8.2 Convenience Stores
10.5.8.3 Specialty Stores
10.5.8.4 Online Retailers
10.5.8.5 Foodservice
10.5.9 Historic and Forecast Market Size by Country
10.5.9.1 China
10.5.9.2 India
10.5.9.3 Japan
10.5.9.4 South Korea
10.5.9.5 Malaysia
10.5.9.6 Thailand
10.5.9.7 Vietnam
10.5.9.8 The Philippines
10.5.9.9 Australia
10.5.9.10 New Zealand
10.5.9.11 Rest of APAC
10.6. Middle East & Africa Dairy Alternatives Market
10.6.1 Key Market Trends, Growth Factors and Opportunities
10.6.2 Top Key Companies
10.6.3 Historic and Forecasted Market Size by Segments
10.6.4 Historic and Forecasted Market Size by Type
10.6.4.1 Plant-Based Milk Alternatives
10.6.4.2 Cheese Alternatives
10.6.4.3 Yogurt Alternatives
10.6.4.4 Butter Alternatives
10.6.4.5 Cream Alternatives
10.6.5 Historic and Forecasted Market Size by Source
10.6.5.1 Soy
10.6.5.2 Almond
10.6.5.3 Coconut
10.6.5.4 Oat
10.6.5.5 Rice
10.6.5.6 Others
10.6.6 Historic and Forecasted Market Size by Application
10.6.6.1 Beverages
10.6.6.2 Food Products
10.6.7 Historic and Forecasted Market Size by Formulation
10.6.7.1 Original/Plain
10.6.7.2 Flavored
10.6.7.3 Sweetened
10.6.7.4 Unsweetened
10.6.8 Historic and Forecasted Market Size by Distribution Channel
10.6.8.1 Supermarkets/Hypermarkets
10.6.8.2 Convenience Stores
10.6.8.3 Specialty Stores
10.6.8.4 Online Retailers
10.6.8.5 Foodservice
10.6.9 Historic and Forecast Market Size by Country
10.6.9.1 Turkiye
10.6.9.2 Bahrain
10.6.9.3 Kuwait
10.6.9.4 Saudi Arabia
10.6.9.5 Qatar
10.6.9.6 UAE
10.6.9.7 Israel
10.6.9.8 South Africa
10.7. South America Dairy Alternatives Market
10.7.1 Key Market Trends, Growth Factors and Opportunities
10.7.2 Top Key Companies
10.7.3 Historic and Forecasted Market Size by Segments
10.7.4 Historic and Forecasted Market Size by Type
10.7.4.1 Plant-Based Milk Alternatives
10.7.4.2 Cheese Alternatives
10.7.4.3 Yogurt Alternatives
10.7.4.4 Butter Alternatives
10.7.4.5 Cream Alternatives
10.7.5 Historic and Forecasted Market Size by Source
10.7.5.1 Soy
10.7.5.2 Almond
10.7.5.3 Coconut
10.7.5.4 Oat
10.7.5.5 Rice
10.7.5.6 Others
10.7.6 Historic and Forecasted Market Size by Application
10.7.6.1 Beverages
10.7.6.2 Food Products
10.7.7 Historic and Forecasted Market Size by Formulation
10.7.7.1 Original/Plain
10.7.7.2 Flavored
10.7.7.3 Sweetened
10.7.7.4 Unsweetened
10.7.8 Historic and Forecasted Market Size by Distribution Channel
10.7.8.1 Supermarkets/Hypermarkets
10.7.8.2 Convenience Stores
10.7.8.3 Specialty Stores
10.7.8.4 Online Retailers
10.7.8.5 Foodservice
10.7.9 Historic and Forecast Market Size by Country
10.7.9.1 Brazil
10.7.9.2 Argentina
10.7.9.3 Rest of SA
Chapter 11 Analyst Viewpoint and Conclusion
11.1 Recommendations and Concluding Analysis
11.2 Potential Market Strategies
Chapter 12 Research Methodology
12.1 Research Process
12.2 Primary Research
12.3 Secondary Research
|
Global Dairy Alternatives Market |
|||
|
Base Year: |
2024 |
Forecast Period: |
2025-2032 |
|
Historical Data: |
2018 to 2023 |
Market Size in 2024: |
USD 32.49 Bn. |
|
Forecast Period 2025-32 CAGR: |
13.81% |
Market Size in 2032: |
USD 91.45 Bn. |
|
Segments Covered: |
By Type |
|
|
|
By Source |
|
||
|
By Application |
|
||
|
By Formulation |
|
||
|
By Distribution Channel |
|
||
|
By Region |
|
||
|
Key Market Drivers: |
|
||
|
Key Market Restraints: |
|
||
|
Key Opportunities: |
|
||
|
Companies Covered in the Report: |
|
||


