


Customer Experience as a Service (CXaaS) Market Synopsis
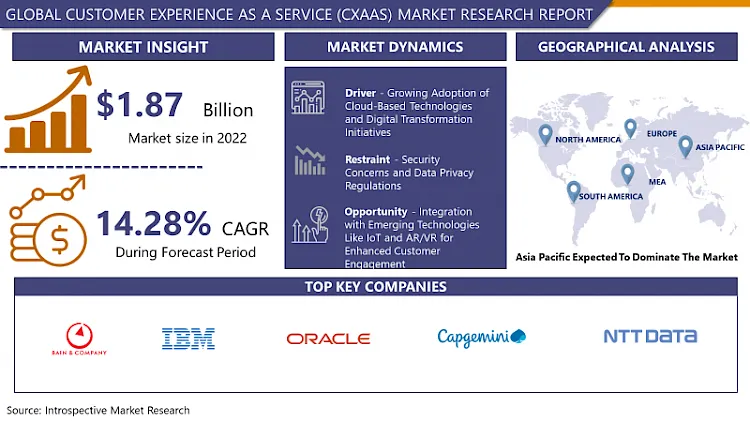
Global Customer Experience as a Service (CXaaS) Market Size Was Valued at USD 2.44 Billion in 2024, and is Projected to Reach USD 7.1 Billion by 2032, Growing at a CAGR of 14.28% From 2025-2032.
The Customer Experience as a Service (CXaaS), businesses provide outstanding customer experiences through outsourced solutions. This approach utilizes technology and specialized knowledge to enhance interactions across various touchpoints, ultimately boosting customer satisfaction and loyalty. CXaaS providers deliver customized strategies, analytics, and assistance to aid organizations in enhancing customer engagement and fostering business expansion.
Across various sectors, Customer Experience as a Service (CXaaS) enhances customer interactions and satisfaction, streamlining service processes, tailoring interactions, and providing seamless omnichannel experiences. From retail and e-commerce to telecommunications and finance, CXaaS aids in fostering stronger customer relationships, leading to enhanced loyalty and retention.
One key advantage of CXaaS is its scalability and adaptability, allowing businesses to respond to changing customer needs and market trends. Outsourcing customer experience management grants access to specialized expertise and resources without requiring costly infrastructure or technology upgrades. Additionally, CXaaS offers real-time analytics, empowering organizations to make informed, data-driven decisions and continually refine the customer journey.
Future demand for CXaaS is set to surge as companies prioritize customer-centric strategies and embrace digital transformation. With the proliferation of e-commerce and digital interactions, delivering personalized experiences across all touchpoints is increasingly crucial. Moreover, amid heightened competition, businesses recognize the importance of investing in customer experience to differentiate themselves and achieve business success. As a result, the CXaaS market is poised for rapid expansion, driven by innovative technologies and solutions that drive continuous evolution and enhancement of customer engagement strategies.
.webp)
Customer Experience as a Service (CXaaS) Market Trend Analysis:
Growing Adoption of Cloud-Based Technologies and Digital Transformation Initiatives
- The rapid expansion of the Customer Experience as a Service (CXaaS) market is propelled by the increasing adoption of cloud-based technologies and digital transformation initiatives. Businesses are progressively transitioning to cloud-based solutions to modernize their operations and elevate customer interactions. Cloud-based CXaaS platforms provide scalability, flexibility, and accessibility, empowering enterprises to deliver seamless experiences across various channels while mitigating infrastructure costs and complexities.
- Moreover, as companies embark on digital transformation endeavors, they acknowledge the pivotal role of customer experience in driving organizational success. CXaaS solutions seamlessly align with digital transformation strategies, furnishing the requisite technological infrastructure and tools to deliver personalized, data-driven experiences. Leveraging CXaaS platforms enables businesses to delve deeper into customer behavior, preferences, and sentiment, enabling them to tailor interactions and offerings adeptly to meet evolving demands.
- Furthermore, prompting businesses to prioritize remote operations and online engagement channels. Consequently, there is a surge in demand for CXaaS as enterprises strive to adapt to the evolving landscape and fulfill the evolving expectations of digitally savvy consumers. With cloud-based technologies spearheading this transformation, the CXaaS market is primed for sustained expansion, propelled by the continual evolution of digital strategies and the relentless pursuit of enriched customer experiences.
Integration with Emerging Technologies Like IoT and AR/VR for Enhanced Customer Engagement
- Integrating Customer Experience as a Service (CXaaS) with emerging technologies like the Internet of Things (IoT) and Augmented Reality/Virtual Reality (AR/VR) presents a significant growth opportunity for the market. By integrating IoT devices into CXaaS platforms, businesses can access real-time data from interconnected devices, gaining deeper insights into customer behavior and preferences. This data-driven approach facilitates personalized and contextualized interactions, thereby enhancing overall customer engagement and satisfaction levels.
- Furthermore, leveraging AR/VR technologies within CXaaS solutions allows businesses to provide immersive and interactive experiences to their customers. These technologies find applications across various industries, including retail, entertainment, and tourism, enabling virtual product demonstrations, immersive shopping experiences, and virtual tours. Integration of AR/VR into CXaaS platforms enables businesses to create memorable and captivating experiences, setting them apart from competitors and fostering customer loyalty.
- Moreover, the adoption of IoT and AR/VR for customer engagement creates new revenue streams and business opportunities for CXaaS providers. As businesses increasingly prioritize delivering immersive and personalized experiences, the demand for CXaaS solutions integrated with these technologies is expected to grow. This presents CXaaS providers with the chance to innovate and develop advanced solutions that harness IoT and AR/VR to deliver exceptional customer experiences, positioning themselves for sustained growth and success in the competitive market landscape.
Customer Experience as a Service (CXaaS) Market Segment Analysis:
Customer Experience as a Service (CXaaS) Market Segmented on the basis of Service Type, Enterprise Size, and Distribution Channel
By Service Type, Cross Channel Marketing segment is expected to dominate the market during the forecast period
- Expectedly, the Cross-Channel Marketing segment will lead the expansion of the Customer Experience as a Service (CXaaS) Market. This segment concentrates on delivering consistent and personalized messages across various platforms, such as email, social media, websites, and mobile applications. Through the integration of data from diverse touchpoints, enterprises can craft coherent and smooth customer experiences, thereby fostering engagement and loyalty.
- Furthermore, Cross Channel Marketing empowers enterprises to connect with customers at different phases of the purchasing journey and customize communications based on individual preferences and behaviors. Given the growing significance of omnichannel marketing strategies, businesses prioritize solutions that facilitate unified and coordinated customer interactions. the Cross-Channel Marketing segment is poised to dominate the CXaaS market, providing comprehensive solutions that optimize customer engagement and propel business expansion.
By Enterprise Size, Large Enterprise held the largest share in 2024
- Large enterprises have been pivotal in propelling the expansion of the Customer Experience as a Service (CXaaS) Market. With their extensive customer bases and intricate operations, these corporations are ideally positioned to benefit from CXaaS solutions. Prioritizing the enhancement of customer experiences to sustain competitiveness and foster loyalty, large enterprises invest in CXaaS platforms to streamline interactions, personalize communications, and ensure seamless omnichannel experiences.
- Furthermore, large enterprises possess the necessary resources and infrastructure to effectively implement and scale CXaaS solutions. Often equipped with dedicated teams or departments specializing in customer experience management, they facilitate the seamless integration of CXaaS technologies into their existing systems and processes. Given the escalating importance of delivering outstanding customer experiences in today's cutthroat business environment, large enterprises continue to fuel the demand for CXaaS solutions, playing a significant role in driving the market's growth and expansion.
Customer Experience as a Service (CXaaS) Market Regional Insights:
Asia Pacific is Expected to Dominate the Market Over the Forecast period
- Asia Pacific is positioned to lead the expansion of the Customer Experience as a Service (CXaaS) market. The region's rapid economic growth, burgeoning population, and increasing digitalization present extensive opportunities for CXaaS adoption. Businesses across Asia Pacific are increasingly focusing on customer-centric strategies to maintain competitiveness in the ever-evolving market landscape.
- Asia Pacific boasts a thriving technology sector and a growing base of digitally savvy consumers, which drives the demand for CXaaS solutions. With the surge in e-commerce and mobile commerce platforms, there's a growing emphasis on delivering exceptional customer experiences across various touchpoints. Additionally, governments in countries like China, India, and Southeast Asian nations are actively promoting digital initiatives and investing in infrastructure, further stimulating the growth of the CXaaS market in the region. Asia Pacific is poised to dominate the CXaaS market, presenting significant growth opportunities for both businesses and CXaaS providers.
Customer Experience as a Service (CXaaS) Market Top Key Players:
- Bain & Company, Inc. (U.S.)
- Zendesk, Inc. (U.S.)
- IBM Corporation (U.S.)
- TTEC Holdings, Inc. (U.S.)
- Oracle Corporation (U.S.)
- Mastech Infotrellis, Inc. (U.S.)
- Verint Systems (U.S.)
- Sutherland (U.S.)
- Adobe Inc. (U.S.)
- Avaya (U.S.)
- OpenText Corporation (Canada)
- Capgemini SE (France)
- NTT DATA, Inc. (Japan)
- Hexaware Technologies Limited (India), and Other Active Players
Key Industry Developments in the Customer Experience as a Service (CXaaS) Market:
- In January 2023, The leading provider of AI-powered experience orchestration on the global cloud, Genesys®, announced that it has reached an agreement to acquire Radarr Technologies, a pioneer in AI-powered social and digital listening, analytics, and customer engagement.Genesys will enable businesses to unify the customer experience (CX) like never before by combining the extensive public social media capabilities of Radarr Technologies with the all-in-one Genesys CloudTM platform. This will enable businesses to create proactive, prescriptive engagement designed to foster loyalty in the AI economy.
|
Customer Experience as a Service (CXaaS) Market |
|||
|
Base Year: |
2024 |
Forecast Period: |
2025-2032 |
|
Historical Data: |
2018 to 2024 |
Market Size in 2024: |
USD 2.44 Bn. |
|
Forecast Period 2023-30 CAGR: |
14.28% |
Market Size in 2030: |
USD 7.1 Bn. |
|
Segments Covered: |
By Service Type |
|
|
|
By Enterprise Size |
|
||
|
By Industry |
|
||
|
By Region |
|
||
|
Key Market Drivers: |
|
||
|
Key Market Restraints: |
|
||
|
Key Opportunities: |
|
||
|
Companies Covered in the report: |
|
||
Chapter 1: Introduction
1.1 Scope and Coverage
Chapter 2:Executive Summary
Chapter 3: Market Landscape
3.1 Market Dynamics
3.1.1 Drivers
3.1.2 Restraints
3.1.3 Opportunities
3.1.4 Challenges
3.2 Market Trend Analysis
3.3 PESTLE Analysis
3.4 Porter's Five Forces Analysis
3.5 Industry Value Chain Analysis
3.6 Ecosystem
3.7 Regulatory Landscape
3.8 Price Trend Analysis
3.9 Patent Analysis
3.10 Technology Evolution
3.11 Investment Pockets
3.12 Import-Export Analysis
Chapter 4: Customer Experience as a Service (CXaaS) Market by Service Type (2018-2032)
4.1 Customer Experience as a Service (CXaaS) Market Snapshot and Growth Engine
4.2 Market Overview
4.3 Campaign Development
4.3.1 Introduction and Market Overview
4.3.2 Historic and Forecasted Market Size in Value USD and Volume Units
4.3.3 Key Market Trends, Growth Factors, and Opportunities
4.3.4 Geographic Segmentation Analysis
4.4 Cross Channel Marketing
4.5 Omni Channel Engagement
Chapter 5: Customer Experience as a Service (CXaaS) Market by Enterprise Size (2018-2032)
5.1 Customer Experience as a Service (CXaaS) Market Snapshot and Growth Engine
5.2 Market Overview
5.3 Small and Medium Enterprise
5.3.1 Introduction and Market Overview
5.3.2 Historic and Forecasted Market Size in Value USD and Volume Units
5.3.3 Key Market Trends, Growth Factors, and Opportunities
5.3.4 Geographic Segmentation Analysis
5.4 Large Enterprise
Chapter 6: Customer Experience as a Service (CXaaS) Market by Industry (2018-2032)
6.1 Customer Experience as a Service (CXaaS) Market Snapshot and Growth Engine
6.2 Market Overview
6.3 BFSI
6.3.1 Introduction and Market Overview
6.3.2 Historic and Forecasted Market Size in Value USD and Volume Units
6.3.3 Key Market Trends, Growth Factors, and Opportunities
6.3.4 Geographic Segmentation Analysis
6.4 Healthcare & Life Sciences
6.5 IT and Telecom
6.6 Government
6.7 Retail & Consumer Packaged Goods
6.8 Manufacturing
Chapter 7: Company Profiles and Competitive Analysis
7.1 Competitive Landscape
7.1.1 Competitive Benchmarking
7.1.2 Customer Experience as a Service (CXaaS) Market Share by Manufacturer (2024)
7.1.3 Industry BCG Matrix
7.1.4 Heat Map Analysis
7.1.5 Mergers and Acquisitions
7.2 DELL TECHNOLOGIES INCASUSTEK COMPUTER INCSAMSUNG GROUP
7.2.1 Company Overview
7.2.2 Key Executives
7.2.3 Company Snapshot
7.2.4 Role of the Company in the Market
7.2.5 Sustainability and Social Responsibility
7.2.6 Operating Business Segments
7.2.7 Product Portfolio
7.2.8 Business Performance
7.2.9 Key Strategic Moves and Recent Developments
7.2.10 SWOT Analysis
7.3 APPLE INCTPV TECHNOLOGY LIMITED
7.4 HP INCLG ELECTRONICS INCACER INCQASIDA CORPORATION
Chapter 8: Global Customer Experience as a Service (CXaaS) Market By Region
8.1 Overview
8.2. North America Customer Experience as a Service (CXaaS) Market
8.2.1 Key Market Trends, Growth Factors and Opportunities
8.2.2 Top Key Companies
8.2.3 Historic and Forecasted Market Size by Segments
8.2.4 Historic and Forecasted Market Size by Service Type
8.2.4.1 Campaign Development
8.2.4.2 Cross Channel Marketing
8.2.4.3 Omni Channel Engagement
8.2.5 Historic and Forecasted Market Size by Enterprise Size
8.2.5.1 Small and Medium Enterprise
8.2.5.2 Large Enterprise
8.2.6 Historic and Forecasted Market Size by Industry
8.2.6.1 BFSI
8.2.6.2 Healthcare & Life Sciences
8.2.6.3 IT and Telecom
8.2.6.4 Government
8.2.6.5 Retail & Consumer Packaged Goods
8.2.6.6 Manufacturing
8.2.7 Historic and Forecast Market Size by Country
8.2.7.1 US
8.2.7.2 Canada
8.2.7.3 Mexico
8.3. Eastern Europe Customer Experience as a Service (CXaaS) Market
8.3.1 Key Market Trends, Growth Factors and Opportunities
8.3.2 Top Key Companies
8.3.3 Historic and Forecasted Market Size by Segments
8.3.4 Historic and Forecasted Market Size by Service Type
8.3.4.1 Campaign Development
8.3.4.2 Cross Channel Marketing
8.3.4.3 Omni Channel Engagement
8.3.5 Historic and Forecasted Market Size by Enterprise Size
8.3.5.1 Small and Medium Enterprise
8.3.5.2 Large Enterprise
8.3.6 Historic and Forecasted Market Size by Industry
8.3.6.1 BFSI
8.3.6.2 Healthcare & Life Sciences
8.3.6.3 IT and Telecom
8.3.6.4 Government
8.3.6.5 Retail & Consumer Packaged Goods
8.3.6.6 Manufacturing
8.3.7 Historic and Forecast Market Size by Country
8.3.7.1 Russia
8.3.7.2 Bulgaria
8.3.7.3 The Czech Republic
8.3.7.4 Hungary
8.3.7.5 Poland
8.3.7.6 Romania
8.3.7.7 Rest of Eastern Europe
8.4. Western Europe Customer Experience as a Service (CXaaS) Market
8.4.1 Key Market Trends, Growth Factors and Opportunities
8.4.2 Top Key Companies
8.4.3 Historic and Forecasted Market Size by Segments
8.4.4 Historic and Forecasted Market Size by Service Type
8.4.4.1 Campaign Development
8.4.4.2 Cross Channel Marketing
8.4.4.3 Omni Channel Engagement
8.4.5 Historic and Forecasted Market Size by Enterprise Size
8.4.5.1 Small and Medium Enterprise
8.4.5.2 Large Enterprise
8.4.6 Historic and Forecasted Market Size by Industry
8.4.6.1 BFSI
8.4.6.2 Healthcare & Life Sciences
8.4.6.3 IT and Telecom
8.4.6.4 Government
8.4.6.5 Retail & Consumer Packaged Goods
8.4.6.6 Manufacturing
8.4.7 Historic and Forecast Market Size by Country
8.4.7.1 Germany
8.4.7.2 UK
8.4.7.3 France
8.4.7.4 The Netherlands
8.4.7.5 Italy
8.4.7.6 Spain
8.4.7.7 Rest of Western Europe
8.5. Asia Pacific Customer Experience as a Service (CXaaS) Market
8.5.1 Key Market Trends, Growth Factors and Opportunities
8.5.2 Top Key Companies
8.5.3 Historic and Forecasted Market Size by Segments
8.5.4 Historic and Forecasted Market Size by Service Type
8.5.4.1 Campaign Development
8.5.4.2 Cross Channel Marketing
8.5.4.3 Omni Channel Engagement
8.5.5 Historic and Forecasted Market Size by Enterprise Size
8.5.5.1 Small and Medium Enterprise
8.5.5.2 Large Enterprise
8.5.6 Historic and Forecasted Market Size by Industry
8.5.6.1 BFSI
8.5.6.2 Healthcare & Life Sciences
8.5.6.3 IT and Telecom
8.5.6.4 Government
8.5.6.5 Retail & Consumer Packaged Goods
8.5.6.6 Manufacturing
8.5.7 Historic and Forecast Market Size by Country
8.5.7.1 China
8.5.7.2 India
8.5.7.3 Japan
8.5.7.4 South Korea
8.5.7.5 Malaysia
8.5.7.6 Thailand
8.5.7.7 Vietnam
8.5.7.8 The Philippines
8.5.7.9 Australia
8.5.7.10 New Zealand
8.5.7.11 Rest of APAC
8.6. Middle East & Africa Customer Experience as a Service (CXaaS) Market
8.6.1 Key Market Trends, Growth Factors and Opportunities
8.6.2 Top Key Companies
8.6.3 Historic and Forecasted Market Size by Segments
8.6.4 Historic and Forecasted Market Size by Service Type
8.6.4.1 Campaign Development
8.6.4.2 Cross Channel Marketing
8.6.4.3 Omni Channel Engagement
8.6.5 Historic and Forecasted Market Size by Enterprise Size
8.6.5.1 Small and Medium Enterprise
8.6.5.2 Large Enterprise
8.6.6 Historic and Forecasted Market Size by Industry
8.6.6.1 BFSI
8.6.6.2 Healthcare & Life Sciences
8.6.6.3 IT and Telecom
8.6.6.4 Government
8.6.6.5 Retail & Consumer Packaged Goods
8.6.6.6 Manufacturing
8.6.7 Historic and Forecast Market Size by Country
8.6.7.1 Turkiye
8.6.7.2 Bahrain
8.6.7.3 Kuwait
8.6.7.4 Saudi Arabia
8.6.7.5 Qatar
8.6.7.6 UAE
8.6.7.7 Israel
8.6.7.8 South Africa
8.7. South America Customer Experience as a Service (CXaaS) Market
8.7.1 Key Market Trends, Growth Factors and Opportunities
8.7.2 Top Key Companies
8.7.3 Historic and Forecasted Market Size by Segments
8.7.4 Historic and Forecasted Market Size by Service Type
8.7.4.1 Campaign Development
8.7.4.2 Cross Channel Marketing
8.7.4.3 Omni Channel Engagement
8.7.5 Historic and Forecasted Market Size by Enterprise Size
8.7.5.1 Small and Medium Enterprise
8.7.5.2 Large Enterprise
8.7.6 Historic and Forecasted Market Size by Industry
8.7.6.1 BFSI
8.7.6.2 Healthcare & Life Sciences
8.7.6.3 IT and Telecom
8.7.6.4 Government
8.7.6.5 Retail & Consumer Packaged Goods
8.7.6.6 Manufacturing
8.7.7 Historic and Forecast Market Size by Country
8.7.7.1 Brazil
8.7.7.2 Argentina
8.7.7.3 Rest of SA
Chapter 9 Analyst Viewpoint and Conclusion
9.1 Recommendations and Concluding Analysis
9.2 Potential Market Strategies
Chapter 10 Research Methodology
10.1 Research Process
10.2 Primary Research
10.3 Secondary Research
|
Customer Experience as a Service (CXaaS) Market |
|||
|
Base Year: |
2024 |
Forecast Period: |
2025-2032 |
|
Historical Data: |
2018 to 2024 |
Market Size in 2024: |
USD 2.44 Bn. |
|
Forecast Period 2023-30 CAGR: |
14.28% |
Market Size in 2030: |
USD 7.1 Bn. |
|
Segments Covered: |
By Service Type |
|
|
|
By Enterprise Size |
|
||
|
By Industry |
|
||
|
By Region |
|
||
|
Key Market Drivers: |
|
||
|
Key Market Restraints: |
|
||
|
Key Opportunities: |
|
||
|
Companies Covered in the report: |
|
||


