


Commercial Paper Market Synopsis
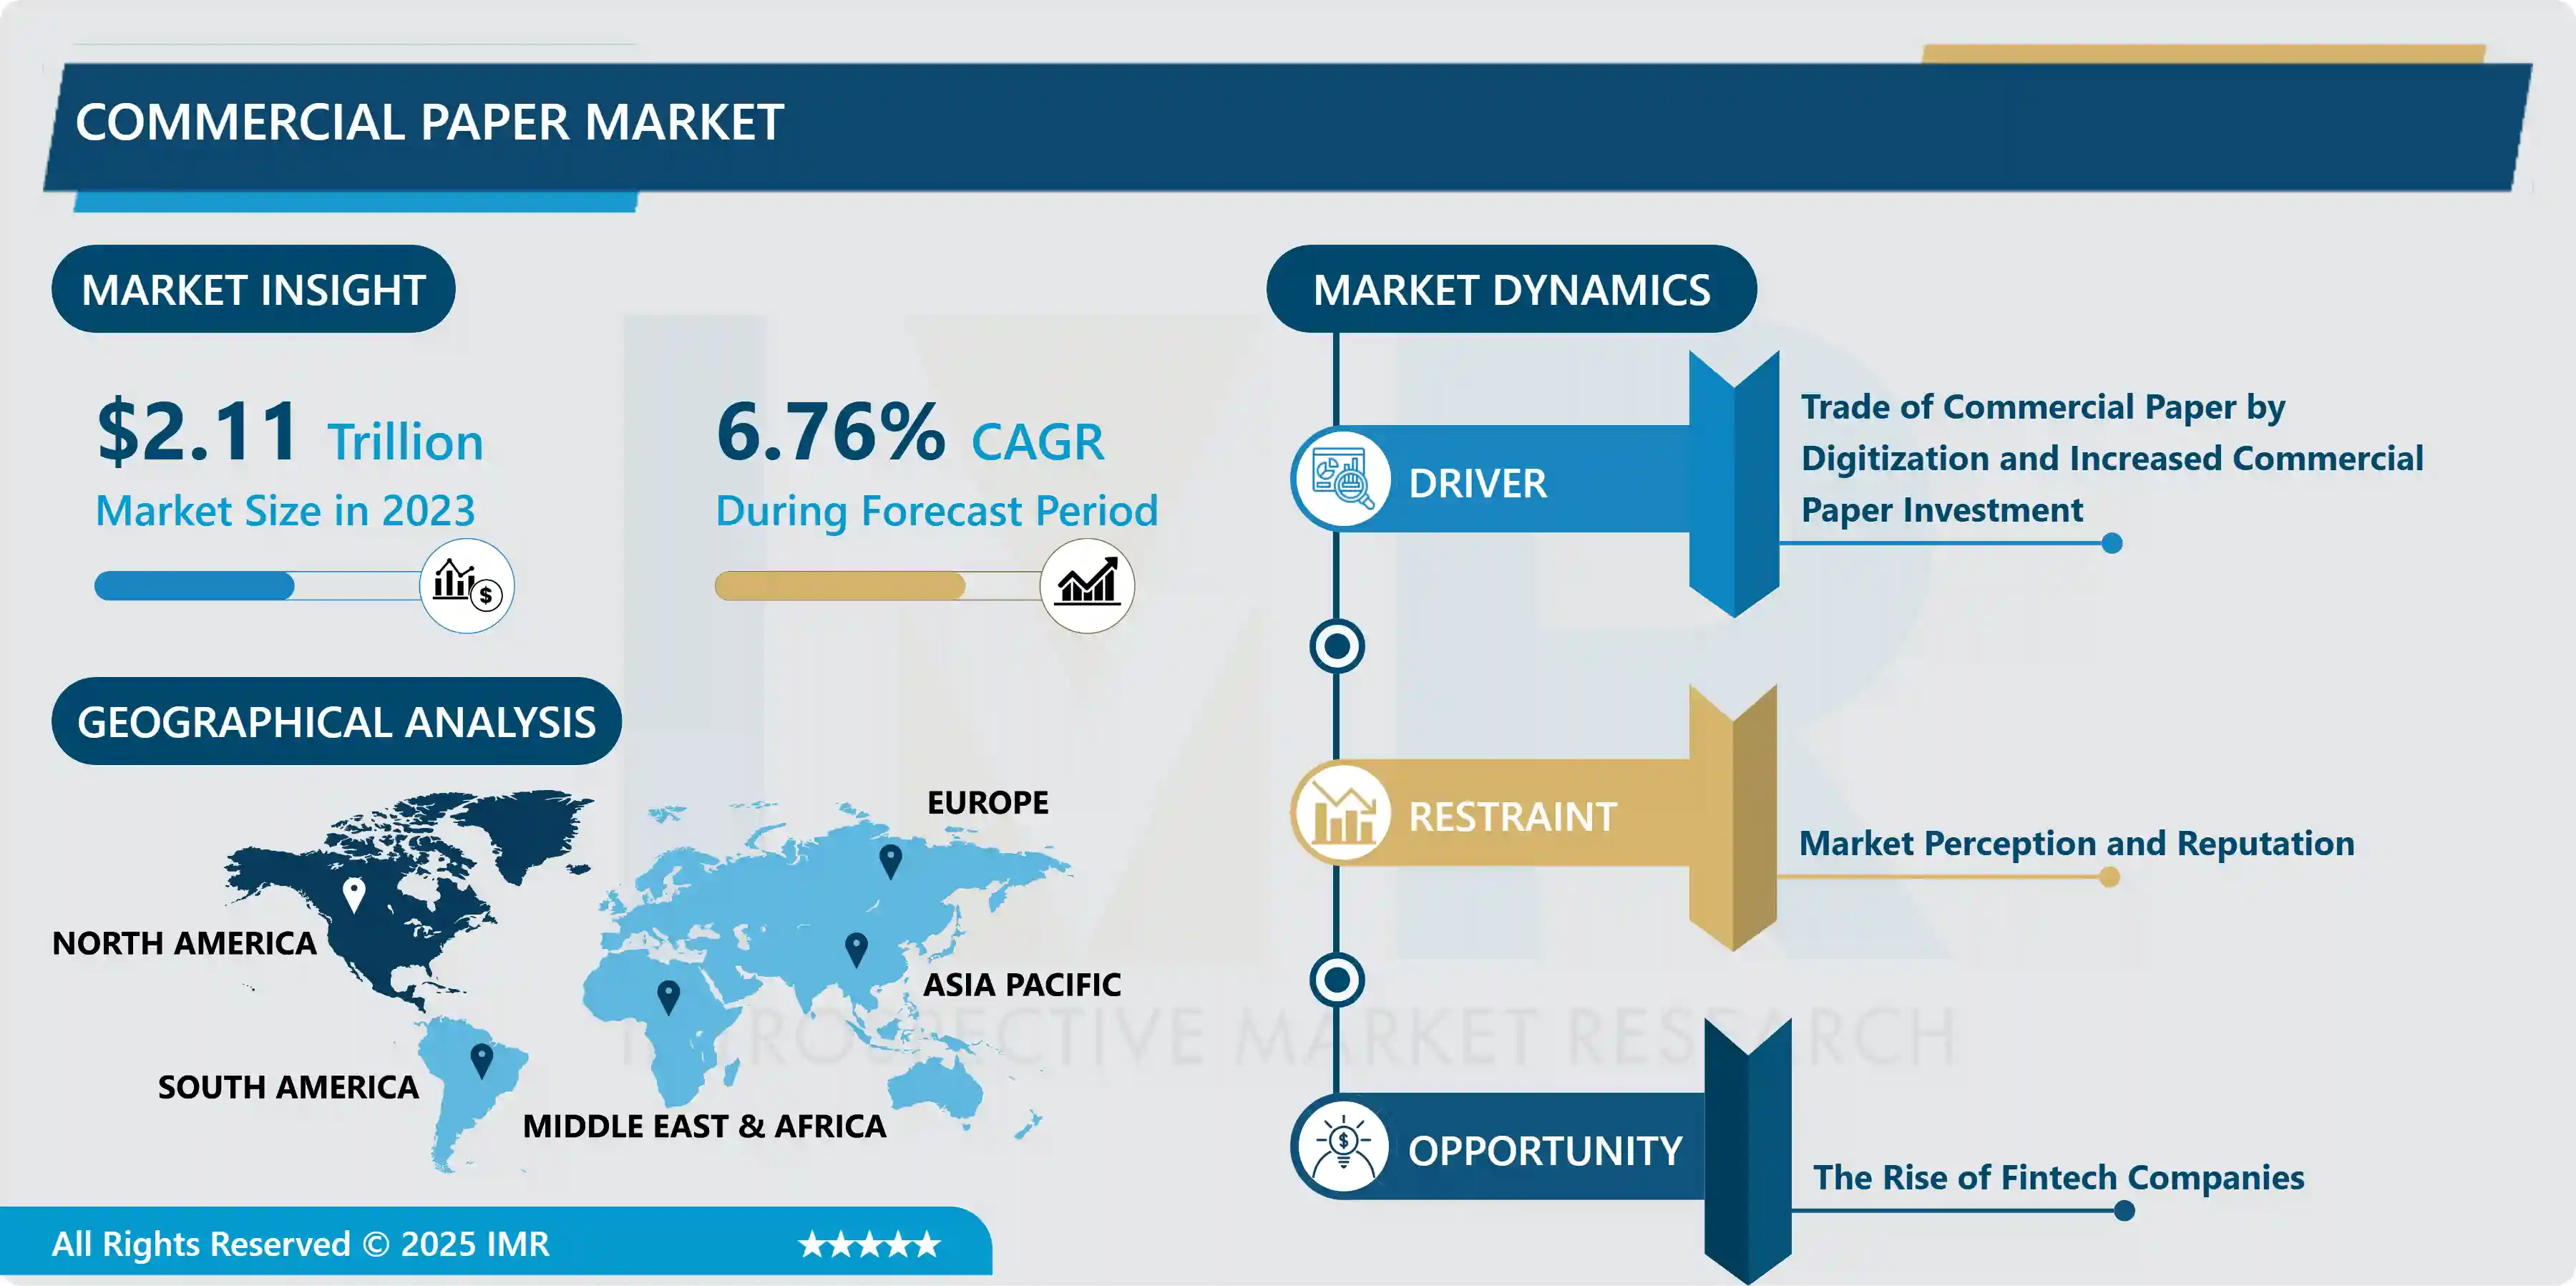
The global commercial paper market was valued at USD 2.11 trillion in 2023 and is expected to reach USD 3.8 trillion by 2032, growing at a CAGR of 6.76% from 2024 to 2032.
Commercial paper is a type of unsecured promissory note that trades on the world financial market with a specified maturity of no more than 270 days. To raise money to cover short-term debt commitments, large corporations issue commercial paper, a money-market product that is only guaranteed by the issuing bank's or company's promise to pay the face amount on the designated maturity date. Commercial paper can only be sold at a competitive price to businesses with high credit ratings from a respected credit rating organization because it is not collateralized.
Commercial paper offers various benefits, including low cost, high yields, flexibility, low risk, tax benefits, and liquidity. It provides ease of access and is widely accepted by financial institutions, with regulatory oversight ensuring investor protection. Types of commercial paper include drafts, promissory notes, receivable-backed, asset-backed, and Euro commercial paper.
Additionally, there are certificates of deposit, letters of credit, structured notes, and registered notes. Investors should carefully consider factors such as credit ratings, maturity, liquidity, and regulations to make informed decisions and diversify their portfolios while reducing volatility risks.
The commercial paper market is expected to experience significant growth shortly due to several factors. Commercial paper is usually issued at a discount to face value and offers lower interest repayment rates compared to bonds, mainly because of its shorter maturities. This attractive feature, combined with the ease of accessing funds and cost-saving benefits for businesses, is likely to drive increased demand and redemption on fixed maturity dates, contributing to the market's expansion.
 The Commercial Paper Market Trend Analysis
Trade of Commercial Paper by Digitization and Increased Commercial Paper Investment
- Digitization and increased investment in commercial paper have emerged as significant growth drivers in the Global Commercial Paper Market. The adoption of digital technology has transformed the traditional commercial paper market, streamlining processes and improving accessibility for investors and issuers alike.
- The shift towards digital platforms and electronic trading has facilitated faster and more efficient commercial paper issuance, trading, and settlement. Investors can now access a broader pool of commercial paper offerings through online platforms, enabling them to make informed investment decisions with real-time pricing and increased transparency.
- Moreover, digitalization has simplified administrative tasks, reducing paperwork and operational costs for businesses issuing commercial paper. This has made commercial paper more attractive to companies seeking cost-effective short-term financing solutions.
- Increased investment in commercial paper is driven by several factors. In today's low-interest-rate environment, investors are searching for higher-yielding alternatives to traditional fixed-income securities. Commercial paper, with its relatively attractive returns and shorter maturities, presents an appealing option for investors seeking short-term opportunities to diversify their portfolios and mitigate risk.
- Furthermore, regulatory changes and credit enhancements have bolstered the credit quality of commercial paper, instilling greater confidence in investors. As a result, more investors are turning to commercial paper as a safe and liquid short-term investment option.
The Rise of Fintech Companies
- Fintech companies are using technology to provide new financial services, such as lending and investment. This is creating new opportunities for the commercial paper market, as fintech companies are looking to raise funds to finance their growth.
- Fintech companies can offer innovative short-term financing solutions that complement commercial paper offerings. These solutions could include invoice financing, supply chain finance, and other working capital solutions that cater to the specific needs of finance companies.
- Finance companies may encounter restrictions on their demand for commercial paper funds due to established standards set by dealers and institutional lenders. For example, when investing in long-term securities of finance companies, life insurance companies may impose conditions where the short-term debt cannot exceed a certain percentage of the total long-term debt, and the amount of commercial paper cannot exceed a certain percentage of the total short-term debt.
- Furthermore, commercial paper borrowers are typically required to maintain open bank lines that match the outstanding amounts of commercial paper at all times, with very few exceptions.
- The rise of fintech companies is driving innovation in the commercial paper market, offering new financing options and opportunities while also facing constraints from established standards and regulations.
Segmentation Analysis of the Commercial Paper Market
Commercial Paper market segments cover the Type and end-users. By Type, the Drafts segment is anticipated to dominate the Market over the Forecast period.
- The landscape of the commercial paper market is poised for a significant shift over the projected period, with a particular type of financial instrument expected to take center stage - the draft. A draft, characterized by its three-party nature involving the drawer, drawee, and payee, holds the potential to dominate this market for several reasons.
- Sight drafts and time drafts, the two main categories of drafts, offer versatile solutions to complex financial transactions. Sight drafts, facilitating immediate payment upon presentation, cater to scenarios where parties seek secure and synchronized exchanges, ensuring seamless transactions in contexts like international trade. Conversely, time drafts accommodate scenarios necessitating deferred payments, accommodating situations where cash flow considerations diverge between transacting parties.
- Moreover, the global nature of drafts, often termed bills of exchange in international trade, extends their dominance. Their negotiability, often facilitated by endorsement, fosters ease of transfer, a critical feature in trade and commerce. The advent of banker's acceptances, a form of draft, furthers their influence. Such instruments enhance credit facilities, enabling exporters to extend credit to importers underwritten by banks, thus bolstering trust and trade relationships across borders.
- As international trade continues to expand, and intricate financial arrangements emerge, drafts' adaptability and reliability position them as a cornerstone of the commercial paper market. With their ability to streamline transactions, mitigate risk, and facilitate cross-border commerce, drafts are anticipated to wield considerable influence over the forecast period, shaping the dynamics of the commercial paper landscape.
Regional Analysis of The Commercial Paper Market
North America is expected to dominate the Market over the Forecast Period.
- North America dominates the market in the year 2022 the United States is one of the largest economies in North America, it is a highly developed financial market as well as a corporate sector. This creates a favorable environment for the issuance and trading of commercial paper.
- Also, the well-established regulatory framework for commercial paper promotes transparency, investor protection, and market stability. This factor significantly helps the Commercial Paper Market growth in North American Region. North America holds a significant position in the global financial market, specifically in terms of institutional investors and the commercial paper market. These institutional investors participate in the commercial paper market.
- The fact that the U.S. dollar is the global reserve currency is why many investors worldwide are attracted to the stability and ease of trading that comes with using the U.S. dollar. This presence of international investors in the commercial paper market makes North America a significant place for businesses to raise money through debt. This creates opportunities for both domestic and international entities to access funding efficiently.
Top Key Players Covered in the Commercial Paper Market
- Domtar (US)
- Sappi Limited (South Africa)
- Nippon Paper (Japan)
- Nine Dragon Paper Holdings (China)
- Svenska Cellulosa Aktiebolaget (Sweden)
- Packaging Corporation Of America (US)
- Jk Paper Ltd. (India)
- Seshasayee Paper & Boards Ltd. (India)
- Ds Smith (UK)
- Mondi (UK)
- Smurfit Kappa Group (Ireland)
- Oji Holdings (Japan)
- Tamilnadu Newsprint & Papers Ltd. (India)
- Stora Enso (Finland)
- International Paper Company (US)
- Georgia-Pacific Llc (US)
- Stora Enso Oyj (Finland)
- Ballarpur Industries Ltd. (Avantha) (India)
- Upm (Finland)
- Westrock (US)
- Kimberly-Clark (US)
- Andhra Paper Ltd. (India)
- Emami Paper Mills Ltd. (India)
- Kuantum Papers Ltd. (India)
- Satia Industries Ltd. (India), and Other Major Players.
Key Industry Developments in the Commercial Paper Market
- In February 2023, The Asian Infrastructure Investment Bank (AIIB) is launching its inaugural USD5-billion multicurrency Euro Commercial Paper (AIIB ECP) program in February 2023. The program expands AIIB’s short-term funding options and demonstrates the Bank’s agility in meeting investors’ demand for sustainable investment through high-quality debt capital market issuance programs.
- In March 2023, Bajaj Finance Ltd. acquired ICICI Home Finance Ltd. in a deal valued at $1.1 billion. This move strengthens Bajaj Finance's position in the housing finance market and expands its access to the commercial paper market for funding.
- In June 2023, Edelweiss Financial Services Ltd. merges with Shriram Capital Ltd. to create a diversified financial services conglomerate. The combined entity is expected to have increased access to the commercial paper market due to its improved credit rating and larger size.
|
Global Commercial Paper Market |
|||
|
Base Year: |
2023 |
Forecast Period: |
2024-2032 |
|
Historical Data: |
2017 to 2023 |
Market Size in 2023: |
USD 2.11 Tn. |
|
Forecast Period 2024-32 CAGR: |
6.76% |
Market Size in 2032: |
USD 3.8 Tn. |
|
Segments Covered: |
By Type |
|
|
|
By End Users |
|
||
|
By Region |
|
||
|
Key Market Drivers: |
|
||
|
Key Market Restraints: |
|
||
|
Key Opportunities: |
|
||
|
Companies Covered in the report: |
|
||
Chapter 1: Introduction
1.1 Scope and Coverage
Chapter 2:Executive Summary
Chapter 3: Market Landscape
3.1 Market Dynamics
3.1.1 Drivers
3.1.2 Restraints
3.1.3 Opportunities
3.1.4 Challenges
3.2 Market Trend Analysis
3.3 PESTLE Analysis
3.4 Porter's Five Forces Analysis
3.5 Industry Value Chain Analysis
3.6 Ecosystem
3.7 Regulatory Landscape
3.8 Price Trend Analysis
3.9 Patent Analysis
3.10 Technology Evolution
3.11 Investment Pockets
3.12 Import-Export Analysis
Chapter 4: Commercial Paper Market by Type (2018-2032)
4.1 Commercial Paper Market Snapshot and Growth Engine
4.2 Market Overview
4.3 Promissory Notes
4.3.1 Introduction and Market Overview
4.3.2 Historic and Forecasted Market Size in Value USD and Volume Units
4.3.3 Key Market Trends, Growth Factors, and Opportunities
4.3.4 Geographic Segmentation Analysis
4.4 Drafts
4.5 Checks
4.6 Certificates
Chapter 5: Commercial Paper Market by End Users (2018-2032)
5.1 Commercial Paper Market Snapshot and Growth Engine
5.2 Market Overview
5.3 Retail
5.3.1 Introduction and Market Overview
5.3.2 Historic and Forecasted Market Size in Value USD and Volume Units
5.3.3 Key Market Trends, Growth Factors, and Opportunities
5.3.4 Geographic Segmentation Analysis
5.4 Institutional
5.5 High-Net-Worth Individual (HNWI)
5.6 Corporates
Chapter 6: Company Profiles and Competitive Analysis
6.1 Competitive Landscape
6.1.1 Competitive Benchmarking
6.1.2 Commercial Paper Market Share by Manufacturer (2024)
6.1.3 Industry BCG Matrix
6.1.4 Heat Map Analysis
6.1.5 Mergers and Acquisitions
6.2 THYSSENKRUPP AG
6.2.1 Company Overview
6.2.2 Key Executives
6.2.3 Company Snapshot
6.2.4 Role of the Company in the Market
6.2.5 Sustainability and Social Responsibility
6.2.6 Operating Business Segments
6.2.7 Product Portfolio
6.2.8 Business Performance
6.2.9 Key Strategic Moves and Recent Developments
6.2.10 SWOT Analysis
6.3 POSCO
6.4 TATA STEEL
6.5 AK STEEL HOLDING CORPORATION
6.6 ALLEGHENY TECHNOLOGIES INCORPORATED (ATI)
6.7 CARPENTER TECHNOLOGY CORPORATION
6.8 KOBE STEEL LTDJFE STEEL CORPORATION
6.9 APERAM
6.10 SANDVIK AB
6.11 CARPENTER TECHNOLOGY CORPORATION
6.12 TIMKENSTEEL CORPORATION
6.13 HAYNES INTERNATIONAL
6.14 NUCOR CORPORATION
6.15 VSMPO-AVISMA CORPORATION
6.16 ULBRICH STAINLESS STEELS & SPECIAL METALS
6.17 SPECIAL METALS CORPORATION
6.18 VOESTALPINE AG
6.19 MUKAND LIMITED
6.20 AMETEK SPECIALTY METAL PRODUCTS
6.21 PRECISION CASTPARTS CORP (PCC)
6.22 ALLEGHENY LUDLUM
Chapter 7: Global Commercial Paper Market By Region
7.1 Overview
7.2. North America Commercial Paper Market
7.2.1 Key Market Trends, Growth Factors and Opportunities
7.2.2 Top Key Companies
7.2.3 Historic and Forecasted Market Size by Segments
7.2.4 Historic and Forecasted Market Size by Type
7.2.4.1 Promissory Notes
7.2.4.2 Drafts
7.2.4.3 Checks
7.2.4.4 Certificates
7.2.5 Historic and Forecasted Market Size by End Users
7.2.5.1 Retail
7.2.5.2 Institutional
7.2.5.3 High-Net-Worth Individual (HNWI)
7.2.5.4 Corporates
7.2.6 Historic and Forecast Market Size by Country
7.2.6.1 US
7.2.6.2 Canada
7.2.6.3 Mexico
7.3. Eastern Europe Commercial Paper Market
7.3.1 Key Market Trends, Growth Factors and Opportunities
7.3.2 Top Key Companies
7.3.3 Historic and Forecasted Market Size by Segments
7.3.4 Historic and Forecasted Market Size by Type
7.3.4.1 Promissory Notes
7.3.4.2 Drafts
7.3.4.3 Checks
7.3.4.4 Certificates
7.3.5 Historic and Forecasted Market Size by End Users
7.3.5.1 Retail
7.3.5.2 Institutional
7.3.5.3 High-Net-Worth Individual (HNWI)
7.3.5.4 Corporates
7.3.6 Historic and Forecast Market Size by Country
7.3.6.1 Russia
7.3.6.2 Bulgaria
7.3.6.3 The Czech Republic
7.3.6.4 Hungary
7.3.6.5 Poland
7.3.6.6 Romania
7.3.6.7 Rest of Eastern Europe
7.4. Western Europe Commercial Paper Market
7.4.1 Key Market Trends, Growth Factors and Opportunities
7.4.2 Top Key Companies
7.4.3 Historic and Forecasted Market Size by Segments
7.4.4 Historic and Forecasted Market Size by Type
7.4.4.1 Promissory Notes
7.4.4.2 Drafts
7.4.4.3 Checks
7.4.4.4 Certificates
7.4.5 Historic and Forecasted Market Size by End Users
7.4.5.1 Retail
7.4.5.2 Institutional
7.4.5.3 High-Net-Worth Individual (HNWI)
7.4.5.4 Corporates
7.4.6 Historic and Forecast Market Size by Country
7.4.6.1 Germany
7.4.6.2 UK
7.4.6.3 France
7.4.6.4 The Netherlands
7.4.6.5 Italy
7.4.6.6 Spain
7.4.6.7 Rest of Western Europe
7.5. Asia Pacific Commercial Paper Market
7.5.1 Key Market Trends, Growth Factors and Opportunities
7.5.2 Top Key Companies
7.5.3 Historic and Forecasted Market Size by Segments
7.5.4 Historic and Forecasted Market Size by Type
7.5.4.1 Promissory Notes
7.5.4.2 Drafts
7.5.4.3 Checks
7.5.4.4 Certificates
7.5.5 Historic and Forecasted Market Size by End Users
7.5.5.1 Retail
7.5.5.2 Institutional
7.5.5.3 High-Net-Worth Individual (HNWI)
7.5.5.4 Corporates
7.5.6 Historic and Forecast Market Size by Country
7.5.6.1 China
7.5.6.2 India
7.5.6.3 Japan
7.5.6.4 South Korea
7.5.6.5 Malaysia
7.5.6.6 Thailand
7.5.6.7 Vietnam
7.5.6.8 The Philippines
7.5.6.9 Australia
7.5.6.10 New Zealand
7.5.6.11 Rest of APAC
7.6. Middle East & Africa Commercial Paper Market
7.6.1 Key Market Trends, Growth Factors and Opportunities
7.6.2 Top Key Companies
7.6.3 Historic and Forecasted Market Size by Segments
7.6.4 Historic and Forecasted Market Size by Type
7.6.4.1 Promissory Notes
7.6.4.2 Drafts
7.6.4.3 Checks
7.6.4.4 Certificates
7.6.5 Historic and Forecasted Market Size by End Users
7.6.5.1 Retail
7.6.5.2 Institutional
7.6.5.3 High-Net-Worth Individual (HNWI)
7.6.5.4 Corporates
7.6.6 Historic and Forecast Market Size by Country
7.6.6.1 Turkiye
7.6.6.2 Bahrain
7.6.6.3 Kuwait
7.6.6.4 Saudi Arabia
7.6.6.5 Qatar
7.6.6.6 UAE
7.6.6.7 Israel
7.6.6.8 South Africa
7.7. South America Commercial Paper Market
7.7.1 Key Market Trends, Growth Factors and Opportunities
7.7.2 Top Key Companies
7.7.3 Historic and Forecasted Market Size by Segments
7.7.4 Historic and Forecasted Market Size by Type
7.7.4.1 Promissory Notes
7.7.4.2 Drafts
7.7.4.3 Checks
7.7.4.4 Certificates
7.7.5 Historic and Forecasted Market Size by End Users
7.7.5.1 Retail
7.7.5.2 Institutional
7.7.5.3 High-Net-Worth Individual (HNWI)
7.7.5.4 Corporates
7.7.6 Historic and Forecast Market Size by Country
7.7.6.1 Brazil
7.7.6.2 Argentina
7.7.6.3 Rest of SA
Chapter 8 Analyst Viewpoint and Conclusion
8.1 Recommendations and Concluding Analysis
8.2 Potential Market Strategies
Chapter 9 Research Methodology
9.1 Research Process
9.2 Primary Research
9.3 Secondary Research
|
Global Commercial Paper Market |
|||
|
Base Year: |
2023 |
Forecast Period: |
2024-2032 |
|
Historical Data: |
2017 to 2023 |
Market Size in 2023: |
USD 2.11 Tn. |
|
Forecast Period 2024-32 CAGR: |
6.76% |
Market Size in 2032: |
USD 3.8 Tn. |
|
Segments Covered: |
By Type |
|
|
|
By End Users |
|
||
|
By Region |
|
||
|
Key Market Drivers: |
|
||
|
Key Market Restraints: |
|
||
|
Key Opportunities: |
|
||
|
Companies Covered in the report: |
|
||


