


Global Circular Economy Market Overview
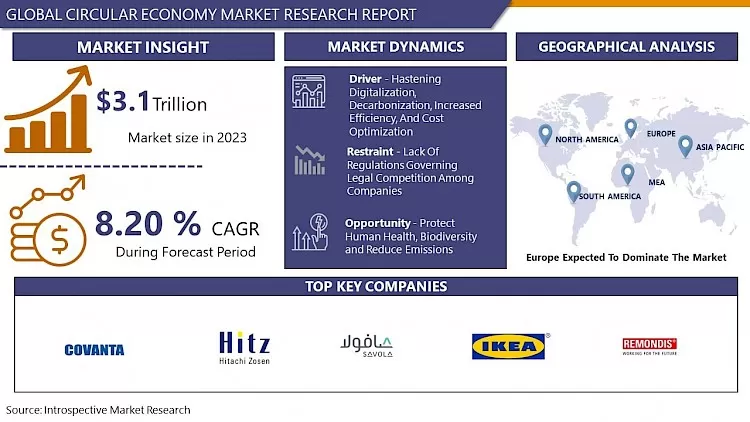
Circular Economy Market Size Was Valued at USD 3.1 Trillion in 2023 and is Projected to Reach USD 6.3 Trillion by 2032, Growing at a CAGR of 8.20 % From 2024-2032.
The concept of a circular economy was not originated by a single person. Although the concept underlying it was first discussed in the middle of the twentieth century, the phrase itself is mostly a 21st-century invention. A circular economy, also known as circularity or CE, is a production and consumption model that prioritizes sharing, renting, reusing, repairing, and recycling already-existent goods and resources for as long as possible. By putting a focus on the design-based implementation of the model's three guiding principles, CE seeks to address issues including climate change, biodiversity loss, waste, and pollution. the three guiding principles of a circular economy, including reducing waste and pollution, recycling goods and materials, and restoring nature.
The expansion of the circular economy market is primarily ascribed to strict rules for waste reuse and recycling, enhanced material circulation, and low landfill waste volumes, which are fueled by accelerated digitization, decarbonization, efficiency gains, and cost optimization. The building as material banks (BAMBs) concept, chemical recycling of plastic waste, decarbonization, AI-based smart sorting, emerging solutions for the recycling of cardboard and paper packaging waste, the digital sustainability of supply chains, circular economies for the recycling of used oil, chemical recycling of plastic waste, and circular economies for the disposal of IT assets are important investment areas and top trends in 2022 (ITAD).

Market Dynamics And Factors For Circular Economy Market
Drivers:
Hastening Digitalization, Decarbonization, Increased Efficiency, And Cost Optimization
- The Circular Economy Market is propelled by the convergence of digitalization, decarbonization, increased efficiency, and cost optimization. Digitalization fosters innovative solutions, enabling the tracking and optimization of resources throughout their lifecycle. This facilitates the transition from a linear 'take-make-dispose' model to a circular one, where products are designed for longevity, reuse, and recycling.
- Decarbonization efforts drive the adoption of sustainable practices, reducing emissions and mitigating climate change impacts. Increased efficiency ensures optimal resource utilization, minimizing waste generation and maximizing value creation. Cost optimization strategies prioritize resource efficiency, driving down production costs and enhancing competitiveness.
- Together, these factors create a conducive environment for the Circular Economy Market to thrive. Businesses recognize the economic and environmental benefits of adopting circular practices, leading to a surge in investments and initiatives. Governments and policymakers play a crucial role in facilitating this transition through supportive policies, incentives, and regulations.
Restraints:
Lack Of Regulations Governing Legal Competition Among Companies
- The absence of robust regulations governing fair competition among companies presents a significant restraint for the Circular Economy Market. Circular economy principles aim to minimize waste and maximize resource efficiency by promoting the reuse, recycling, and regeneration of products and materials. However, without clear guidelines ensuring fair competition, companies may resort to unsustainable practices such as greenwashing or undercutting prices at the expense of environmental and social standards.
- Inadequate regulations can lead to market distortions where companies prioritize short-term gains over long-term sustainability goals. This can deter investment in circular economy initiatives and innovation, as companies may perceive compliance with environmental standards as a competitive disadvantage. Moreover, without regulatory oversight, there's a risk of monopolistic behavior or unfair market practices that hinder smaller players from entering and thriving in the circular economy market.
Opportunity:
The Market Create Opportunity to Protect Human Health, Biodiversity and Reduce Emissions
- The Circular Economy Market presents a unique opportunity to safeguard human health, preserve biodiversity, and mitigate emissions. By emphasizing the reuse, recycling, and repurposing of resources, this market fosters sustainable practices that benefit both the environment and society.
- By extending the lifespan of products through repair, refurbishment, and remanufacturing, we can minimize the need for raw materials, thereby curbing habitat destruction and preserving biodiversity. Additionally, by encouraging the use of renewable energy sources and efficient transportation methods, the Circular Economy Market helps to reduce harmful emissions, mitigating the impacts of climate change and improving air quality.
- The market incentivizes innovation in eco-friendly materials and production processes, spurring the development of safer, healthier products. This not only protects human health but also promotes responsible consumption patterns that prioritize longevity and sustainability.
Challenges:
Poor Environmental Awareness On The Part of Suppliers And Clients
- The poor environmental awareness among suppliers and clients poses significant challenges to the circular economy market. Suppliers often prioritize cost efficiency and short-term gains over sustainability practices, leading to the production of goods with high environmental footprints and limited recyclability. Similarly, clients may not be well-informed about the importance of choosing eco-friendly products or may prioritize convenience and affordability over sustainability.
- This lack of awareness creates a vicious cycle where unsustainable practices persist throughout the supply chain, hindering the adoption of circular economy principles. Additionally, without demand for recycled or refurbished products, suppliers may not invest in developing more sustainable alternatives, further perpetuating the problem.
Regional Analysis In Circular Economy Market
- Europe has emerged as a dominant force in the global Circular Economy Market, showcasing exemplary leadership and innovation. Through stringent regulations, ambitious targets, and proactive policies, European nations have fostered an environment conducive to circularity across industries. The European Union's Circular Economy Action Plan serves as a comprehensive roadmap, outlining strategies to minimize waste generation, maximize resource efficiency, and promote sustainable consumption and production practices.
- European businesses have embraced circularity as a core principle, driving the development of innovative technologies and business models. From recycling and remanufacturing to product redesign and waste-to-energy solutions, European companies are at the forefront of circular innovation. Collaborative initiatives between public and private sectors further accelerate progress, fostering knowledge sharing and facilitating investments in circular projects.
- Consumers in Europe increasingly prioritize sustainability, demanding eco-friendly products and services. This shift in consumer behavior incentivizes businesses to adopt circular practices, creating a virtuous cycle of sustainability-driven innovation and market growth. Moreover, Europe's circular economy leadership extends beyond its borders through international partnerships and initiatives, inspiring global action towards a more sustainable future.
Top Key Players Covered In The Circular Economy Market
- Covanta Holding Corporation
- Hitachi Zosen Corporation
- Suez Environment S.A Clean Harbors Inc
- The Savola Group
- IKEA Food
- Remondis AG and Co. Kg
- Waste Management Inc
- Biffa Group
- Daiseki Co. Ltd
- Cisco
- Levi Strauss
- H&M Group
- Advanced Disposal Services
- Veolia Environment S.A, and Other Major Players
Key Industry Developments:
- In October 2023, SAP upgraded its SAP Responsible Design and Production Suite. The latest version of SAP Responsible Design and Production includes updated EPR reporting capability to support the enhanced reporting and integration with multiple ERP with non-harmonized identifiers, augmenting its digital circular economy capabilities.
- In October 2023, Honeywell and GranBio Technologies partnered together to co-produce carbon-neutral sustainable aviation fuel (SAF) from biomass residues at a US-based demonstration plant. Honeywell aims to leverage its renewable energy expertise in generating SAF for strengthening its position as a major circular economy vendor across aerospace and aviation sector.
- In September 2023, Capgemini acquired HDL Design House, a leading silicon design and verification services provider. The synergy between silicon services and digital circular economy is profound, as advanced silicon design plays a pivotal role in optimizing resource usage and fostering sustainability. This acquisition equips Capgemini to offer innovative solutions that align seamlessly with circular economy practices, reinforcing its commitment to driving sustainable digital transformations in the evolving business landscape.
- In June 2023, SAP and Versuni announced a global partnership focused on sustainability and circular economy. With the SAP Sustainability Control Tower software, a digital tool for ESG management based on real-time data, Versuni will be able to promote holistic management by setting goals, monitoring progress, and gaining insights from data, generating robust and auditable ESG reports, as well as improvement actions.
- In April 2023, Cisco and Leonardo entered into a strategic MoU, aimed at boosting cooperation between Cisco and Leonardo in various areas. Both entities will be co-developing solutions in sustainable technology fields such as the green transition and sustainable solutions for logistics and transportation markets.
|
Global Circular Economy Market |
|||
|
Base Year: |
2023 |
Forecast Period: |
2024-2032 |
|
Historical Data: |
2017 to 2022 |
Market Size in 2023: |
USD 3.1 Tr. |
|
Forecast Period 2024-32 CAGR: |
8.20% |
Market Size in 2032: |
USD 6.3 Tr. |
|
Segments Covered: |
By Waste Management |
|
|
|
By Industry |
|
||
|
By Region |
|
||
|
Key Market Drivers: |
|
||
|
Key Market Restraints: |
|
||
|
Key Opportunities: |
|
||
|
Companies Covered in the report: |
|
||
1.1 Scope and Coverage
Chapter 2:Executive Summary
Chapter 3: Market Landscape
3.1 Market Dynamics
3.1.1 Drivers
3.1.2 Restraints
3.1.3 Opportunities
3.1.4 Challenges
3.2 Market Trend Analysis
3.3 PESTLE Analysis
3.4 Porter's Five Forces Analysis
3.5 Industry Value Chain Analysis
3.6 Ecosystem
3.7 Regulatory Landscape
3.8 Price Trend Analysis
3.9 Patent Analysis
3.10 Technology Evolution
3.11 Investment Pockets
3.12 Import-Export Analysis
Chapter 4: Circular Economy Market by Waste Management (2018-2032)
4.1 Circular Economy Market Snapshot and Growth Engine
4.2 Market Overview
4.3 Electronic Waste
4.3.1 Introduction and Market Overview
4.3.2 Historic and Forecasted Market Size in Value USD and Volume Units
4.3.3 Key Market Trends, Growth Factors, and Opportunities
4.3.4 Geographic Segmentation Analysis
4.4 Food Waste
4.5 Plastic Recycling
4.6 Clothing & Textile
4.7 Wood Recycling
4.8 Glass Recycling
Chapter 5: Circular Economy Market by Industry (2018-2032)
5.1 Circular Economy Market Snapshot and Growth Engine
5.2 Market Overview
5.3 Textile
5.3.1 Introduction and Market Overview
5.3.2 Historic and Forecasted Market Size in Value USD and Volume Units
5.3.3 Key Market Trends, Growth Factors, and Opportunities
5.3.4 Geographic Segmentation Analysis
5.4 Construction
5.5 Automotive
5.6 Logistics
5.7 Furniture
5.8 Oil & Gas
Chapter 6: Company Profiles and Competitive Analysis
6.1 Competitive Landscape
6.1.1 Competitive Benchmarking
6.1.2 Circular Economy Market Share by Manufacturer (2024)
6.1.3 Industry BCG Matrix
6.1.4 Heat Map Analysis
6.1.5 Mergers and Acquisitions
6.2 ROCKWELL AUTOMATION INC. (USA)
6.2.1 Company Overview
6.2.2 Key Executives
6.2.3 Company Snapshot
6.2.4 Role of the Company in the Market
6.2.5 Sustainability and Social Responsibility
6.2.6 Operating Business Segments
6.2.7 Product Portfolio
6.2.8 Business Performance
6.2.9 Key Strategic Moves and Recent Developments
6.2.10 SWOT Analysis
6.3 EMERSON ELECTRIC CO. (USA)
6.4 PARKER HANNIFIN CORPORATION (USA)
6.5 TMEIC CORPORATION (USA)
6.6 ABB (SWITZERLAND)
6.7 SIEMENS AG (GERMANY)
6.8 INVERTEK DRIVES LTD. (UNITED KINGDOM)
6.9 CONTROL TECHNIQUES (NIDEC CORPORATION) (UNITED KINGDOM)
6.10 LENZE SE (GERMANY)
6.11 SCHNEIDER ELECTRIC SE (FRANCE)
6.12 BONFIGLIOLI RIDUTTORI S.P.A. (ITALY)
6.13 DANFOSS GROUP (DENMARK)
6.14 MITSUBISHI ELECTRIC CORPORATION (JAPAN)
6.15 EATON CORPORATION PLC (IRELAND)
6.16 YASKAWA ELECTRIC CORPORATION (JAPAN)
6.17 FUJI ELECTRIC COLTD. (JAPAN)
6.18 HITACHI LTD. (JAPAN)
6.19 NIDEC CORPORATION (JAPAN)
6.20 TOSHIBA CORPORATION (JAPAN)
6.21 DELTA ELECTRONICS INC. (TAIWAN)
6.22 VACON (NIDEC CORPORATION) (FINLAND)
6.23 HICONICS DRIVE TECHNOLOGY COLTD. (CHINA)
6.24 HYOSUNG HEAVY INDUSTRIES CORPORATION (SOUTH KOREA)
6.25 LS ELECTRIC (SOUTH KOREA)
6.26 WEG S.A. (BRAZIL)
Chapter 7: Global Circular Economy Market By Region
7.1 Overview
7.2. North America Circular Economy Market
7.2.1 Key Market Trends, Growth Factors and Opportunities
7.2.2 Top Key Companies
7.2.3 Historic and Forecasted Market Size by Segments
7.2.4 Historic and Forecasted Market Size by Waste Management
7.2.4.1 Electronic Waste
7.2.4.2 Food Waste
7.2.4.3 Plastic Recycling
7.2.4.4 Clothing & Textile
7.2.4.5 Wood Recycling
7.2.4.6 Glass Recycling
7.2.5 Historic and Forecasted Market Size by Industry
7.2.5.1 Textile
7.2.5.2 Construction
7.2.5.3 Automotive
7.2.5.4 Logistics
7.2.5.5 Furniture
7.2.5.6 Oil & Gas
7.2.6 Historic and Forecast Market Size by Country
7.2.6.1 US
7.2.6.2 Canada
7.2.6.3 Mexico
7.3. Eastern Europe Circular Economy Market
7.3.1 Key Market Trends, Growth Factors and Opportunities
7.3.2 Top Key Companies
7.3.3 Historic and Forecasted Market Size by Segments
7.3.4 Historic and Forecasted Market Size by Waste Management
7.3.4.1 Electronic Waste
7.3.4.2 Food Waste
7.3.4.3 Plastic Recycling
7.3.4.4 Clothing & Textile
7.3.4.5 Wood Recycling
7.3.4.6 Glass Recycling
7.3.5 Historic and Forecasted Market Size by Industry
7.3.5.1 Textile
7.3.5.2 Construction
7.3.5.3 Automotive
7.3.5.4 Logistics
7.3.5.5 Furniture
7.3.5.6 Oil & Gas
7.3.6 Historic and Forecast Market Size by Country
7.3.6.1 Russia
7.3.6.2 Bulgaria
7.3.6.3 The Czech Republic
7.3.6.4 Hungary
7.3.6.5 Poland
7.3.6.6 Romania
7.3.6.7 Rest of Eastern Europe
7.4. Western Europe Circular Economy Market
7.4.1 Key Market Trends, Growth Factors and Opportunities
7.4.2 Top Key Companies
7.4.3 Historic and Forecasted Market Size by Segments
7.4.4 Historic and Forecasted Market Size by Waste Management
7.4.4.1 Electronic Waste
7.4.4.2 Food Waste
7.4.4.3 Plastic Recycling
7.4.4.4 Clothing & Textile
7.4.4.5 Wood Recycling
7.4.4.6 Glass Recycling
7.4.5 Historic and Forecasted Market Size by Industry
7.4.5.1 Textile
7.4.5.2 Construction
7.4.5.3 Automotive
7.4.5.4 Logistics
7.4.5.5 Furniture
7.4.5.6 Oil & Gas
7.4.6 Historic and Forecast Market Size by Country
7.4.6.1 Germany
7.4.6.2 UK
7.4.6.3 France
7.4.6.4 The Netherlands
7.4.6.5 Italy
7.4.6.6 Spain
7.4.6.7 Rest of Western Europe
7.5. Asia Pacific Circular Economy Market
7.5.1 Key Market Trends, Growth Factors and Opportunities
7.5.2 Top Key Companies
7.5.3 Historic and Forecasted Market Size by Segments
7.5.4 Historic and Forecasted Market Size by Waste Management
7.5.4.1 Electronic Waste
7.5.4.2 Food Waste
7.5.4.3 Plastic Recycling
7.5.4.4 Clothing & Textile
7.5.4.5 Wood Recycling
7.5.4.6 Glass Recycling
7.5.5 Historic and Forecasted Market Size by Industry
7.5.5.1 Textile
7.5.5.2 Construction
7.5.5.3 Automotive
7.5.5.4 Logistics
7.5.5.5 Furniture
7.5.5.6 Oil & Gas
7.5.6 Historic and Forecast Market Size by Country
7.5.6.1 China
7.5.6.2 India
7.5.6.3 Japan
7.5.6.4 South Korea
7.5.6.5 Malaysia
7.5.6.6 Thailand
7.5.6.7 Vietnam
7.5.6.8 The Philippines
7.5.6.9 Australia
7.5.6.10 New Zealand
7.5.6.11 Rest of APAC
7.6. Middle East & Africa Circular Economy Market
7.6.1 Key Market Trends, Growth Factors and Opportunities
7.6.2 Top Key Companies
7.6.3 Historic and Forecasted Market Size by Segments
7.6.4 Historic and Forecasted Market Size by Waste Management
7.6.4.1 Electronic Waste
7.6.4.2 Food Waste
7.6.4.3 Plastic Recycling
7.6.4.4 Clothing & Textile
7.6.4.5 Wood Recycling
7.6.4.6 Glass Recycling
7.6.5 Historic and Forecasted Market Size by Industry
7.6.5.1 Textile
7.6.5.2 Construction
7.6.5.3 Automotive
7.6.5.4 Logistics
7.6.5.5 Furniture
7.6.5.6 Oil & Gas
7.6.6 Historic and Forecast Market Size by Country
7.6.6.1 Turkiye
7.6.6.2 Bahrain
7.6.6.3 Kuwait
7.6.6.4 Saudi Arabia
7.6.6.5 Qatar
7.6.6.6 UAE
7.6.6.7 Israel
7.6.6.8 South Africa
7.7. South America Circular Economy Market
7.7.1 Key Market Trends, Growth Factors and Opportunities
7.7.2 Top Key Companies
7.7.3 Historic and Forecasted Market Size by Segments
7.7.4 Historic and Forecasted Market Size by Waste Management
7.7.4.1 Electronic Waste
7.7.4.2 Food Waste
7.7.4.3 Plastic Recycling
7.7.4.4 Clothing & Textile
7.7.4.5 Wood Recycling
7.7.4.6 Glass Recycling
7.7.5 Historic and Forecasted Market Size by Industry
7.7.5.1 Textile
7.7.5.2 Construction
7.7.5.3 Automotive
7.7.5.4 Logistics
7.7.5.5 Furniture
7.7.5.6 Oil & Gas
7.7.6 Historic and Forecast Market Size by Country
7.7.6.1 Brazil
7.7.6.2 Argentina
7.7.6.3 Rest of SA
Chapter 8 Analyst Viewpoint and Conclusion
8.1 Recommendations and Concluding Analysis
8.2 Potential Market Strategies
Chapter 9 Research Methodology
9.1 Research Process
9.2 Primary Research
9.3 Secondary Research
|
Global Circular Economy Market |
|||
|
Base Year: |
2023 |
Forecast Period: |
2024-2032 |
|
Historical Data: |
2017 to 2022 |
Market Size in 2023: |
USD 3.1 Tr. |
|
Forecast Period 2024-32 CAGR: |
8.20% |
Market Size in 2032: |
USD 6.3 Tr. |
|
Segments Covered: |
By Waste Management |
|
|
|
By Industry |
|
||
|
By Region |
|
||
|
Key Market Drivers: |
|
||
|
Key Market Restraints: |
|
||
|
Key Opportunities: |
|
||
|
Companies Covered in the report: |
|
||
Frequently Asked Questions :
The forecast period in the Circular Economy Market research report is 2024-2032.
Covanta Holding Corporation, Hitachi Zosen Corporation, Suez Environment S.A Clean Harbors Inc, The Savola Group, IKEA Food, Remondis AG and Co. Kg, Waste Management Inc, Biffa Group, Daiseki Co. Ltd, Cisco, Levi Strauss, H&M Group, Advanced Disposal Services, Veolia Environment S.A, and Other Major Players.
The Circular Economy Market is segmented into Waste Management, Industry, and region. By Waste Management, the market is categorized into Electronic Waste, Food Waste, Plastic Recycling, Clothing & Textile, Wood Recycling, and Glass Recycling. By Industry, the market is categorized into Textile, Construction, Automotive, Logistics, Furniture, Oil & Gas. By region, it is analyzed across North America (U.S.; Canada; Mexico), Europe (Germany; U.K.; France; Italy; Russia; Spain, etc.), Asia-Pacific (China; India; Japan; Southeast Asia, etc.), South America (Brazil; Argentina, etc.), Middle East & Africa (Saudi Arabia; South Africa, etc.).
A circular economy, also known as circularity or CE, is a production and consumption model that prioritizes sharing, renting, reusing, repairing, and recycling already-existent goods and resources for as long as possible. By putting a focus on the design-based implementation of the model's three guiding principles, CE seeks to address issues including climate change, biodiversity loss, waste, and pollution.
Circular Economy Market Size Was Valued at USD 3.1 Trillion in 2023 and is Projected to Reach USD 6.3 Trillion by 2032, Growing at a CAGR of 8.20 % From 2024-2032.


