


Bridge IC Solutions Market Synopsis
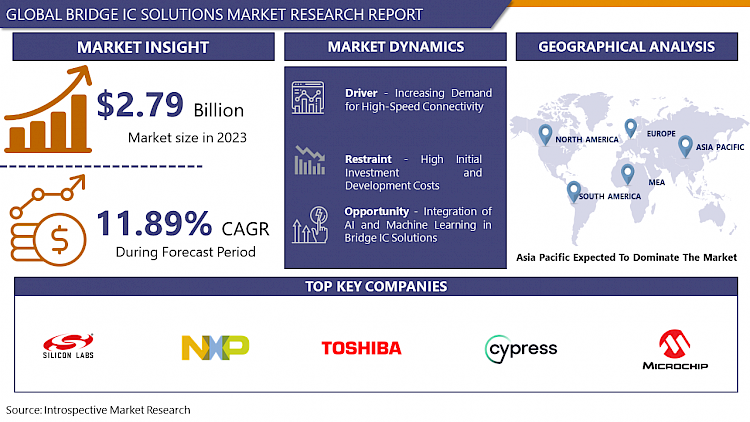
Bridge IC Solutions Market Size Was Valued at USD 2.50 Billion in 2022 and is Projected to Reach USD 5.90 Billion by 2030, Growing at a CAGR of 11.40% From 2023-2030.
Bridge IC Solutions refer to integrated circuits designed to facilitate seamless communication and interoperability between different electronic interfaces and protocols. These specialized chips act as bridges between various systems, converting signals from one format to another. Common applications include USB to UART, HDMI to DisplayPort, and Ethernet to USB bridges.
- Bridge IC Solutions plays a crucial role in enabling connectivity and compatibility across diverse devices and interfaces, fostering the integration of technologies in consumer electronics, automotive systems, industrial automation, and other sectors.
- Bridge IC Solutions are essential in modern electronics, offering advantages such as bridging diverse communication protocols and interfaces and promoting interoperability and connectivity in electronic devices. As the market integrates technologies in smart devices, automotive systems, and industrial applications, they facilitate continuous data exchange between components, enhancing system efficiency.
- The rising demand for high-speed data interfaces, such as HDMI, USB, and DisplayPort, is driven by the popularity of high-resolution displays and data-intensive applications. The proliferation of IoT devices and the Industry 4.0 standard further increases the demand for Bridge ICs. The increasing complexity of electronic systems necessitates effective communication across diverse components with varied interfaces. As industries embrace digital transformation and connectivity becomes a key focus, the Bridge IC Solutions market experiences strong growth, driven by their crucial role in ensuring seamless communication across various applications.
Bridge IC Solutions Market Trend Analysis
Increasing Demand for High-Speed Connectivity
- The Bridge IC Solutions Market is experiencing significant growth due to the growing demand for high-speed connectivity in the digital era. Bridge ICs facilitate the conversion and interoperability of various communication protocols, ensuring efficient data exchange. With the proliferation of technologies like 5G, USB Type-C, HDMI, and DisplayPort, consumers and industries seek faster and more reliable connectivity options.
- Bridge IC Solutions enables devices with different interfaces to communicate at elevated speeds, supporting the transfer of large volumes of data. This trend is particularly prominent in consumer electronics, automotive applications, and data centers, where the demand for high-speed connectivity is dominant.
Integration of AI and Machine Learning in Bridge IC Solutions
- The integration of Artificial Intelligence (AI) and Machine Learning (ML) in Bridge IC Solutions presents a significant opportunity in advanced connectivity solutions. These technologies enable Bridge ICs to dynamically adapt and optimize communication pathways by learning from usage patterns, enhancing efficiency, and minimizing latency. Predictive maintenance is also enabled, identifying potential communication issues before they occur, and enhancing reliability in applications like automotive systems, industrial automation, and data centers.
- AI and ML algorithms in Bridge IC Solutions enable real-time decision-making, optimizing data transfer routes and protocol conversions based on network conditions. This improves device performance and energy efficiency in data transmission. The integration aligns with intelligent connectivity trends, promoting a more responsive and intelligent communication infrastructure, and positioning Bridge IC Solutions at the forefront of innovation.
Bridge IC Solutions Market Segment Analysis:
Bridge IC Solutions Market Segmented based on Type, Function, Technology, and Technology.
By Type, USB Interface ICs segment is expected to dominate the market during the forecast period
- USB (Universal Serial Bus) has become a ubiquitous and standardized interface across a wide range of electronic devices, including computers, smartphones, audio devices, and peripherals. The versatility and widespread adoption of USB makes USB Interface ICs essential components for bridging different communication protocols, ensuring seamless connectivity, and supporting various applications.
- As the demand for high-speed data transfer continues to grow, USB Interface ICs play a crucial role in facilitating rapid and efficient communication between devices. The introduction of advanced USB standards, such as USB4 and USB Type-C, further amplifies the significance of this segment. USB Type-C, in particular, offers a reversible and versatile connector, driving its adoption in modern devices and contributing to the dominance of USB Interface ICs.
By Application, CMOS-Based segment held the largest share of 76.8% in 2022
- CMOS offers a convincing combination of low power consumption, high integration density, and cost-effectiveness, making it a preferred choice for manufacturing Bridge ICs. The energy efficiency of CMOS technology aligns with the growing demand for power-efficient electronic devices and systems across various applications, including consumer electronics, automotive, and industrial sectors.
- CMOS technology facilitates the integration of complex functionalities on a single chip, enabling the development of highly integrated Bridge IC Solutions that can efficiently manage diverse communication protocols. The scalability and compatibility of CMOS technology make it well-suited for addressing the evolving requirements of advanced connectivity solutions. As the demand for smart devices, IoT applications, and high-speed data transfer continues to rise, the CMOS-Based segment is positioned to dominate the Bridge IC Solutions market by offering a technologically robust and economically viable solution for diverse connectivity needs.
Bridge IC Solutions Market Regional Insights:
Asia Pacific is Expected to Dominate the Market Over the Forecast Period
- The Asia Pacific region is expected to dominate the Bridge IC Solutions market due to its position as a key player in semiconductor manufacturing and technology adoption. The region is home to leading semiconductor manufacturers, with established ecosystems in countries like Taiwan, South Korea, and China, contributing to the production of high-quality and cost-effective Bridge IC Solutions.
- The region is also experiencing significant growth in consumer electronics, automotive, and industrial sectors, which are key applications for Bridge ICs. The increasing demand for smart devices, IoT solutions, and high-speed connectivity in China and India further drives the adoption of Bridge IC Solutions. Government initiatives, smart cities, and Industry 4.0 initiatives further solidify Asia Pacific's dominance.
Bridge IC Solutions Market Top Key Players:
- Silicon Labs (US)
- Microchip (US)
- TI (US)
- Cypress (US)
- MaxLinear (US)
- Broadcom (US)
- FTDI (UK)
- NXP (Netherlands)
- Fujitsu (Japan)
- Toshiba (Japan)
- JMicron Technology (Taiwan)
- Silicon Motion (Taiwan)
- ASMedia Technology (Taiwan)
- Initio Corporation (Taiwan)
- ASIX (Taiwan)
- Holtek (Taiwan), and other Major Players
Key Industry Developments in the Bridge IC Solutions Market:
- In September 2023, GlobalFoundries® and Microchip jointly launched Microchip's 28-nm SuperFlash® Embedded Flash Memory Solution, marking the immediate release to production of the SST ESF3 third-generation embedded SuperFlash technology NVM solution. This widely deployed Non-Volatile Memory (NVM) solution is specifically optimized for microcontrollers (MCUs), smart cards, and IoT chips.
- In August 2023, TSMC, Bosch, Infineon, and NXP formed a partnership in order to bring advanced semiconductor manufacturing to Europe. ESMC represents a significant step towards the construction of a 300mm fab to support the future capacity needs of the fast-growing automotive and industrial sectors, with the final investment decision pending confirmation of the level of public funding for this project.
|
Global Bridge IC Solutions Market |
|||
|
Base Year: |
2022 |
Forecast Period: |
2023-2030 |
|
Historical Data: |
2017 to 2022 |
Market Size in 2022: |
USD 2.50 Bn. |
|
Forecast Period 2023-30 CAGR: |
11.40 % |
Market Size in 2030: |
USD 5.90 Bn. |
|
Segments Covered: |
By Type |
|
|
|
By Function |
|
||
|
By Technology |
|
||
|
By Application |
|
||
|
By Region |
|
||
|
Key Market Drivers: |
|
||
|
Key Market Restraints: |
|
||
|
Key Opportunities: |
|
||
|
Companies Covered in the report: |
|
||
- INTRODUCTION
- RESEARCH OBJECTIVES
- RESEARCH METHODOLOGY
- RESEARCH PROCESS
- SCOPE AND COVERAGE
- Market Definition
- Key Questions Answered
- MARKET SEGMENTATION
- EXECUTIVE SUMMARY
- MARKET OVERVIEW
- GROWTH OPPORTUNITIES BY SEGMENT
- MARKET LANDSCAPE
- PORTER’S FIVE FORCES ANALYSIS
- Bargaining Power Of Supplier
- Threat Of New Entrants
- Threat Of Substitutes
- Competitive Rivalry
- Bargaining Power Among Buyers
- INDUSTRY VALUE CHAIN ANALYSIS
- MARKET DYNAMICS
- Drivers
- Restraints
- Opportunities
- Challenges
- MARKET TREND ANALYSIS
- REGULATORY LANDSCAPE
- PESTLE ANALYSIS
- PRICE TREND ANALYSIS
- PATENT ANALYSIS
- TECHNOLOGY EVALUATION
- MARKET IMPACT OF THE RUSSIA-UKRAINE WAR
- Geopolitical Market Disruptions
- Supply Chain Disruptions
- Instability in Emerging Markets
- ECOSYSTEM
- PORTER’S FIVE FORCES ANALYSIS
- BRIDGE IC SOLUTIONS MARKET BY TYPE (2017-2030)
- BRIDGE IC SOLUTIONS MARKET SNAPSHOT AND GROWTH ENGINE
- MARKET OVERVIEW
- USB INTERFACE ICS
- Introduction And Market Overview
- Historic And Forecasted Market Size in Value (2017 – 2030F)
- Historic And Forecasted Market Size in Volume (2017 – 2030F)
- Key Market Trends, Growth Factors And Opportunities
- Geographic Segmentation Analysis
- PCI/PCIE INTERFACE ICS
- SATA INTERFACE ICS
- BRIDGE IC SOLUTIONS MARKET BY FUNCTION (2017-2030)
- BRIDGE IC SOLUTIONS MARKET SNAPSHOT AND GROWTH ENGINE
- MARKET OVERVIEW
- INTERFACE BRIDGES
- Introduction And Market Overview
- Historic And Forecasted Market Size in Value (2017 – 2030F)
- Historic And Forecasted Market Size in Volume (2017 – 2030F)
- Key Market Trends, Growth Factors And Opportunities
- Geographic Segmentation Analysis
- SENSOR FUSION BRIDGES
- POWER MANAGEMENT BRIDGES
- CONNECTIVITY BRIDGES
- BRIDGE IC SOLUTIONS MARKET BY TECHNOLOGY (2017-2030)
- BRIDGE IC SOLUTIONS MARKET SNAPSHOT AND GROWTH ENGINE
- MARKET OVERVIEW
- CMOS-BASED
- Introduction And Market Overview
- Historic And Forecasted Market Size in Value (2017 – 2030F)
- Historic And Forecasted Market Size in Volume (2017 – 2030F)
- Key Market Trends, Growth Factors And Opportunities
- Geographic Segmentation Analysis
- BICMOS-BASED
- BRIDGE IC SOLUTIONS MARKET BY APPLICATION (2017-2030)
- BRIDGE IC SOLUTIONS MARKET SNAPSHOT AND GROWTH ENGINE
- MARKET OVERVIEW
- COMMUNICATION
- Introduction And Market Overview
- Historic And Forecasted Market Size in Value (2017 – 2030F)
- Historic And Forecasted Market Size in Volume (2017 – 2030F)
- Key Market Trends, Growth Factors And Opportunities
- Geographic Segmentation Analysis
- INDUSTRIAL
- HEALTHCARE
- AUTOMOBILE
- CONSUMER ELECTRONIC
- COMPANY PROFILES AND COMPETITIVE ANALYSIS
- COMPETITIVE LANDSCAPE
- Competitive Positioning
- Bridge IC Solutions Market Share By Manufacturer (2022)
- Industry BCG Matrix
- Heat Map Analysis
- Mergers & Acquisitions
- SILICON LABS (US)
- Company Overview
- Key Executives
- Company Snapshot
- Role of the Company in the Market
- Sustainability and Social Responsibility
- Operating Business Segments
- Product Portfolio
- Business Performance (Production Volume, Sales Volume, Sales Margin, Production Capacity, Capacity Utilization Rate)
- Key Strategic Moves And Recent Developments
- SWOT Analysis
- MICROCHIP (US)
- TI (US)
- CYPRESS (US)
- MAXLINEAR (US)
- BROADCOM (US)
- FTDI (UK)
- NXP (NETHERLANDS)
- FUJITSU (JAPAN)
- TOSHIBA (JAPAN)
- JMICRON TECHNOLOGY (TAIWAN)
- SILICON MOTION (TAIWAN)
- ASMEDIA TECHNOLOGY (TAIWAN)
- INITIO CORPORATION (TAIWAN)
- ASIX (TAIWAN)
- HOLTEK (TAIWAN)
- COMPETITIVE LANDSCAPE
- GLOBAL BRIDGE IC SOLUTIONS MARKET BY REGION
- OVERVIEW
- NORTH AMERICA
- Key Market Trends, Growth Factors And Opportunities
- Key Manufacturers
- Historic And Forecasted Market Size By Type
- Historic And Forecasted Market Size By Function
- Historic And Forecasted Market Size By Technology
- Historic And Forecasted Market Size By Application
- Historic And Forecasted Market Size By Country
- USA
- Canada
- Mexico
- EASTERN EUROPE
- Key Market Trends, Growth Factors And Opportunities
- Key Manufacturers
- Historic And Forecasted Market Size By Segments
- Historic And Forecasted Market Size By Country
- Russia
- Bulgaria
- The Czech Republic
- Hungary
- Poland
- Romania
- Rest Of Eastern Europe
- WESTERN EUROPE
- Key Market Trends, Growth Factors And Opportunities
- Key Manufacturers
- Historic And Forecasted Market Size By Segments
- Historic And Forecasted Market Size By Country
- Germany
- United Kingdom
- France
- The Netherlands
- Italy
- Spain
- Rest Of Western Europe
- ASIA PACIFIC
- Key Market Trends, Growth Factors And Opportunities
- Key Manufacturers
- Historic And Forecasted Market Size By Segments
- Historic And Forecasted Market Size By Country
- China
- India
- Japan
- South Korea
- Malaysia
- Thailand
- Vietnam
- The Philippines
- Australia
- New-Zealand
- Rest Of APAC
- MIDDLE EAST & AFRICA
- Key Market Trends, Growth Factors And Opportunities
- Key Manufacturers
- Historic And Forecasted Market Size By Segments
- Historic And Forecasted Market Size By Country
- Turkey
- Bahrain
- Kuwait
- Saudi Arabia
- Qatar
- UAE
- Israel
- South Africa
- SOUTH AMERICA
- Key Market Trends, Growth Factors And Opportunities
- Key Manufacturers
- Historic And Forecasted Market Size By Segments
- Historic And Forecasted Market Size By Country
- Brazil
- Argentina
- Rest of South America
- INVESTMENT ANALYSIS
- ANALYST VIEWPOINT AND CONCLUSION
- Recommendations and Concluding Analysis
- Potential Market Strategies
|
Global Bridge IC Solutions Market |
|||
|
Base Year: |
2022 |
Forecast Period: |
2023-2030 |
|
Historical Data: |
2017 to 2022 |
Market Size in 2022: |
USD 2.50 Bn. |
|
Forecast Period 2023-30 CAGR: |
11.40 % |
Market Size in 2030: |
USD 5.90 Bn. |
|
Segments Covered: |
By Type |
|
|
|
By Function |
|
||
|
By Technology |
|
||
|
By Application |
|
||
|
By Region |
|
||
|
Key Market Drivers: |
|
||
|
Key Market Restraints: |
|
||
|
Key Opportunities: |
|
||
|
Companies Covered in the report: |
|
||
LIST OF TABLES
TABLE 001. EXECUTIVE SUMMARY
TABLE 002. BRIDGE IC SOLUTIONS MARKET BARGAINING POWER OF SUPPLIERS
TABLE 003. BRIDGE IC SOLUTIONS MARKET BARGAINING POWER OF CUSTOMERS
TABLE 004. BRIDGE IC SOLUTIONS MARKET COMPETITIVE RIVALRY
TABLE 005. BRIDGE IC SOLUTIONS MARKET THREAT OF NEW ENTRANTS
TABLE 006. BRIDGE IC SOLUTIONS MARKET THREAT OF SUBSTITUTES
TABLE 007. BRIDGE IC SOLUTIONS MARKET BY TYPE
TABLE 008. USB INTERFACE IC MARKET OVERVIEW (2016-2028)
TABLE 009. PCI/PCIE INTERFACE IC MARKET OVERVIEW (2016-2028)
TABLE 010. SATA INTERFACE IC MARKET OVERVIEW (2016-2028)
TABLE 011. OTHERS MARKET OVERVIEW (2016-2028)
TABLE 012. BRIDGE IC SOLUTIONS MARKET BY APPLICATION
TABLE 013. COMMUNICATION MARKET OVERVIEW (2016-2028)
TABLE 014. INDUSTRIAL MARKET OVERVIEW (2016-2028)
TABLE 015. HEALTHCARE MARKET OVERVIEW (2016-2028)
TABLE 016. CONSUMER ELECTRONIC MARKET OVERVIEW (2016-2028)
TABLE 017. AUTOMOBILE MARKET OVERVIEW (2016-2028)
TABLE 018. OTHERS MARKET OVERVIEW (2016-2028)
TABLE 019. NORTH AMERICA BRIDGE IC SOLUTIONS MARKET, BY TYPE (2016-2028)
TABLE 020. NORTH AMERICA BRIDGE IC SOLUTIONS MARKET, BY APPLICATION (2016-2028)
TABLE 021. N BRIDGE IC SOLUTIONS MARKET, BY COUNTRY (2016-2028)
TABLE 022. EUROPE BRIDGE IC SOLUTIONS MARKET, BY TYPE (2016-2028)
TABLE 023. EUROPE BRIDGE IC SOLUTIONS MARKET, BY APPLICATION (2016-2028)
TABLE 024. BRIDGE IC SOLUTIONS MARKET, BY COUNTRY (2016-2028)
TABLE 025. ASIA PACIFIC BRIDGE IC SOLUTIONS MARKET, BY TYPE (2016-2028)
TABLE 026. ASIA PACIFIC BRIDGE IC SOLUTIONS MARKET, BY APPLICATION (2016-2028)
TABLE 027. BRIDGE IC SOLUTIONS MARKET, BY COUNTRY (2016-2028)
TABLE 028. MIDDLE EAST & AFRICA BRIDGE IC SOLUTIONS MARKET, BY TYPE (2016-2028)
TABLE 029. MIDDLE EAST & AFRICA BRIDGE IC SOLUTIONS MARKET, BY APPLICATION (2016-2028)
TABLE 030. BRIDGE IC SOLUTIONS MARKET, BY COUNTRY (2016-2028)
TABLE 031. SOUTH AMERICA BRIDGE IC SOLUTIONS MARKET, BY TYPE (2016-2028)
TABLE 032. SOUTH AMERICA BRIDGE IC SOLUTIONS MARKET, BY APPLICATION (2016-2028)
TABLE 033. BRIDGE IC SOLUTIONS MARKET, BY COUNTRY (2016-2028)
TABLE 034. FTDI: SNAPSHOT
TABLE 035. FTDI: BUSINESS PERFORMANCE
TABLE 036. FTDI: PRODUCT PORTFOLIO
TABLE 037. FTDI: KEY STRATEGIC MOVES AND DEVELOPMENTS
TABLE 037. SILICON LABS: SNAPSHOT
TABLE 038. SILICON LABS: BUSINESS PERFORMANCE
TABLE 039. SILICON LABS: PRODUCT PORTFOLIO
TABLE 040. SILICON LABS: KEY STRATEGIC MOVES AND DEVELOPMENTS
TABLE 040. JMICRON TECHNOLOGY: SNAPSHOT
TABLE 041. JMICRON TECHNOLOGY: BUSINESS PERFORMANCE
TABLE 042. JMICRON TECHNOLOGY: PRODUCT PORTFOLIO
TABLE 043. JMICRON TECHNOLOGY: KEY STRATEGIC MOVES AND DEVELOPMENTS
TABLE 043. FUJITSU: SNAPSHOT
TABLE 044. FUJITSU: BUSINESS PERFORMANCE
TABLE 045. FUJITSU: PRODUCT PORTFOLIO
TABLE 046. FUJITSU: KEY STRATEGIC MOVES AND DEVELOPMENTS
TABLE 046. MICROCHIP: SNAPSHOT
TABLE 047. MICROCHIP: BUSINESS PERFORMANCE
TABLE 048. MICROCHIP: PRODUCT PORTFOLIO
TABLE 049. MICROCHIP: KEY STRATEGIC MOVES AND DEVELOPMENTS
TABLE 049. TOSHIBA: SNAPSHOT
TABLE 050. TOSHIBA: BUSINESS PERFORMANCE
TABLE 051. TOSHIBA: PRODUCT PORTFOLIO
TABLE 052. TOSHIBA: KEY STRATEGIC MOVES AND DEVELOPMENTS
TABLE 052. NXP: SNAPSHOT
TABLE 053. NXP: BUSINESS PERFORMANCE
TABLE 054. NXP: PRODUCT PORTFOLIO
TABLE 055. NXP: KEY STRATEGIC MOVES AND DEVELOPMENTS
TABLE 055. SILICON MOTION: SNAPSHOT
TABLE 056. SILICON MOTION: BUSINESS PERFORMANCE
TABLE 057. SILICON MOTION: PRODUCT PORTFOLIO
TABLE 058. SILICON MOTION: KEY STRATEGIC MOVES AND DEVELOPMENTS
TABLE 058. TI: SNAPSHOT
TABLE 059. TI: BUSINESS PERFORMANCE
TABLE 060. TI: PRODUCT PORTFOLIO
TABLE 061. TI: KEY STRATEGIC MOVES AND DEVELOPMENTS
TABLE 061. ASMEDIA TECHNOLOGY: SNAPSHOT
TABLE 062. ASMEDIA TECHNOLOGY: BUSINESS PERFORMANCE
TABLE 063. ASMEDIA TECHNOLOGY: PRODUCT PORTFOLIO
TABLE 064. ASMEDIA TECHNOLOGY: KEY STRATEGIC MOVES AND DEVELOPMENTS
TABLE 064. CYPRESS: SNAPSHOT
TABLE 065. CYPRESS: BUSINESS PERFORMANCE
TABLE 066. CYPRESS: PRODUCT PORTFOLIO
TABLE 067. CYPRESS: KEY STRATEGIC MOVES AND DEVELOPMENTS
TABLE 067. MAXLINEAR: SNAPSHOT
TABLE 068. MAXLINEAR: BUSINESS PERFORMANCE
TABLE 069. MAXLINEAR: PRODUCT PORTFOLIO
TABLE 070. MAXLINEAR: KEY STRATEGIC MOVES AND DEVELOPMENTS
TABLE 070. BROADCOM: SNAPSHOT
TABLE 071. BROADCOM: BUSINESS PERFORMANCE
TABLE 072. BROADCOM: PRODUCT PORTFOLIO
TABLE 073. BROADCOM: KEY STRATEGIC MOVES AND DEVELOPMENTS
TABLE 073. INITIO CORPORATION: SNAPSHOT
TABLE 074. INITIO CORPORATION: BUSINESS PERFORMANCE
TABLE 075. INITIO CORPORATION: PRODUCT PORTFOLIO
TABLE 076. INITIO CORPORATION: KEY STRATEGIC MOVES AND DEVELOPMENTS
TABLE 076. ASIX: SNAPSHOT
TABLE 077. ASIX: BUSINESS PERFORMANCE
TABLE 078. ASIX: PRODUCT PORTFOLIO
TABLE 079. ASIX: KEY STRATEGIC MOVES AND DEVELOPMENTS
TABLE 079. HOLTEK: SNAPSHOT
TABLE 080. HOLTEK: BUSINESS PERFORMANCE
TABLE 081. HOLTEK: PRODUCT PORTFOLIO
TABLE 082. HOLTEK: KEY STRATEGIC MOVES AND DEVELOPMENTS
LIST OF FIGURES
FIGURE 001. YEARS CONSIDERED FOR ANALYSIS
FIGURE 002. SCOPE OF THE STUDY
FIGURE 003. BRIDGE IC SOLUTIONS MARKET OVERVIEW BY REGIONS
FIGURE 004. PORTER'S FIVE FORCES ANALYSIS
FIGURE 005. BARGAINING POWER OF SUPPLIERS
FIGURE 006. COMPETITIVE RIVALRYFIGURE 007. THREAT OF NEW ENTRANTS
FIGURE 008. THREAT OF SUBSTITUTES
FIGURE 009. VALUE CHAIN ANALYSIS
FIGURE 010. PESTLE ANALYSIS
FIGURE 011. BRIDGE IC SOLUTIONS MARKET OVERVIEW BY TYPE
FIGURE 012. USB INTERFACE IC MARKET OVERVIEW (2016-2028)
FIGURE 013. PCI/PCIE INTERFACE IC MARKET OVERVIEW (2016-2028)
FIGURE 014. SATA INTERFACE IC MARKET OVERVIEW (2016-2028)
FIGURE 015. OTHERS MARKET OVERVIEW (2016-2028)
FIGURE 016. BRIDGE IC SOLUTIONS MARKET OVERVIEW BY APPLICATION
FIGURE 017. COMMUNICATION MARKET OVERVIEW (2016-2028)
FIGURE 018. INDUSTRIAL MARKET OVERVIEW (2016-2028)
FIGURE 019. HEALTHCARE MARKET OVERVIEW (2016-2028)
FIGURE 020. CONSUMER ELECTRONIC MARKET OVERVIEW (2016-2028)
FIGURE 021. AUTOMOBILE MARKET OVERVIEW (2016-2028)
FIGURE 022. OTHERS MARKET OVERVIEW (2016-2028)
FIGURE 023. NORTH AMERICA BRIDGE IC SOLUTIONS MARKET OVERVIEW BY COUNTRY (2016-2028)
FIGURE 024. EUROPE BRIDGE IC SOLUTIONS MARKET OVERVIEW BY COUNTRY (2016-2028)
FIGURE 025. ASIA PACIFIC BRIDGE IC SOLUTIONS MARKET OVERVIEW BY COUNTRY (2016-2028)
FIGURE 026. MIDDLE EAST & AFRICA BRIDGE IC SOLUTIONS MARKET OVERVIEW BY COUNTRY (2016-2028)
FIGURE 027. SOUTH AMERICA BRIDGE IC SOLUTIONS MARKET OVERVIEW BY COUNTRY (2016-2028)
Frequently Asked Questions :
The forecast period in the Bridge IC Solutions Market research report is 2023-2030.
Silicon Labs (US), Microchip (US), TI (US), Cypress (US), MaxLinear (US), Broadcom (US), FTDI (UK), NXP (Netherlands), Fujitsu (Japan), Toshiba (Japan), JMicron Technology (Taiwan), Silicon Motion (Taiwan), ASMedia Technology (Taiwan), Initio Corporation (Taiwan), ASIX (Taiwan), Holtek (Taiwan) and Other Major Players.
The Bridge IC Solutions Market is segmented into Type, Function, Technology, Application, and region. By Type, the market is categorized into USB Interface ICs, PCI/PCIe Interface ICs, and SATA Interface ICs. By Function, the market is categorized into Interface Bridges, Sensor Fusion Bridges, Power Management Bridges, and Connectivity Bridges. By Technology, the market is categorized into CMOS-Based, and BiCMOS-Based. By Application, the market is categorized into Communication, Industrial, Healthcare, Automobile, and Consumer Electronic. By region, it is analyzed across North America (U.S.; Canada; Mexico), Eastern Europe (Bulgaria; The Czech Republic; Hungary; Poland; Romania; Rest of Eastern Europe), Western Europe (Germany; UK; France; Netherlands; Italy; Russia; Spain; Rest of Western Europe), Asia-Pacific (China; India; Japan; Southeast Asia, etc.), South America (Brazil; Argentina, etc.), Middle East & Africa (Saudi Arabia; South Africa, etc.).
Bridge IC Solutions refer to integrated circuits designed to facilitate seamless communication and interoperability between different electronic interfaces and protocols. These specialized chips act as bridges between various systems, converting signals from one format to another. Common applications include USB to UART, HDMI to DisplayPort, and Ethernet to USB bridges.
Bridge IC Solutions Market Size Was Valued at USD 2.50 Billion in 2022 and is Projected to Reach USD 5.90 Billion by 2030, Growing at a CAGR of 11.40% From 2023-2030.


