


Biostimulants Market Synopsis
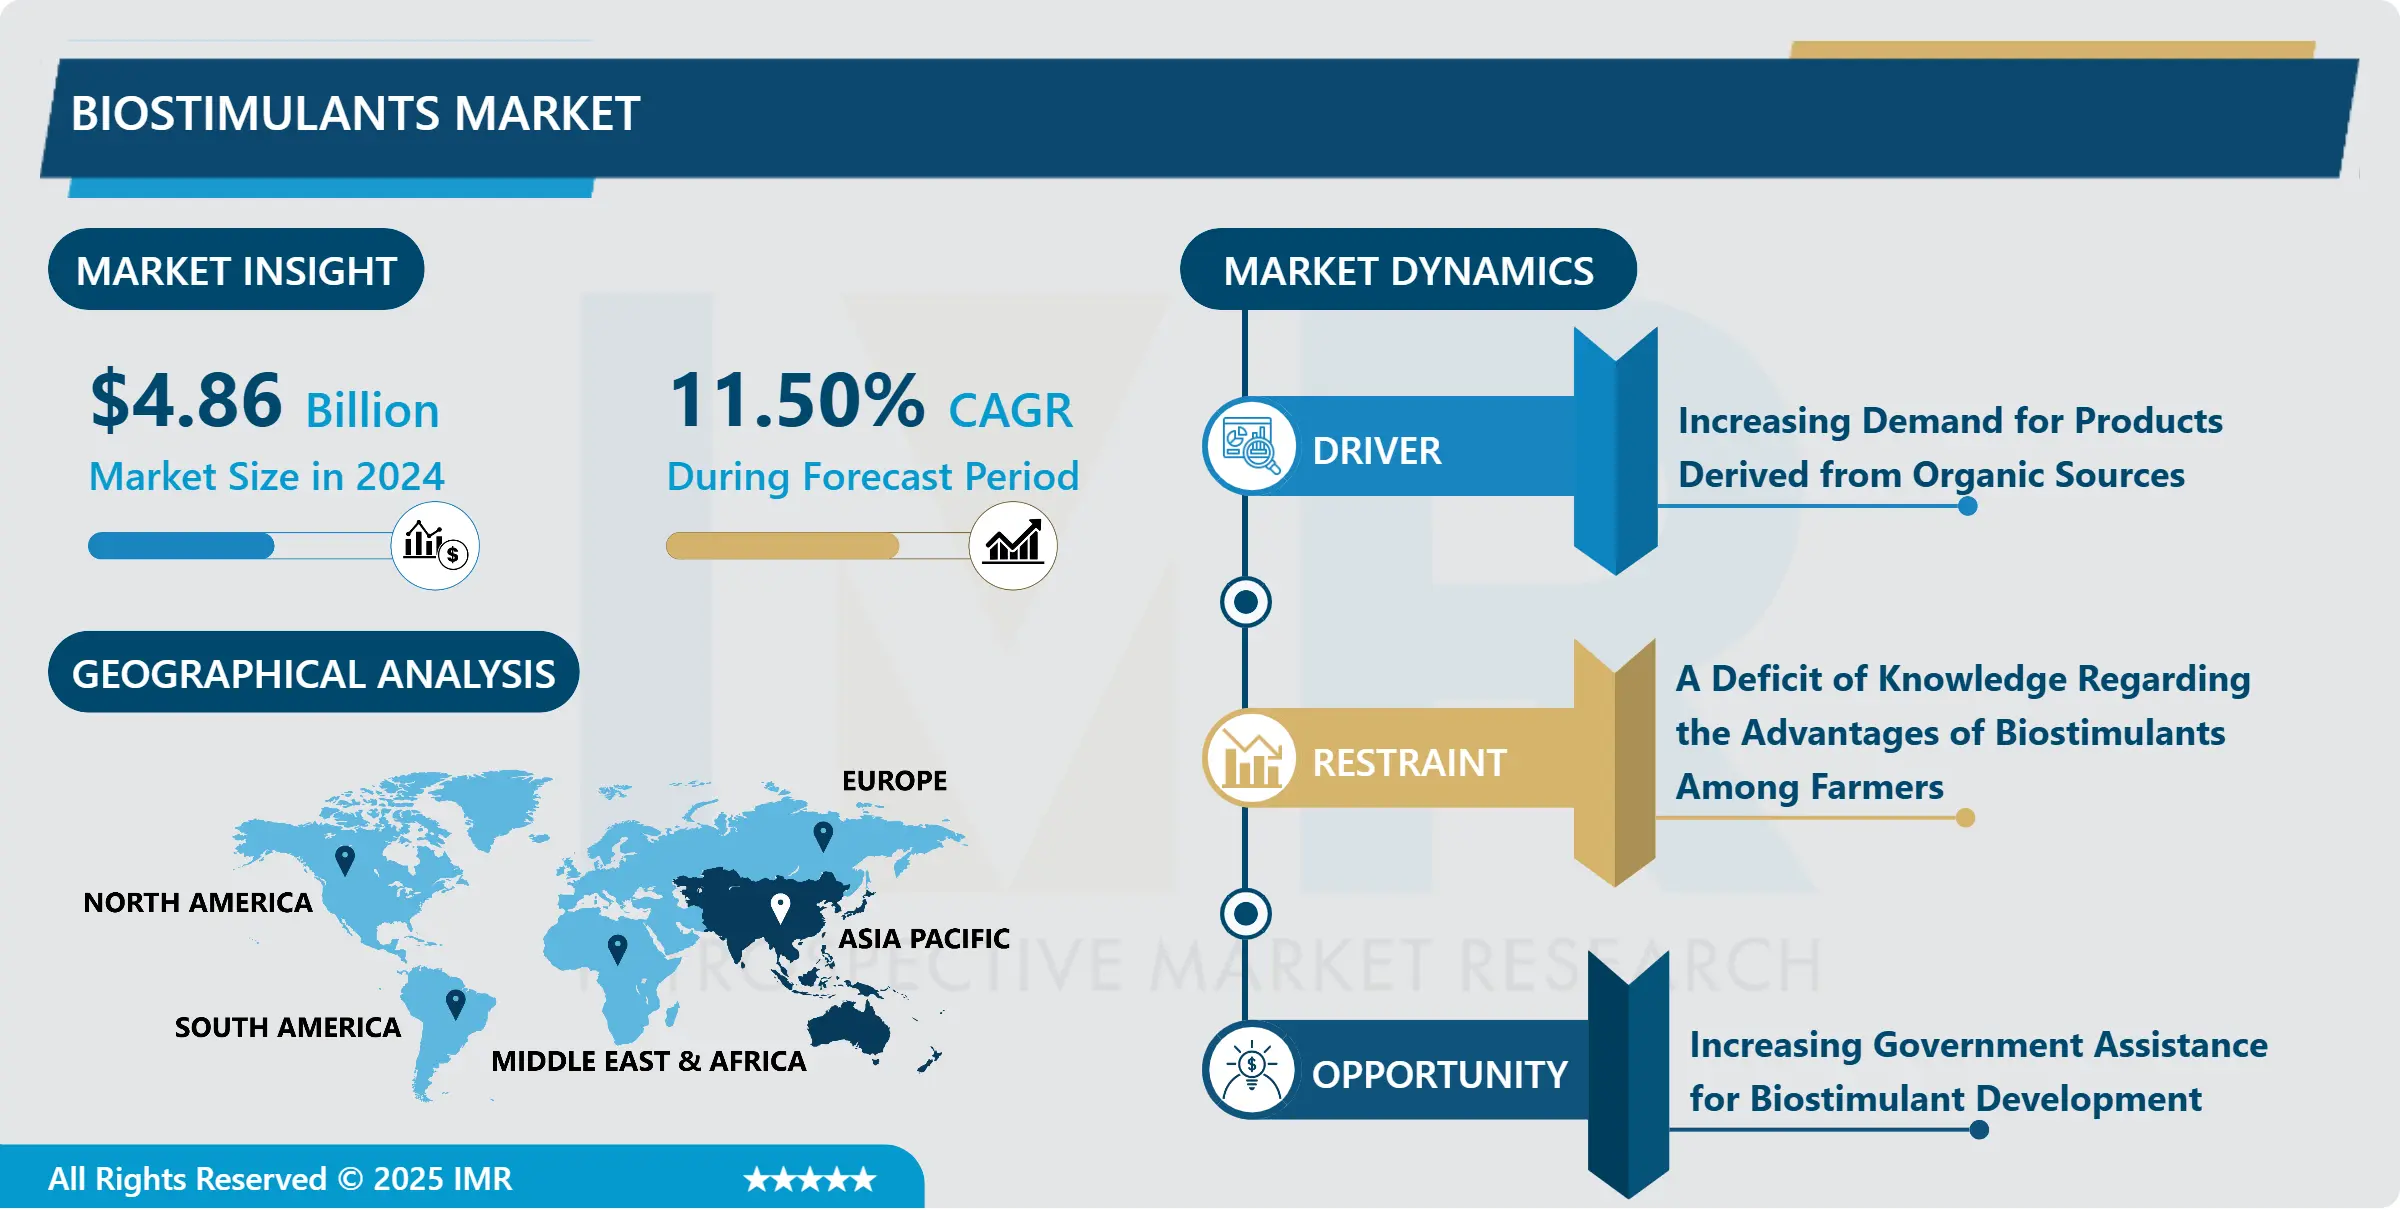
Biostimulants Market Size is Valued at USD 4.86 Billion in 2024, and is Projected to Reach USD 11.61 Billion by 2032, Growing at a CAGR of 11.50% From 2025-2032.
Products and microorganisms that are applied to plants or substrate with the objective to improve and boost all forms of plant growth and vigor fall under the description of Biostimulants. These are altogether different from fertilizers as these benefit the plants in areas that are physiological involving nutrient use and stress protection among others. This is due to the promoting need to incorporate sustainable agriculture practices in the market and enhance crop production. The level of regulatory standards regarding the establishment of business and innovation of products is another determinative aspect with regard to development and uptake.
Biostimulants have found their major uses in making the crop yield and quality better the growth in sustainable agriculture is the major driver for the biostimulants market. In a bid to find more environmentally sustainable ways of using agri-inputs to promote crop fertility, farmers are increasingly exploring biostimulants. Moreover, consumer consciousness about food hygiene and biodegradable soil management techniques that exist in traditional agriculture also includes higher demand for biostimulants.
Therefore, the emphasis on sustainable agriculture practices also helped in developing more trustworthy policies from the government side and increased the market growth. These regulations tend to incentivise the use of biostimulants such as through subsidies which would incorporate farmers purchase into the policy. More so, new technology like the biotechnology as well as microbiology has bring in new biostimulant products that in one way or the other have greater efficacy and sustainability hence enhancing the growth of the market.
Biostimulants Market Trend Analysis
Growing Demand for Biostimulants, Enhancing Sustainable Agriculture Practices for Better Crop Yield and Quality
- In the present period the use of biostimulants is on the rise due to rising demand in sustainable agriculture has boosted the global market of biostimulants due to need for better yield and quality of crops. Kroggel examines how biostimulants are growing in popularity as they contribute to improving nutrient efficiency, stress management, and plant growth. This has been fueled by increasing practice of organic farming in production and increasing legal measures in banning the use of chemical fertilizer. In addition, factors such as innovations in production techniques concerning biostimulants and booming awareness among farmers about the efficacy of biostimulants also contribute to the overall market growth.
- The global biostimulants market will also likely to move up in the future and definite business prospects are in the crossways of growth by introducing new forms of biostimulant products and increase the market share in the emerging countries. Nonetheless, there are factors that could somewhat negatively impact the growth of the market and they include inadequate regulatory understanding coupled with high product cost of biostimulant. All in all, the biostimulants are expected to keep on thriving by healthier agricultural practices and the more pressing the need for improved foods and crops.
Cultivating Success, The Rise of Biostimulants in Modern Agriculture
- The use of biostimulants in agriculture has created more opportunities that can be capitalized for growth and development, especially in the current world where environmental conservation while producing food is being encouraged through sustainable farming practices. Biostimulants are defined as preparations aimed at activating and stimulating the natural processes of plants or the soil, specifically, mainly, or exclusively to promote better nutrient uptake, crop quality, or tolerance to abiotic stress. Increasing population and demand for the improvement in the agricultural productivity without harming the environment, biostimulants can be a viable option.
- Some of the drivers that have led to the positive growth outlook of the biostimulants market include the innovation in the field of biotechnology, the growing perception of forth-management amongst farmers, and the strengthened nature of policies that support the development of environmentally friendly agribusiness inputs. Bio-based is an emerging market in agriculture to reduce chemical inputs in the market, where the market is also growing. Therefore, there are opportunities for farmers and agribusinesses to include biostimulants in their activities indicating that this market will continue to attract corporations willing to invest in the production of these inputs.
Biostimulants Market Segment Analysis:
Bio stimulants Market is segmented on the basis of Active ingredients, Source, Crop Type, Application, Form, and Region
By Active Ingredients, Vitamins segment is expected to dominate the market during the forecast period
- The biostimulants are made of different components and they are subdivided in accordance with their contents. One popular type is the humic substance-a group of organic compounds produced by plant matter decaying. Because of their nature and function, these substances aid in structuring the soil, enhancing nutrient holding capacity, and stimulating microbial growth to enable improved stress tolerance and plant growth.
- Other key nutrient groups comprise vitamins, molecules that fulfill important functions in regulating growth as well as other metabolic activities within plant organisms. They can improve the quality and vigor of the plants; they can improve productivity plus the plants’ performance even under unfavourable conditions. They also incorporate amino acids as other parts of biostimulants, amino acids are the basic structures of proteins and are involved in a number of physiological processes including nutrient transport and enzyme regulation.
- Seaweed extract is another common ingredient in such stmulants, containing nutrients, hormones, and other biologically active substances that contribute to growth and development of plants. Composts & microbial agents: application of efficacious beneficial bacteria and fungi’s help in improving the health of soil & nutrient uptake thereby; facilitating plant growth.
- Other introduced within biostimulants can be hormones, enzymes, and complex organic matters. These nutrients all contribute in their own way to helping plants grow better, healthier, and more disease-resistant, which points to the vast number of biostimulant products in the market for farmers.
By Application, Foliar spray segment held the largest share in 2024
- The essentially of using Biostimulants is done through various methods with different application hat has distinct value. In shock application technique, important combination of biostimulant is sprayed on the leaves of the plants A familiar use of biostimulants comes in the foliar application where the biostimulants solution is applied directly to the foliage of the plants. This ensures that plants undergo fast nutrient and bioactive compound absorption enhancing immediate growth and stress alleviation.
- Another practical approach for biostimulants application is soil treatment, during which the substances under consideration are mixed with the soil. This method is also useful in the improvement of soil health, and the promotion of nutrient cycling and microbial action, which will in turn improve plant growth and yield.
- Seed coating involves the use of biostimulant on seeds before planting. To explain the above two phrases, we take a look at the following definitions: They encourage early germination and seedling growth to originate a healthy root system and produce improved plant vigor; therefore, better land establishment and yield capacity.
- Application method for fertilizer is specific to plant crop type, crop growth stage, outcome expected based on the previous point. To get the best results of biostimulants farmers sometimes apply more than one method in the course of their farming practices.
Biostimulants Market Regional Insights:
Asia Pacific is Expected to Dominate the Market Over the Forecast period
- Continued advancement of sustainable ecosystems in agricultural practices and growing concerns over health issues and the consumption of food produced that has been chemically enhanced has led to the Asia Pacific biostimulants market to grow at a very fast pace. Region wise, Asia Pacific is dominating the organic farming market due to high farm land area in China and India and active government support for utilization of organic products. Also the growing consciousness among farmers for the uses of biostimulants, the increase in yield as well as the quality of the co-products is driving the market. The variation of climate and various types of soil used in the region also play a major role in biostimulants market growth as this input are known to reduce the impacts of biotic and abiotic stresses in plants.
- In addition, the growing concerns from the governments and agencies of Asia Pacific to minimize the consumption of chemical fertilizers and the change in the trend towards the use of bio and environmentally friendly agro-products are expected to promote the market of biostimulants in Asia Pacific region. Players involved are putting emphasis on sorting out new products through research to suit the conditions of crops in the region and farming techniques. Positive changes in legislation urging farmers to support sustainable agriculture and increasing demand from farmers to switch to biostimulants as part of long-term strategy are expected to drive market growth in the nearest future.
Active Key Players in the Biostimulants Market
- AlgaEnergy (Spain)
- BASF SE (Germany)
- Bayer Crop Science’s (Germany)
- Biostadt India Ltd. (India)
- Italpollina SAP
- Koppert B.V. (Netherlands)
- Lallemand (Canada)
- Novozymes A/S. (Denmark)
- Platform Product Specialty Corporation (US)
- Sapec Group (Belgium)
- Syngenta (Switzerland)
- UPL (India)
- Valagro (Italy)
- Other Active Players.
Key Industry Developments in the Biostimulants Market:
- In March 2024, UPM Biochemicals introduces UPM SolargoTM, a novel line of bio-based plant stimulants, marking its debut in the agrochemicals sector. These bio stimulants enhance nutrient absorption and stress tolerance in crops without directly supplying nutrients, promoting sustainable agriculture with reduced environmental impact compared to conventional products.
- In August 2023, FMC India introduced ENTAZIA™ bio fungicide, featuring Bacillus subtilis for effective crop protection. This innovative solution combats bacterial leaf blight in rice by enhancing natural plant defenses while maintaining ecosystem balance. ENTAZIA™ integrates seamlessly into integrated pest management strategies alongside FMC's bio stimulants and synthetic fungicides, promoting crop health and resilience.
|
Global Biostimulants Market |
|||
|
Base Year: |
2024 |
Forecast Period: |
2025-2032 |
|
Historical Data: |
2018 to 2023 |
Market Size in 2024: |
USD 4.86 Bn. |
|
Forecast Period 2025-32 CAGR: |
11.50% |
Market Size in 2032: |
USD 11.61 Bn. |
|
Segments Covered: |
By Active Ingredients |
|
|
|
By Source |
|
||
|
By Crop Type |
|
||
|
By Application |
|
||
|
By Form |
|
||
|
By Region |
|
||
|
Key Market Drivers: |
|
||
|
Key Market Restraints: |
|
||
|
Key Opportunities: |
|
||
|
Companies Covered in the report: |
|
||
Chapter 1: Introduction
1.1 Scope and Coverage
Chapter 2:Executive Summary
Chapter 3: Market Landscape
3.1 Market Dynamics
3.1.1 Drivers
3.1.2 Restraints
3.1.3 Opportunities
3.1.4 Challenges
3.2 Market Trend Analysis
3.3 PESTLE Analysis
3.4 Porter's Five Forces Analysis
3.5 Industry Value Chain Analysis
3.6 Ecosystem
3.7 Regulatory Landscape
3.8 Price Trend Analysis
3.9 Patent Analysis
3.10 Technology Evolution
3.11 Investment Pockets
3.12 Import-Export Analysis
Chapter 4: Biostimulants Market by Active Ingredients (2018-2032)
4.1 Biostimulants Market Snapshot and Growth Engine
4.2 Market Overview
4.3 Humic Substances
4.3.1 Introduction and Market Overview
4.3.2 Historic and Forecasted Market Size in Value USD and Volume Units
4.3.3 Key Market Trends, Growth Factors, and Opportunities
4.3.4 Geographic Segmentation Analysis
4.4 Vitamins
4.5 Amino Acids
4.6 Seaweed Extract
4.7 Microbial Soil Amendments
4.8 Others
Chapter 5: Biostimulants Market by Source (2018-2032)
5.1 Biostimulants Market Snapshot and Growth Engine
5.2 Market Overview
5.3 Microbial
5.3.1 Introduction and Market Overview
5.3.2 Historic and Forecasted Market Size in Value USD and Volume Units
5.3.3 Key Market Trends, Growth Factors, and Opportunities
5.3.4 Geographic Segmentation Analysis
5.4 Non-Microbial
Chapter 6: Biostimulants Market by Crop Type (2018-2032)
6.1 Biostimulants Market Snapshot and Growth Engine
6.2 Market Overview
6.3 Fruits and Vegetables
6.3.1 Introduction and Market Overview
6.3.2 Historic and Forecasted Market Size in Value USD and Volume Units
6.3.3 Key Market Trends, Growth Factors, and Opportunities
6.3.4 Geographic Segmentation Analysis
6.4 Cereals and Grains
6.5 Turf and Ornamentals
6.6 Oilseeds and Pulses
6.7 Others
Chapter 7: Biostimulants Market by Application (2018-2032)
7.1 Biostimulants Market Snapshot and Growth Engine
7.2 Market Overview
7.3 Foliar Spray
7.3.1 Introduction and Market Overview
7.3.2 Historic and Forecasted Market Size in Value USD and Volume Units
7.3.3 Key Market Trends, Growth Factors, and Opportunities
7.3.4 Geographic Segmentation Analysis
7.4 Soil Treatment
7.5 Seed Treatment
Chapter 8: Biostimulants Market by Form (2018-2032)
8.1 Biostimulants Market Snapshot and Growth Engine
8.2 Market Overview
8.3 Dry
8.3.1 Introduction and Market Overview
8.3.2 Historic and Forecasted Market Size in Value USD and Volume Units
8.3.3 Key Market Trends, Growth Factors, and Opportunities
8.3.4 Geographic Segmentation Analysis
8.4 Liquid
Chapter 9: Company Profiles and Competitive Analysis
9.1 Competitive Landscape
9.1.1 Competitive Benchmarking
9.1.2 Biostimulants Market Share by Manufacturer (2024)
9.1.3 Industry BCG Matrix
9.1.4 Heat Map Analysis
9.1.5 Mergers and Acquisitions
9.2 INNOPHOS(US)
9.2.1 Company Overview
9.2.2 Key Executives
9.2.3 Company Snapshot
9.2.4 Role of the Company in the Market
9.2.5 Sustainability and Social Responsibility
9.2.6 Operating Business Segments
9.2.7 Product Portfolio
9.2.8 Business Performance
9.2.9 Key Strategic Moves and Recent Developments
9.2.10 SWOT Analysis
9.3 PRAYON(BELGIUM)
9.4 ICL PP (ISRAEL)
9.5 CHENGXING INDUSTRIAL (CHINA)
9.6 HENS (INDONESIA)
9.7 BUDENHEIM (GERMANY)
9.8 TIANJIA CHEM (CHINA)
9.9 HINDUSTAN PHOSPHATES (INDIA)
9.10 THERMPHOS (NETHERLANDS)
9.11 KOLOD FOOD INGREDIENTS (CHINA)
9.12 GADOT BIOCHEMICAL (ISRAEL)
9.13 HAIFA GROUP – (ISRAEL)
9.14 ADVANCE INORGANICS (INDIA)
9.15 TRIVENI CHEMICALS (INDIA)
9.16 CHEMICALS CHAMBER (SOUTH AFRICA)
Chapter 10: Global Biostimulants Market By Region
10.1 Overview
10.2. North America Biostimulants Market
10.2.1 Key Market Trends, Growth Factors and Opportunities
10.2.2 Top Key Companies
10.2.3 Historic and Forecasted Market Size by Segments
10.2.4 Historic and Forecasted Market Size by Active Ingredients
10.2.4.1 Humic Substances
10.2.4.2 Vitamins
10.2.4.3 Amino Acids
10.2.4.4 Seaweed Extract
10.2.4.5 Microbial Soil Amendments
10.2.4.6 Others
10.2.5 Historic and Forecasted Market Size by Source
10.2.5.1 Microbial
10.2.5.2 Non-Microbial
10.2.6 Historic and Forecasted Market Size by Crop Type
10.2.6.1 Fruits and Vegetables
10.2.6.2 Cereals and Grains
10.2.6.3 Turf and Ornamentals
10.2.6.4 Oilseeds and Pulses
10.2.6.5 Others
10.2.7 Historic and Forecasted Market Size by Application
10.2.7.1 Foliar Spray
10.2.7.2 Soil Treatment
10.2.7.3 Seed Treatment
10.2.8 Historic and Forecasted Market Size by Form
10.2.8.1 Dry
10.2.8.2 Liquid
10.2.9 Historic and Forecast Market Size by Country
10.2.9.1 US
10.2.9.2 Canada
10.2.9.3 Mexico
10.3. Eastern Europe Biostimulants Market
10.3.1 Key Market Trends, Growth Factors and Opportunities
10.3.2 Top Key Companies
10.3.3 Historic and Forecasted Market Size by Segments
10.3.4 Historic and Forecasted Market Size by Active Ingredients
10.3.4.1 Humic Substances
10.3.4.2 Vitamins
10.3.4.3 Amino Acids
10.3.4.4 Seaweed Extract
10.3.4.5 Microbial Soil Amendments
10.3.4.6 Others
10.3.5 Historic and Forecasted Market Size by Source
10.3.5.1 Microbial
10.3.5.2 Non-Microbial
10.3.6 Historic and Forecasted Market Size by Crop Type
10.3.6.1 Fruits and Vegetables
10.3.6.2 Cereals and Grains
10.3.6.3 Turf and Ornamentals
10.3.6.4 Oilseeds and Pulses
10.3.6.5 Others
10.3.7 Historic and Forecasted Market Size by Application
10.3.7.1 Foliar Spray
10.3.7.2 Soil Treatment
10.3.7.3 Seed Treatment
10.3.8 Historic and Forecasted Market Size by Form
10.3.8.1 Dry
10.3.8.2 Liquid
10.3.9 Historic and Forecast Market Size by Country
10.3.9.1 Russia
10.3.9.2 Bulgaria
10.3.9.3 The Czech Republic
10.3.9.4 Hungary
10.3.9.5 Poland
10.3.9.6 Romania
10.3.9.7 Rest of Eastern Europe
10.4. Western Europe Biostimulants Market
10.4.1 Key Market Trends, Growth Factors and Opportunities
10.4.2 Top Key Companies
10.4.3 Historic and Forecasted Market Size by Segments
10.4.4 Historic and Forecasted Market Size by Active Ingredients
10.4.4.1 Humic Substances
10.4.4.2 Vitamins
10.4.4.3 Amino Acids
10.4.4.4 Seaweed Extract
10.4.4.5 Microbial Soil Amendments
10.4.4.6 Others
10.4.5 Historic and Forecasted Market Size by Source
10.4.5.1 Microbial
10.4.5.2 Non-Microbial
10.4.6 Historic and Forecasted Market Size by Crop Type
10.4.6.1 Fruits and Vegetables
10.4.6.2 Cereals and Grains
10.4.6.3 Turf and Ornamentals
10.4.6.4 Oilseeds and Pulses
10.4.6.5 Others
10.4.7 Historic and Forecasted Market Size by Application
10.4.7.1 Foliar Spray
10.4.7.2 Soil Treatment
10.4.7.3 Seed Treatment
10.4.8 Historic and Forecasted Market Size by Form
10.4.8.1 Dry
10.4.8.2 Liquid
10.4.9 Historic and Forecast Market Size by Country
10.4.9.1 Germany
10.4.9.2 UK
10.4.9.3 France
10.4.9.4 The Netherlands
10.4.9.5 Italy
10.4.9.6 Spain
10.4.9.7 Rest of Western Europe
10.5. Asia Pacific Biostimulants Market
10.5.1 Key Market Trends, Growth Factors and Opportunities
10.5.2 Top Key Companies
10.5.3 Historic and Forecasted Market Size by Segments
10.5.4 Historic and Forecasted Market Size by Active Ingredients
10.5.4.1 Humic Substances
10.5.4.2 Vitamins
10.5.4.3 Amino Acids
10.5.4.4 Seaweed Extract
10.5.4.5 Microbial Soil Amendments
10.5.4.6 Others
10.5.5 Historic and Forecasted Market Size by Source
10.5.5.1 Microbial
10.5.5.2 Non-Microbial
10.5.6 Historic and Forecasted Market Size by Crop Type
10.5.6.1 Fruits and Vegetables
10.5.6.2 Cereals and Grains
10.5.6.3 Turf and Ornamentals
10.5.6.4 Oilseeds and Pulses
10.5.6.5 Others
10.5.7 Historic and Forecasted Market Size by Application
10.5.7.1 Foliar Spray
10.5.7.2 Soil Treatment
10.5.7.3 Seed Treatment
10.5.8 Historic and Forecasted Market Size by Form
10.5.8.1 Dry
10.5.8.2 Liquid
10.5.9 Historic and Forecast Market Size by Country
10.5.9.1 China
10.5.9.2 India
10.5.9.3 Japan
10.5.9.4 South Korea
10.5.9.5 Malaysia
10.5.9.6 Thailand
10.5.9.7 Vietnam
10.5.9.8 The Philippines
10.5.9.9 Australia
10.5.9.10 New Zealand
10.5.9.11 Rest of APAC
10.6. Middle East & Africa Biostimulants Market
10.6.1 Key Market Trends, Growth Factors and Opportunities
10.6.2 Top Key Companies
10.6.3 Historic and Forecasted Market Size by Segments
10.6.4 Historic and Forecasted Market Size by Active Ingredients
10.6.4.1 Humic Substances
10.6.4.2 Vitamins
10.6.4.3 Amino Acids
10.6.4.4 Seaweed Extract
10.6.4.5 Microbial Soil Amendments
10.6.4.6 Others
10.6.5 Historic and Forecasted Market Size by Source
10.6.5.1 Microbial
10.6.5.2 Non-Microbial
10.6.6 Historic and Forecasted Market Size by Crop Type
10.6.6.1 Fruits and Vegetables
10.6.6.2 Cereals and Grains
10.6.6.3 Turf and Ornamentals
10.6.6.4 Oilseeds and Pulses
10.6.6.5 Others
10.6.7 Historic and Forecasted Market Size by Application
10.6.7.1 Foliar Spray
10.6.7.2 Soil Treatment
10.6.7.3 Seed Treatment
10.6.8 Historic and Forecasted Market Size by Form
10.6.8.1 Dry
10.6.8.2 Liquid
10.6.9 Historic and Forecast Market Size by Country
10.6.9.1 Turkiye
10.6.9.2 Bahrain
10.6.9.3 Kuwait
10.6.9.4 Saudi Arabia
10.6.9.5 Qatar
10.6.9.6 UAE
10.6.9.7 Israel
10.6.9.8 South Africa
10.7. South America Biostimulants Market
10.7.1 Key Market Trends, Growth Factors and Opportunities
10.7.2 Top Key Companies
10.7.3 Historic and Forecasted Market Size by Segments
10.7.4 Historic and Forecasted Market Size by Active Ingredients
10.7.4.1 Humic Substances
10.7.4.2 Vitamins
10.7.4.3 Amino Acids
10.7.4.4 Seaweed Extract
10.7.4.5 Microbial Soil Amendments
10.7.4.6 Others
10.7.5 Historic and Forecasted Market Size by Source
10.7.5.1 Microbial
10.7.5.2 Non-Microbial
10.7.6 Historic and Forecasted Market Size by Crop Type
10.7.6.1 Fruits and Vegetables
10.7.6.2 Cereals and Grains
10.7.6.3 Turf and Ornamentals
10.7.6.4 Oilseeds and Pulses
10.7.6.5 Others
10.7.7 Historic and Forecasted Market Size by Application
10.7.7.1 Foliar Spray
10.7.7.2 Soil Treatment
10.7.7.3 Seed Treatment
10.7.8 Historic and Forecasted Market Size by Form
10.7.8.1 Dry
10.7.8.2 Liquid
10.7.9 Historic and Forecast Market Size by Country
10.7.9.1 Brazil
10.7.9.2 Argentina
10.7.9.3 Rest of SA
Chapter 11 Analyst Viewpoint and Conclusion
11.1 Recommendations and Concluding Analysis
11.2 Potential Market Strategies
Chapter 12 Research Methodology
12.1 Research Process
12.2 Primary Research
12.3 Secondary Research
|
Global Biostimulants Market |
|||
|
Base Year: |
2024 |
Forecast Period: |
2025-2032 |
|
Historical Data: |
2018 to 2023 |
Market Size in 2024: |
USD 4.86 Bn. |
|
Forecast Period 2025-32 CAGR: |
11.50% |
Market Size in 2032: |
USD 11.61 Bn. |
|
Segments Covered: |
By Active Ingredients |
|
|
|
By Source |
|
||
|
By Crop Type |
|
||
|
By Application |
|
||
|
By Form |
|
||
|
By Region |
|
||
|
Key Market Drivers: |
|
||
|
Key Market Restraints: |
|
||
|
Key Opportunities: |
|
||
|
Companies Covered in the report: |
|
||


