


Bee Propolis Extract Market Synopsis
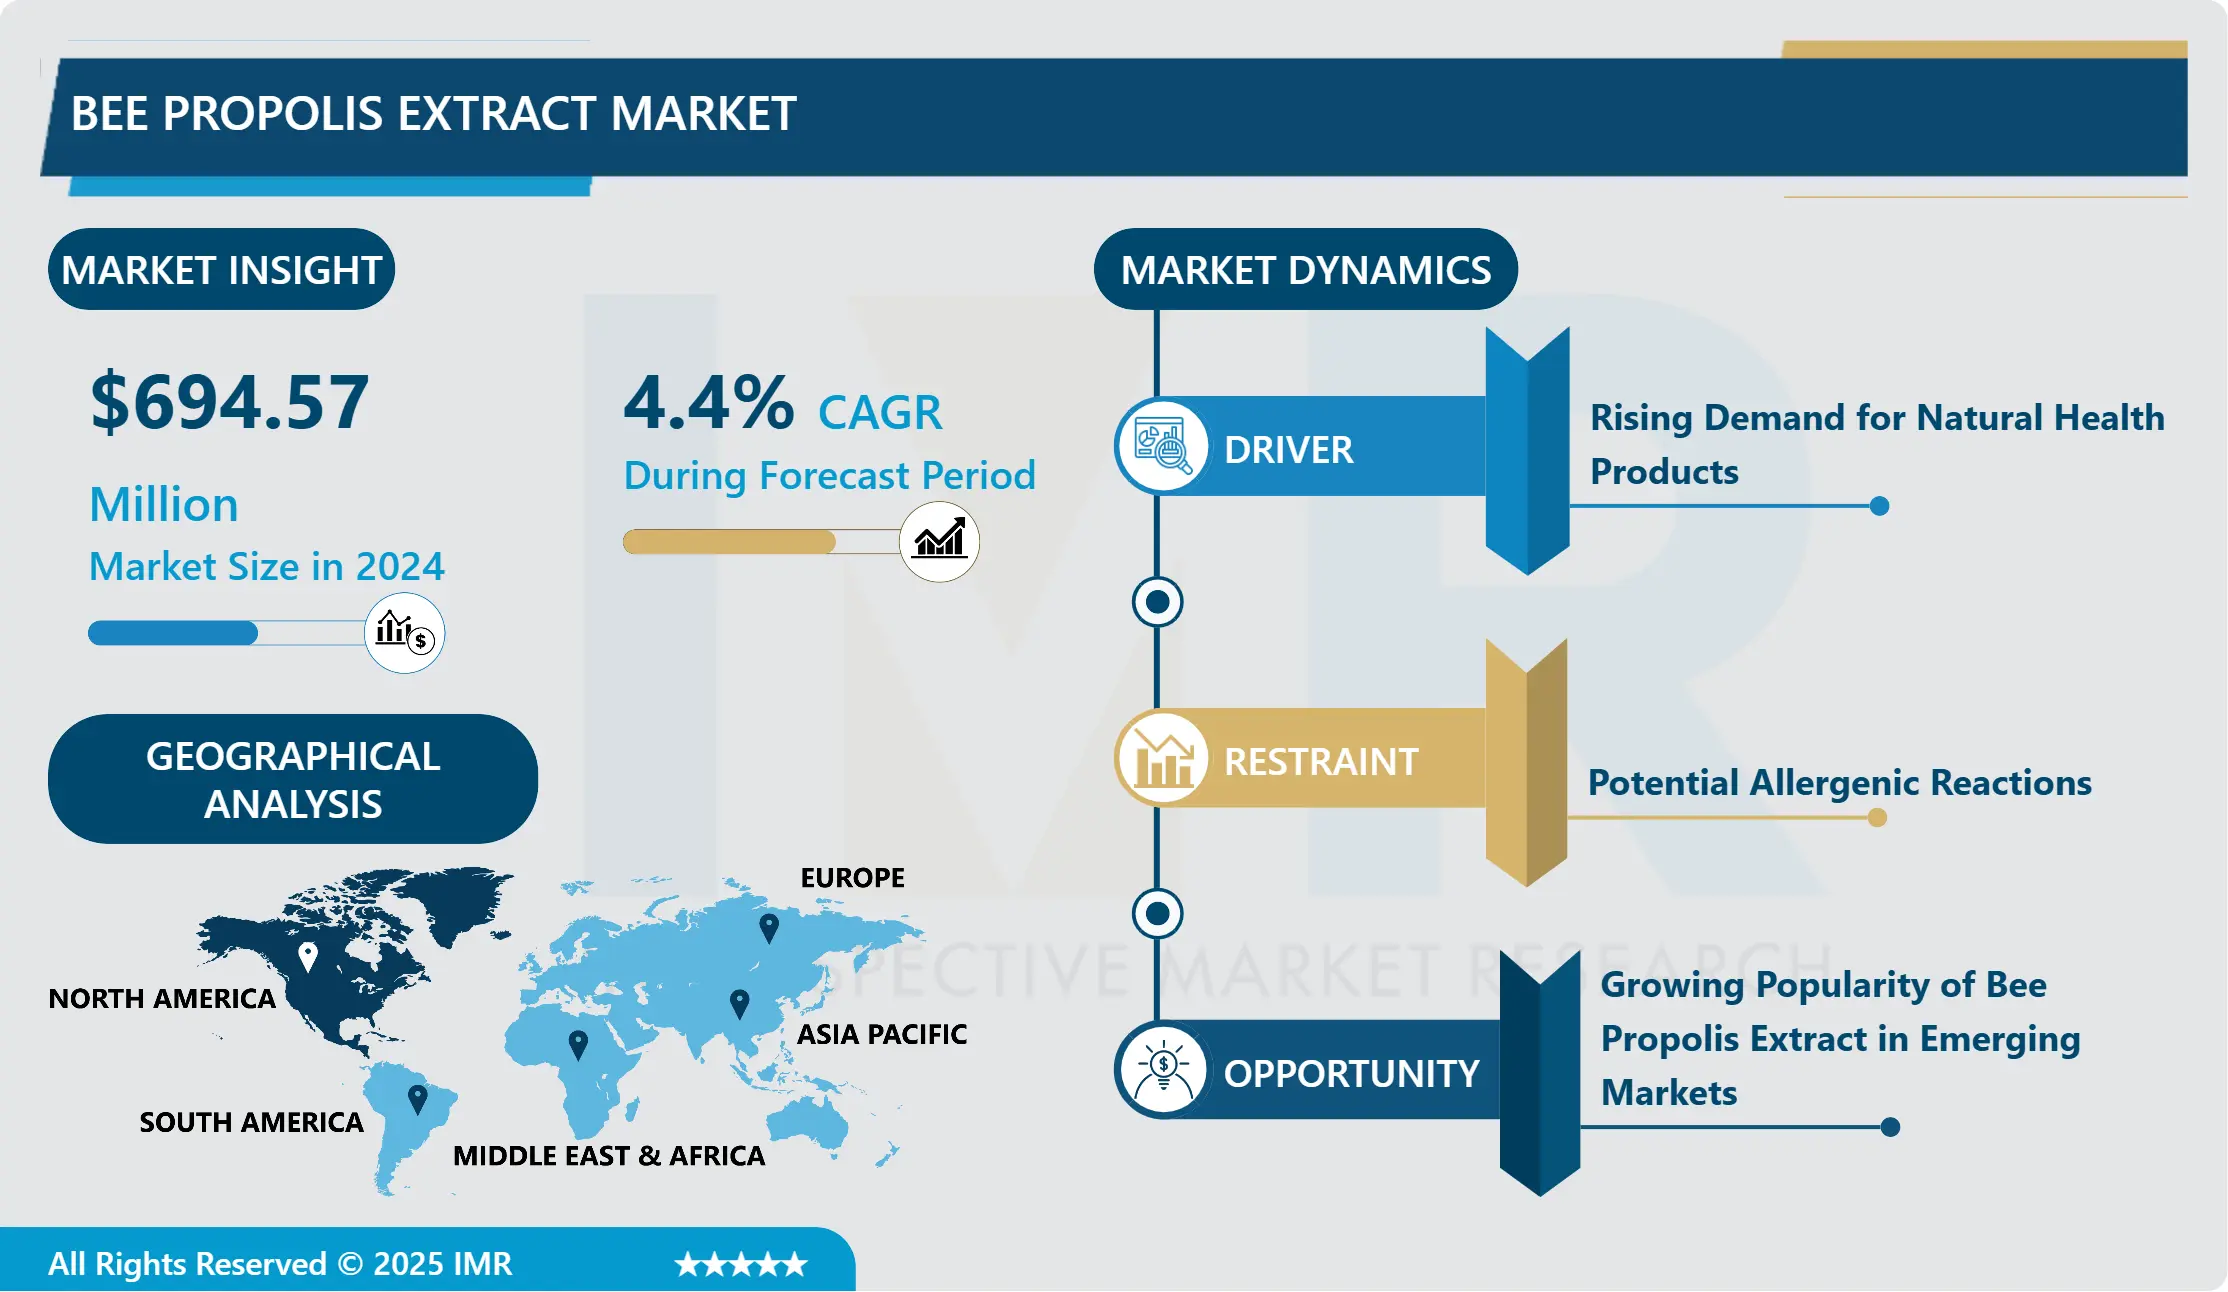
Global Bee Propolis Extract Market Size Was Valued at USD 694.57 Million in 2024 and is Projected to Reach USD 980.21 Million by 2032, Growing at a CAGR of 4.4% From 2025-2032.
Bee propolis extract is a natural substance made by bees from plant resins. Known for its health benefits, it contains a blend of plant compounds, beeswax, and enzymes. Bees use propolis to seal and protect their hives. Extracted for human use, it is valued for its potential antioxidant, anti-inflammatory, and antimicrobial properties. People often use bee propolis extract as a supplement or in various health and skincare products due to its reputed therapeutic qualities.
A natural resinous substance that bees gather from tree buds, bee propolis extract is becoming more popular in the market as people become more aware of its possible health benefits. The market is currently being driven by an increase in interest in alternative medicine along with a growing demand for natural and organic products. Because of its antimicrobial, anti-inflammatory, and antioxidant qualities, bee propolis extract is popular among consumers and is often found in a variety of health and wellness products.
The market for bee propolis extract looks to have a bright future. Expected elements include the development of the nutraceutical industry, manufacturers diversifying their product offerings, and continuous research revealing novel therapeutic applications. The market is expected to grow steadily as long as consumers prioritize natural remedies. This is because consumers are becoming more aware of the potential benefits of bee propolis extract in promoting overall health and immune function.
The bee propolis extract market is expected to grow in the future due to the current surge in demand from health-conscious consumers and the promising future outlook from ongoing research and growing product offerings. The market has the potential to grow if it can satisfy consumer preferences for healthy, natural products, making bee propolis extract a major player in the wellness and health sector.
Bee Propolis Extract Market Trend Analysis:
Rising Demand for Natural Health Products
- Consumers have increasingly favored products perceived as holistic and sourced from natural origins, reflecting a broader trend towards wellness and preventive healthcare. Natural health products, including supplements, herbal remedies, and organic formulations, resonate with individuals seeking alternatives to traditional pharmaceuticals due to concerns about synthetic ingredients and potential side effects. This shift in consumer preferences has prompted a strong market response, fostering innovation and growth in the natural health product sector.
- The growing preference for natural health solutions is deeply rooted in a broader societal trend where individuals are proactively taking control of their well-being. Increased awareness of the benefits associated with natural ingredients, such as reduced exposure to chemicals and alignment with a healthier lifestyle, has driven this demand. Additionally, the appeal of natural health products extends beyond niche markets, as mainstream consumers increasingly integrate them into their daily routines. Consequently, companies in the natural health product industry are facing heightened demand, leading to increased research and development efforts to meet the evolving needs and expectations of a growing customer base.
- As long as consumers' preferences continue to prioritize the need for natural health products, the market is expected to grow steadily. The growing trend of clean-label products, environmental sustainability, and health consciousness all work together to support natural health products' status as a major force behind the wellness and healthcare industries' constant change.
Growing Popularity of Bee Propolis Extract in Emerging Markets
- The growing popularity of bee propolis extract in developing markets plays a crucial role in propelling market expansion. As these markets undergo economic growth, there is a noticeable shift in consumer preferences towards natural and holistic health solutions. Bee propolis extract, known for its antioxidant, anti-inflammatory, and antimicrobial properties, aligns well with the increasing demand for products that promote overall well-being. The natural origins of bee propolis resonate with health-conscious consumers in developing markets, where traditional and natural remedies often carry cultural significance.
- Moreover, the heightened awareness of the potential health benefits associated with bee propolis extract has contributed to its acceptance and integration into local wellness practices. As consumers in developing markets become more knowledgeable about the properties of bee propolis and its applications, there is a growing demand for products ranging from dietary supplements to skincare items that incorporate this natural ingredient. This surge in popularity has not only broadened the product offerings in these regions but has also attracted investment and innovation from manufacturers looking to capitalize on the trend.
- Bee propolis extract has the potential to become a mainstay in the health and wellness sector, as evidenced by its upward trend in popularity in developing markets. In these emerging markets, bee propolis extract is positioned as a significant growth driver, with the potential to redefine and reshape the landscape of traditional health practices, thanks to the convergence of cultural acceptance, consumer education, and the global trend towards natural health solutions.
Bee Propolis Extract Market Segment Analysis:
Bee Propolis Extract Market Segmented on the basis of Type, Form, Nature, Functionality, Application and Distribution Channel
By Type, Capsule/Tablets segment is expected to dominate the market during the forecast period
- The prevalence of capsules and tablets in the Bee Propolis Extract market can be attributed to various factors. This dominance is driven by the convenience and standardized nature of these forms of consumption, offering precise dosage control and easy integration into daily routines. Consumers often favor capsules and tablets due to their simplicity, portability, and ability to avoid the distinct taste of bee propolis, making them more palatable.
- Moreover, these formats provide an efficient delivery method for the controlled release of the extract's beneficial compounds, enhancing bioavailability and optimizing overall health impact. The segment's dominance is further supported by its alignment with consumer preferences for hassle-free and accessible options in the pursuit of natural health and wellness products. Manufacturers' focus on developing innovative formulations and ensuring product efficacy reinforces the sustained prevalence of capsules and tablets in the Bee Propolis Extract market.
By Functionality, Immune System Support held the largest share
- The increased emphasis on supporting the immune system serves as a significant factor driving the prominence of Bee Propolis Extract in the market. Bee propolis is abundant in bioactive compounds, such as flavonoids and polyphenols, renowned for their antioxidant and anti-inflammatory attributes. With a growing focus on preventive healthcare, consumers are actively seeking natural solutions to boost their immune health. Bee propolis extract, offering the potential to strengthen the immune system and act as a defense against oxidative stress, aligns seamlessly with this emerging health trend.
- As awareness of the importance of holistic well-being rises, the immune-boosting properties of bee propolis position it as a highly desirable ingredient, leading to its incorporation into various health supplements, functional foods, and wellness products to meet the evolving demands of health-conscious consumers.
Bee Propolis Extract Market Regional Insights:
North America is Expected to Dominate the Market Over the Forecast period
- North America asserts its dominance in the Bee Propolis Extract market, driven by a combination of factors that contribute to its enduring leadership. The region's advanced healthcare infrastructure and high consumer awareness of natural health remedies fuel the demand for products derived from bee propolis extract.
- Moreover, North America demonstrates a robust culture of health and wellness, with consumers increasingly turning to natural and holistic solutions for immune support and overall well-being. The presence of key market players, vigorous research and development initiatives, and a growing inclination towards preventive healthcare practices further solidify North America's position of dominance. The well-established regulatory framework and stringent quality standards in the region instill confidence in consumers, creating a conducive environment for the continuous growth of the Bee Propolis Extract market in North America.
Bee Propolis Extract Market Top Key Players:
- Forever Bee Products (US)
- Swanson Vitamins (US)
- Now Foods (US)
- Nutrabee (US)
- BeeVital (US)
- Gaia Herbs (US)
- Beekeeper's Guild (US)
- Global Apiaries (US)
- Hi-Tech Natural Products (US)
- Biobee (Canada)
- Apis Natura (Canada)
- ApiVita (Italy)
- Apiculture Ireland (Ireland)
- Beekeeper Naturprodukte (Germany)
- Beekeeper's Friend (UK)
- BioPropolis (Spain)
- Hawthorn Hill Honey (New Zealand)
- Comvita (New Zealand)
- Manuka Health (New Zealand)
- Propolis Plus (Australia)
- Bee Wise (Australia)
- Melland Ecogreen (China)
- Apimex (Brazil)
- BioProtec (Brazil)
- Apiter Laboratories (Brazil), and Other Active Players
Key Industry Developments in the Bee Propolis Extract Market:
- In January 2024, ApiotiX Technologies, a Croatia-based biotechnology R&D company and a spin-off from nutritional supplement business Hedera Ltd, announced the launch of its innovative Phenolic Acids Polymer Extract, a propolis-derived ingredient that promises to revolutionize the cosmetics industry. This new pharmaceutical-grade, standardized natural extract formulation offers impressive anti-wrinkle results and could potentially reduce the reliance on common preservatives in skin care formulations.
- In September 2023, NOW Foods (US) launched a new line of propolis gummies for children, catering to a growing market segment looking for convenient and palatable health supplements.
|
Global Bee Propolis Extract Market |
|||
|
Base Year: |
2024 |
Forecast Period: |
2025-2032 |
|
Historical Data: |
2018 to 2023 |
Market Size in 2024: |
USD 694.57 Mn. |
|
Forecast Period 2025-32 CAGR: |
4.4% |
Market Size in 2032: |
USD 980.21 Mn. |
|
Segments Covered: |
By Type |
|
|
|
By Form |
|
||
|
By Nature |
|
||
|
By Functionality |
|
||
|
By Application |
|
||
|
By Distribution Channel |
|
||
|
By Region |
|
||
|
Key Market Drivers: |
|
||
|
Key Market Restraints: |
|
||
|
Key Opportunities: |
|
||
|
Companies Covered in the report: |
|
||
Chapter 1: Introduction
1.1 Scope and Coverage
Chapter 2:Executive Summary
Chapter 3: Market Landscape
3.1 Market Dynamics
3.1.1 Drivers
3.1.2 Restraints
3.1.3 Opportunities
3.1.4 Challenges
3.2 Market Trend Analysis
3.3 PESTLE Analysis
3.4 Porter's Five Forces Analysis
3.5 Industry Value Chain Analysis
3.6 Ecosystem
3.7 Regulatory Landscape
3.8 Price Trend Analysis
3.9 Patent Analysis
3.10 Technology Evolution
3.11 Investment Pockets
3.12 Import-Export Analysis
Chapter 4: Bee Propolis Extract Market by Type (2018-2032)
4.1 Bee Propolis Extract Market Snapshot and Growth Engine
4.2 Market Overview
4.3 Capsule/Table
4.3.1 Introduction and Market Overview
4.3.2 Historic and Forecasted Market Size in Value USD and Volume Units
4.3.3 Key Market Trends, Growth Factors, and Opportunities
4.3.4 Geographic Segmentation Analysis
4.4 Powder
4.5 Liquid
Chapter 5: Bee Propolis Extract Market by Form (2018-2032)
5.1 Bee Propolis Extract Market Snapshot and Growth Engine
5.2 Market Overview
5.3 Raw Bee Propolis Extract
5.3.1 Introduction and Market Overview
5.3.2 Historic and Forecasted Market Size in Value USD and Volume Units
5.3.3 Key Market Trends, Growth Factors, and Opportunities
5.3.4 Geographic Segmentation Analysis
5.4 Standardized Bee Propolis Extract
Chapter 6: Bee Propolis Extract Market by Nature (2018-2032)
6.1 Bee Propolis Extract Market Snapshot and Growth Engine
6.2 Market Overview
6.3 Organic
6.3.1 Introduction and Market Overview
6.3.2 Historic and Forecasted Market Size in Value USD and Volume Units
6.3.3 Key Market Trends, Growth Factors, and Opportunities
6.3.4 Geographic Segmentation Analysis
6.4 Conventional
Chapter 7: Bee Propolis Extract Market by Functionality (2018-2032)
7.1 Bee Propolis Extract Market Snapshot and Growth Engine
7.2 Market Overview
7.3 Immune System Support
7.3.1 Introduction and Market Overview
7.3.2 Historic and Forecasted Market Size in Value USD and Volume Units
7.3.3 Key Market Trends, Growth Factors, and Opportunities
7.3.4 Geographic Segmentation Analysis
7.4 Anti-Inflammatory
7.5 Antioxidant
7.6 Wound Healing
7.7 Skin Health
Chapter 8: Bee Propolis Extract Market by Application (2018-2032)
8.1 Bee Propolis Extract Market Snapshot and Growth Engine
8.2 Market Overview
8.3 Food and Beverages
8.3.1 Introduction and Market Overview
8.3.2 Historic and Forecasted Market Size in Value USD and Volume Units
8.3.3 Key Market Trends, Growth Factors, and Opportunities
8.3.4 Geographic Segmentation Analysis
8.4 Dietary Supplements
8.5 Pharmaceuticals
8.6 Cosmetics
8.7 Personal Care
Chapter 9: Bee Propolis Extract Market by Distribution Channel (2018-2032)
9.1 Bee Propolis Extract Market Snapshot and Growth Engine
9.2 Market Overview
9.3 Health Stores
9.3.1 Introduction and Market Overview
9.3.2 Historic and Forecasted Market Size in Value USD and Volume Units
9.3.3 Key Market Trends, Growth Factors, and Opportunities
9.3.4 Geographic Segmentation Analysis
9.4 Supermarkets/Hypermarkets
9.5 Specialty Stores
9.6 Online Retail
Chapter 10: Company Profiles and Competitive Analysis
10.1 Competitive Landscape
10.1.1 Competitive Benchmarking
10.1.2 Bee Propolis Extract Market Share by Manufacturer (2024)
10.1.3 Industry BCG Matrix
10.1.4 Heat Map Analysis
10.1.5 Mergers and Acquisitions
10.2 WESTINGHOUSE ELECTRIC COMPANY (U.S.)
10.2.1 Company Overview
10.2.2 Key Executives
10.2.3 Company Snapshot
10.2.4 Role of the Company in the Market
10.2.5 Sustainability and Social Responsibility
10.2.6 Operating Business Segments
10.2.7 Product Portfolio
10.2.8 Business Performance
10.2.9 Key Strategic Moves and Recent Developments
10.2.10 SWOT Analysis
10.3 GE HITACHI NUCLEAR ENERGY (U.S)
10.4 BECHTEL (U.S.)
10.5 FLUOR CORPORATION (U.STERRAPOWER (U.S.)
10.6 KAIROS POWER (U.S.)
10.7 GE-HITACHI NUCLEAR ENERGY (U.S)
10.8 X-ENERGY (U.S.)
10.9 TERRESTRIAL ENERGY INC. (CANADA)
10.10 CANDU ENERGY (CANADA)
10.11 ATOMIC ENERGY OF CANADA (CANADA)
10.12 EDF GROUP (FRANCE)
10.13 ROSATOM (RUSSIA)
10.14 ATOMSTROYEXPORT (RUSSIA)
10.15 SIEMENS ENERGY (GERMANY)
10.16 FRAMATOME (FRANCE)
10.17 FORTUM (FINLAND)
10.18 MITSUBISHI HEAVY INDUSTRIES (JAPAN)
10.19 TOSHIBA ENERGY SYSTEMS & SOLUTIONS CORPORATION (JAPAN)
10.20 NUCLEAR POWER CORPORATION OF INDIA LIMITED (INDIA)
10.21 LARSEN AND TOUBRO (L&T) (INDIA)
10.22 BHARAT HEAVY ELECTRICALS (INDIA)
10.23 KOREA ELECTRIC POWER CORPORATION (SOUTH KOREA)
10.24 NUCLEOELÉCTRICA ARGENTINA S.A (ARGENTINA)
10.25 CHINA NATIONAL NUCLEAR CORPORATION (CHINA)
Chapter 11: Global Bee Propolis Extract Market By Region
11.1 Overview
11.2. North America Bee Propolis Extract Market
11.2.1 Key Market Trends, Growth Factors and Opportunities
11.2.2 Top Key Companies
11.2.3 Historic and Forecasted Market Size by Segments
11.2.4 Historic and Forecasted Market Size by Type
11.2.4.1 Capsule/Table
11.2.4.2 Powder
11.2.4.3 Liquid
11.2.5 Historic and Forecasted Market Size by Form
11.2.5.1 Raw Bee Propolis Extract
11.2.5.2 Standardized Bee Propolis Extract
11.2.6 Historic and Forecasted Market Size by Nature
11.2.6.1 Organic
11.2.6.2 Conventional
11.2.7 Historic and Forecasted Market Size by Functionality
11.2.7.1 Immune System Support
11.2.7.2 Anti-Inflammatory
11.2.7.3 Antioxidant
11.2.7.4 Wound Healing
11.2.7.5 Skin Health
11.2.8 Historic and Forecasted Market Size by Application
11.2.8.1 Food and Beverages
11.2.8.2 Dietary Supplements
11.2.8.3 Pharmaceuticals
11.2.8.4 Cosmetics
11.2.8.5 Personal Care
11.2.9 Historic and Forecasted Market Size by Distribution Channel
11.2.9.1 Health Stores
11.2.9.2 Supermarkets/Hypermarkets
11.2.9.3 Specialty Stores
11.2.9.4 Online Retail
11.2.10 Historic and Forecast Market Size by Country
11.2.10.1 US
11.2.10.2 Canada
11.2.10.3 Mexico
11.3. Eastern Europe Bee Propolis Extract Market
11.3.1 Key Market Trends, Growth Factors and Opportunities
11.3.2 Top Key Companies
11.3.3 Historic and Forecasted Market Size by Segments
11.3.4 Historic and Forecasted Market Size by Type
11.3.4.1 Capsule/Table
11.3.4.2 Powder
11.3.4.3 Liquid
11.3.5 Historic and Forecasted Market Size by Form
11.3.5.1 Raw Bee Propolis Extract
11.3.5.2 Standardized Bee Propolis Extract
11.3.6 Historic and Forecasted Market Size by Nature
11.3.6.1 Organic
11.3.6.2 Conventional
11.3.7 Historic and Forecasted Market Size by Functionality
11.3.7.1 Immune System Support
11.3.7.2 Anti-Inflammatory
11.3.7.3 Antioxidant
11.3.7.4 Wound Healing
11.3.7.5 Skin Health
11.3.8 Historic and Forecasted Market Size by Application
11.3.8.1 Food and Beverages
11.3.8.2 Dietary Supplements
11.3.8.3 Pharmaceuticals
11.3.8.4 Cosmetics
11.3.8.5 Personal Care
11.3.9 Historic and Forecasted Market Size by Distribution Channel
11.3.9.1 Health Stores
11.3.9.2 Supermarkets/Hypermarkets
11.3.9.3 Specialty Stores
11.3.9.4 Online Retail
11.3.10 Historic and Forecast Market Size by Country
11.3.10.1 Russia
11.3.10.2 Bulgaria
11.3.10.3 The Czech Republic
11.3.10.4 Hungary
11.3.10.5 Poland
11.3.10.6 Romania
11.3.10.7 Rest of Eastern Europe
11.4. Western Europe Bee Propolis Extract Market
11.4.1 Key Market Trends, Growth Factors and Opportunities
11.4.2 Top Key Companies
11.4.3 Historic and Forecasted Market Size by Segments
11.4.4 Historic and Forecasted Market Size by Type
11.4.4.1 Capsule/Table
11.4.4.2 Powder
11.4.4.3 Liquid
11.4.5 Historic and Forecasted Market Size by Form
11.4.5.1 Raw Bee Propolis Extract
11.4.5.2 Standardized Bee Propolis Extract
11.4.6 Historic and Forecasted Market Size by Nature
11.4.6.1 Organic
11.4.6.2 Conventional
11.4.7 Historic and Forecasted Market Size by Functionality
11.4.7.1 Immune System Support
11.4.7.2 Anti-Inflammatory
11.4.7.3 Antioxidant
11.4.7.4 Wound Healing
11.4.7.5 Skin Health
11.4.8 Historic and Forecasted Market Size by Application
11.4.8.1 Food and Beverages
11.4.8.2 Dietary Supplements
11.4.8.3 Pharmaceuticals
11.4.8.4 Cosmetics
11.4.8.5 Personal Care
11.4.9 Historic and Forecasted Market Size by Distribution Channel
11.4.9.1 Health Stores
11.4.9.2 Supermarkets/Hypermarkets
11.4.9.3 Specialty Stores
11.4.9.4 Online Retail
11.4.10 Historic and Forecast Market Size by Country
11.4.10.1 Germany
11.4.10.2 UK
11.4.10.3 France
11.4.10.4 The Netherlands
11.4.10.5 Italy
11.4.10.6 Spain
11.4.10.7 Rest of Western Europe
11.5. Asia Pacific Bee Propolis Extract Market
11.5.1 Key Market Trends, Growth Factors and Opportunities
11.5.2 Top Key Companies
11.5.3 Historic and Forecasted Market Size by Segments
11.5.4 Historic and Forecasted Market Size by Type
11.5.4.1 Capsule/Table
11.5.4.2 Powder
11.5.4.3 Liquid
11.5.5 Historic and Forecasted Market Size by Form
11.5.5.1 Raw Bee Propolis Extract
11.5.5.2 Standardized Bee Propolis Extract
11.5.6 Historic and Forecasted Market Size by Nature
11.5.6.1 Organic
11.5.6.2 Conventional
11.5.7 Historic and Forecasted Market Size by Functionality
11.5.7.1 Immune System Support
11.5.7.2 Anti-Inflammatory
11.5.7.3 Antioxidant
11.5.7.4 Wound Healing
11.5.7.5 Skin Health
11.5.8 Historic and Forecasted Market Size by Application
11.5.8.1 Food and Beverages
11.5.8.2 Dietary Supplements
11.5.8.3 Pharmaceuticals
11.5.8.4 Cosmetics
11.5.8.5 Personal Care
11.5.9 Historic and Forecasted Market Size by Distribution Channel
11.5.9.1 Health Stores
11.5.9.2 Supermarkets/Hypermarkets
11.5.9.3 Specialty Stores
11.5.9.4 Online Retail
11.5.10 Historic and Forecast Market Size by Country
11.5.10.1 China
11.5.10.2 India
11.5.10.3 Japan
11.5.10.4 South Korea
11.5.10.5 Malaysia
11.5.10.6 Thailand
11.5.10.7 Vietnam
11.5.10.8 The Philippines
11.5.10.9 Australia
11.5.10.10 New Zealand
11.5.10.11 Rest of APAC
11.6. Middle East & Africa Bee Propolis Extract Market
11.6.1 Key Market Trends, Growth Factors and Opportunities
11.6.2 Top Key Companies
11.6.3 Historic and Forecasted Market Size by Segments
11.6.4 Historic and Forecasted Market Size by Type
11.6.4.1 Capsule/Table
11.6.4.2 Powder
11.6.4.3 Liquid
11.6.5 Historic and Forecasted Market Size by Form
11.6.5.1 Raw Bee Propolis Extract
11.6.5.2 Standardized Bee Propolis Extract
11.6.6 Historic and Forecasted Market Size by Nature
11.6.6.1 Organic
11.6.6.2 Conventional
11.6.7 Historic and Forecasted Market Size by Functionality
11.6.7.1 Immune System Support
11.6.7.2 Anti-Inflammatory
11.6.7.3 Antioxidant
11.6.7.4 Wound Healing
11.6.7.5 Skin Health
11.6.8 Historic and Forecasted Market Size by Application
11.6.8.1 Food and Beverages
11.6.8.2 Dietary Supplements
11.6.8.3 Pharmaceuticals
11.6.8.4 Cosmetics
11.6.8.5 Personal Care
11.6.9 Historic and Forecasted Market Size by Distribution Channel
11.6.9.1 Health Stores
11.6.9.2 Supermarkets/Hypermarkets
11.6.9.3 Specialty Stores
11.6.9.4 Online Retail
11.6.10 Historic and Forecast Market Size by Country
11.6.10.1 Turkiye
11.6.10.2 Bahrain
11.6.10.3 Kuwait
11.6.10.4 Saudi Arabia
11.6.10.5 Qatar
11.6.10.6 UAE
11.6.10.7 Israel
11.6.10.8 South Africa
11.7. South America Bee Propolis Extract Market
11.7.1 Key Market Trends, Growth Factors and Opportunities
11.7.2 Top Key Companies
11.7.3 Historic and Forecasted Market Size by Segments
11.7.4 Historic and Forecasted Market Size by Type
11.7.4.1 Capsule/Table
11.7.4.2 Powder
11.7.4.3 Liquid
11.7.5 Historic and Forecasted Market Size by Form
11.7.5.1 Raw Bee Propolis Extract
11.7.5.2 Standardized Bee Propolis Extract
11.7.6 Historic and Forecasted Market Size by Nature
11.7.6.1 Organic
11.7.6.2 Conventional
11.7.7 Historic and Forecasted Market Size by Functionality
11.7.7.1 Immune System Support
11.7.7.2 Anti-Inflammatory
11.7.7.3 Antioxidant
11.7.7.4 Wound Healing
11.7.7.5 Skin Health
11.7.8 Historic and Forecasted Market Size by Application
11.7.8.1 Food and Beverages
11.7.8.2 Dietary Supplements
11.7.8.3 Pharmaceuticals
11.7.8.4 Cosmetics
11.7.8.5 Personal Care
11.7.9 Historic and Forecasted Market Size by Distribution Channel
11.7.9.1 Health Stores
11.7.9.2 Supermarkets/Hypermarkets
11.7.9.3 Specialty Stores
11.7.9.4 Online Retail
11.7.10 Historic and Forecast Market Size by Country
11.7.10.1 Brazil
11.7.10.2 Argentina
11.7.10.3 Rest of SA
Chapter 12 Analyst Viewpoint and Conclusion
12.1 Recommendations and Concluding Analysis
12.2 Potential Market Strategies
Chapter 13 Research Methodology
13.1 Research Process
13.2 Primary Research
13.3 Secondary Research
|
Global Bee Propolis Extract Market |
|||
|
Base Year: |
2024 |
Forecast Period: |
2025-2032 |
|
Historical Data: |
2018 to 2023 |
Market Size in 2024: |
USD 694.57 Mn. |
|
Forecast Period 2025-32 CAGR: |
4.4% |
Market Size in 2032: |
USD 980.21 Mn. |
|
Segments Covered: |
By Type |
|
|
|
By Form |
|
||
|
By Nature |
|
||
|
By Functionality |
|
||
|
By Application |
|
||
|
By Distribution Channel |
|
||
|
By Region |
|
||
|
Key Market Drivers: |
|
||
|
Key Market Restraints: |
|
||
|
Key Opportunities: |
|
||
|
Companies Covered in the report: |
|
||


