


B2B Mobile Commerce Market Synopsis
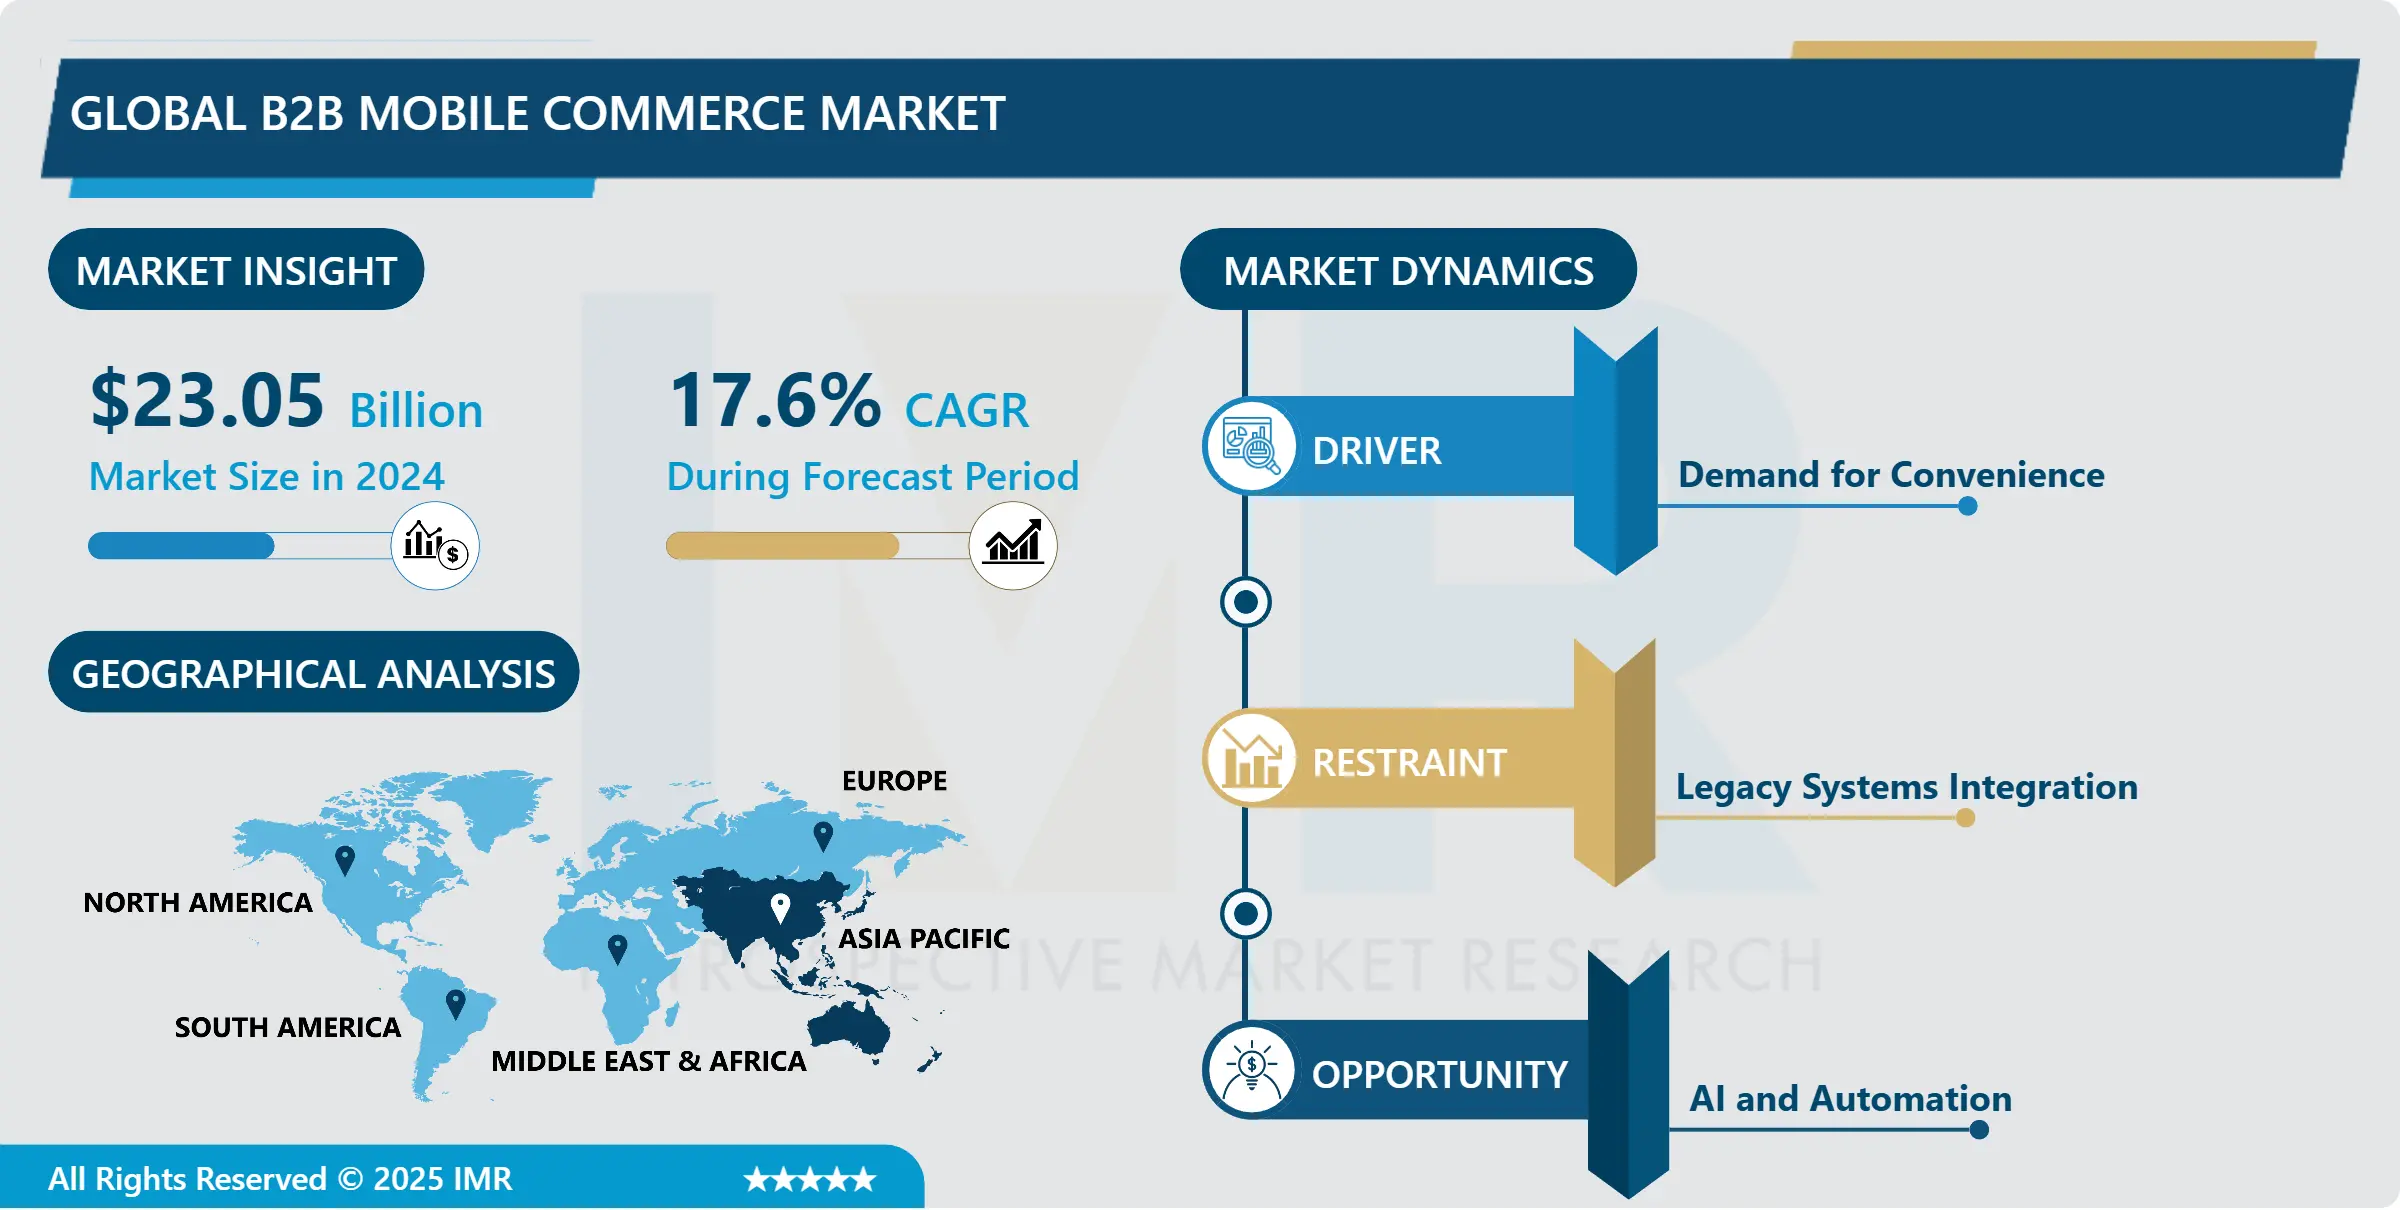
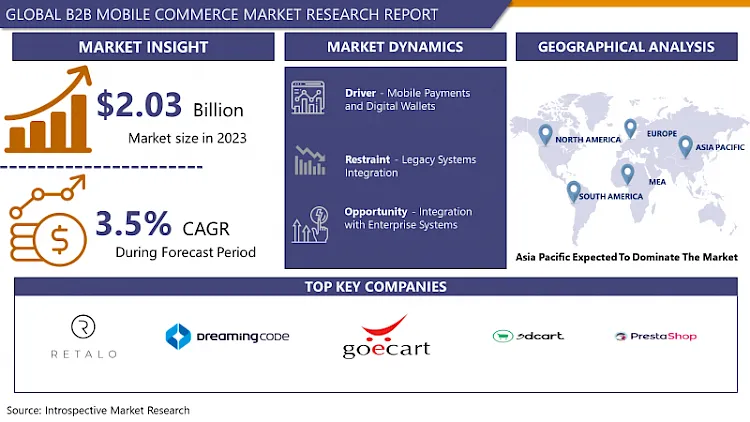
B2B Mobile Commerce Market Size Was Valued at USD 23.05 Billion in 2024 and is Projected to Reach USD 84.32 Billion by 2032, Growing at a CAGR of 17.6% From 2025-2032.
Business-to-business mobile commerce has also recently emerged to become one of the most popular market areas because most companies have opted to incorporate the technology with the aim of enhancing their relations with their own customers as well as being able to elevate their overall performance. This market relates to negotiated business sales where firms and enterprises use mobile devices to facilitate supply chain, purchasing, and selling. Specifically, the increase in the popularity of the use of mobile device such as smartphones and tablets, advancement in technologies in the mobile devices and the increasing demand for speed and real time information access in business to business communication are the main driving forces for this expansion. Businesses are investing in mobile commerce platforms as a way of improving the order taking, facilitating partners and adding more and more customer care. In addition, the integration with the trends of mobile commerce innovation including artificial intelligence (AI), blockchain, and the Internet of Things (IoT) is disrupting B2B. Machine learning commonly known as AI helps in predictive analysis and personalization; block chain on the other hand, provides secure and trustworthy transaction. It helps in outlining an effective logistics company as it allows real time tracking of products and sharing of information.
The B2B mobile commerce sector is characterized by a fast-growing trend attribute to smart phone usage and integration of mobile technology in business. B2B organizations’ survey showed that mobile either becomes or is contributing to more than 40% of overall revenues, making mobile crucial for sales. Mobile apps, artificial intelligence, and big data are among the marvels improving the future B2B mobile commerce. Mobile apps for native platforms are also distinctive and can enrich customer experience, provide effective means of payment and improve customers’ engagement. These apps enable multi-step transactions, for instance, customization of products, and bargaining with suppliers, making them important components in business. Players in global B2B mobile commerce industry include Shopify, BigCommerce, Magento, and Alibaba. There are small business, mid- sized business, and large business categories, and the mobile solution meet these business sizes individual needs. Furthermore, the overall use of mobile commerce is rising in business industries, facilitating an optimum performance in sales.
B2B Mobile Commerce Market Trend Analysis
Mobile Payments and Digital Wallets
- Among various fields of opportunity in B2B mobile commerce, the concept of MP/DW holds the unique position of being a burgeoning disruptor of transactional domains. The frequency of business transactions through mobile devices has ultimately led to the need for enabling users to make seamless, secure payments. Convenience payment methods like the Apple and Google Pay and other online wallets have quickly adapted themselves in the purchasing process and improved B2B buying experience and personal financial management.
- These solutions not only enhance the facet of purchasing by reducing the time duration spent on the process but also make payments safer with the help of tokenization and biometric facilities as compared to the conventional payment concepts. Furthermore, the use of mobile payments & digital wallets in B2B transactions makes it easier to track payments & C2B COD orders since they are recorded in an electronic format thus improving the overall reconciliations & auditing of any B2B transactions that take place.
- In addition, adaptable ability of the mobile payments due to versatility can support different types of B2B sectors and flexibility by covering the bulk, regular, and subscription requirement basis needs. It allows businesses and companies to seize opportunities and constantly make necessary changes in accordance with changing market conditions on the backdrop of emerging digital economy.
- Altogether, the utilization of mobile payments and digital wallets in the B2B mobile commerce market streamlines the interactions of the transactions and equally fuels innovation and trust between buyer and seller that will create the sustainability of the mobile commerce market and increase competitiveness in the digital channel.
Integration with Enterprise Systems
- Among emerging strategies in the context of B2B mobile commerce, switching to enterprise systems cooperation becomes recognized as a key driver that can affect the effectiveness of business transactions. Also, mobility is gradually becoming an important facet of B2B business transactions, wherein integrating with backend such as ERP, CRM solutions, and others becomes mandatory for reshaping business processes and improving productivity.
- It means that with integration of B2B mobile commerce with enterprise systems the data can be updated in real time, which helps firms update their stock and order management, and deliver customised customer experience. It allows organisations to dismantle traditional silo-based approaches to workflows and make sure that every stakeholder receives a detailed and well-constructed picture of sales outcomes, customer behaviours, and, ultimately, market conditions.
- Additionally, linking it to enterprise systems improves the security concerns and issue of compliance since the information is encrypted and is stored in secure backend frameworks. It gives confidence among B2B buyers thus promoting better purchasing behaviors that enhance the chances of repeat purchasing.
- In addition, the communication enhanced by connected systems permits organizations to participate in essential processes like automation technologies, running with artificial intelligence (AI) functions, automating recurrent activities, and facilitating decision-making processes with intelligent, analytical, and learning capacities.
- In other words, through integration with enterprise systems in the B2B mobile commerce market, there is understanding of connectivity and collaboration as a key factor towards attaining optimal organizational performance and offering high value to the consumer in a rapidly accelerating connected environment.
B2B Mobile Commerce Market Segment Analysis:
B2B Mobile Commerce Market Segmented based on by Application, and by Product.
By Application, Small Businesses segment is expected to dominate the market during the forecast period.
- In the vast solution area of B2B mobile commerce, all sizes of applications are available which address the needs of each kind of business separately.
- To the small businesses, it is very useful to undertake the B2B mobile commerce applications as they assist in procurement and inventory control as well as the contacts to the suppliers and distributors. They usually come with convenient graphic user interfaces, easy payment methods, and a capacity to expand, which allows retail firms and small business players to level up their competition within digital markets without having to invest too much on overhead.
- For B2B m-commerce applications, value creation can be derived from the improved customization to the existing systems and business functionalities, as well as the enabling of advanced analytics for midsized businesses. These applications assist midsized businesses to manage supply chain, to analyze the tendencies of purchasing and to build successful sources of supply, thereby promoting growth and profitability in the framework of competitive prerequisites.
- B2B Mobile commerce strategic applications constitute a strategic part of enterprise systems architecture, interrelating with ERP, CRM, and other support systems in large businesses. These applications support all enabler processes in procurement all the way from initiating to a procurement event, allow real-time collaboration with the vendors and clients and leverage data analytics for decision-making for large businesses, ensuring they continue to be agile and innovative as they grow big.
- To sum, B2B mobile commerce applications help all sizes of companies, deliver customizations to the available features and functionalities of m-commerce solutions that suit their needs and help them grow and succeed in the contemporary and globalized economic landscape.
By Product, Native Mobile Commerce Apps segment held the largest share in 2024
- Among all the trends in the ever-growing market of B2B mobile commerce, native mobile commerce applications have been identified as an essential product accelerating business performance, establishing relationships, and expanding markets.The native application for mobile commerce enables the business to have an exclusive domain through which it will be easy to sell products to the buyers or even the B2B clients by offering a platform where customers can be provided with what they desire in terms of experience and product usage. They are developed deliberately for mobile platforms with the primary focus on benefiting from particular features of the operating systems such as Apple’s IOS and the Android systems, offering easy to use interfaces designs for the mobile applications.
- For B2B sellers, native mobile commerce apps allow clients to access their product catalogs and detailed information on prices and customer profiles directly from their mobile devices, and such features help salespeople to respond promptly to their clients and complete orders quickly while developing a strong rapport with them. Besides, these apps may also interact with the backend functions such as ERP and CRM to update the inventory control, order, and others or provide customers support in real time.
- From the buyer’s side, NMCommerce apps provide greater convenience, options, and usability as with NMCommerce apps, they are able to search for products, make purchases and follow delivery status at their own convenience. Other related features like push notifications, that implements individual recommendations and in-app messaging enhances the overall purchasing experience to ensure continuity as well as consumer loyalty.
- In sum, native mobile commerce apps are crucial in the market in sustaining innovation and competitiveness of the B2B mobile commerce market through enhancing the business competition and prepared them for change that view customer’s expectations, opportunities that are shaping a new business environment through centralization and digitization.
B2B Mobile Commerce Market Regional Insights:
Asia Pacific region accounted for the largest market share and also witnessed the fastest growth Rate.
- Among all the regions in the world, the Asia Pacific region takes the biggest market share in the B2B mobile commerce market and grows rapidly due to the growing use of the e-commerce platforms among B2B enterprises.
- This growth is attributed to factors such as the increased business environment in the region by Anticipated SMEs: B2B companies are likely to benefit immensely from the digital economy to expand and enhance competitiveness. Due to skyrocketing sales of smartphone devices and access to internet services, there has been increased adoption of mobile commerce among the business entities in the Asia Pacific region in order to enhance procurement flows, reach to new customers and establish partnerships beyond borders.
- Furthermore, there are several developing countries in the Asia Pacific region, which are active in the manufacturing and trading business, to satisfy the needs of B2B mobile commerce for efficient and effective transaction and to improve the business relationship between suppliers, distributors, and buyers.
- Besides this, the improved legal conditions granted for the adoption of digitalization and investment opportunities in infrastructural development have helped to foster a conducive environment to B2B mobile commerce in the region as it has influenced business organisations to adopt technology advanced strategies in the noble course of innovation and progression for sustainable development.
- Consequently, the region of Asia pacific retains to be a global of various opportunities for B2B mobile commerce providers hence immense potential market expansion and revenues generation as the behavior and dynamics of the market changes.
Active Key Players in the B2B Mobile Commerce Market
- Retalo (Germany)
- Handshake Corp. (United States)
- DreamingCode (United States)
- Contalog (India)
- GoECart (United States)
- Insite Software (United States)
- 3dcart (United States)
- PrestaShop (France)
- BigCommerce (United States)
- WOOCOMMERCE (United States)
- Shopify (Canada)
- Magento (United States)
- Other Active Players
|
Global B2B Mobile Commerce Market |
|||
|
Base Year: |
2024 |
Forecast Period: |
2025-2032 |
|
Historical Data: |
2018 to 2023 |
Market Size in 2024: |
USD 23.05 Bn. |
|
Forecast Period 2024-32 CAGR: |
17.6% |
Market Size in 2032: |
USD 84.32 Bn. |
|
Segments Covered: |
By Application |
|
|
|
By Product |
|
||
|
By Region |
|
||
|
Key Market Drivers: |
|
||
|
Key Market Restraints: |
|
||
|
Key Opportunities: |
|
||
|
Companies Covered in the report: |
|
||
Chapter 1: Introduction
1.1 Scope and Coverage
Chapter 2:Executive Summary
Chapter 3: Market Landscape
3.1 Market Dynamics
3.1.1 Drivers
3.1.2 Restraints
3.1.3 Opportunities
3.1.4 Challenges
3.2 Market Trend Analysis
3.3 PESTLE Analysis
3.4 Porter's Five Forces Analysis
3.5 Industry Value Chain Analysis
3.6 Ecosystem
3.7 Regulatory Landscape
3.8 Price Trend Analysis
3.9 Patent Analysis
3.10 Technology Evolution
3.11 Investment Pockets
3.12 Import-Export Analysis
Chapter 4: B2B Mobile Commerce Market by Application (2018-2032)
4.1 B2B Mobile Commerce Market Snapshot and Growth Engine
4.2 Market Overview
4.3 Small Businesses
4.3.1 Introduction and Market Overview
4.3.2 Historic and Forecasted Market Size in Value USD and Volume Units
4.3.3 Key Market Trends, Growth Factors, and Opportunities
4.3.4 Geographic Segmentation Analysis
4.4 Midsized Businesses
4.5 Large Businesses
Chapter 5: B2B Mobile Commerce Market by Product (2018-2032)
5.1 B2B Mobile Commerce Market Snapshot and Growth Engine
5.2 Market Overview
5.3 Native Mobile Commerce Apps
5.3.1 Introduction and Market Overview
5.3.2 Historic and Forecasted Market Size in Value USD and Volume Units
5.3.3 Key Market Trends, Growth Factors, and Opportunities
5.3.4 Geographic Segmentation Analysis
5.4 Other
Chapter 6: Company Profiles and Competitive Analysis
6.1 Competitive Landscape
6.1.1 Competitive Benchmarking
6.1.2 B2B Mobile Commerce Market Share by Manufacturer (2024)
6.1.3 Industry BCG Matrix
6.1.4 Heat Map Analysis
6.1.5 Mergers and Acquisitions
6.2 TOBII AB (SWEDEN)
6.2.1 Company Overview
6.2.2 Key Executives
6.2.3 Company Snapshot
6.2.4 Role of the Company in the Market
6.2.5 Sustainability and Social Responsibility
6.2.6 Operating Business Segments
6.2.7 Product Portfolio
6.2.8 Business Performance
6.2.9 Key Strategic Moves and Recent Developments
6.2.10 SWOT Analysis
6.3 SENSOMOTORIC INSTRUMENTS (GERMANY)
6.4 SR RESEARCH (CANADA)
6.5 SEEING MACHINES (AUSTRALIA)
6.6 EYETRACKING (US)
6.7 PRS IN VIVO (US)
6.8 SMART EYE AB (SWEDEN)
6.9 LC TECHNOLOGIES (US)
6.10 ERGONEERS GMBH (GERMANY)
6.11 EYETECH DIGITAL SYSTEMS (US)
Chapter 7: Global B2B Mobile Commerce Market By Region
7.1 Overview
7.2. North America B2B Mobile Commerce Market
7.2.1 Key Market Trends, Growth Factors and Opportunities
7.2.2 Top Key Companies
7.2.3 Historic and Forecasted Market Size by Segments
7.2.4 Historic and Forecasted Market Size by Application
7.2.4.1 Small Businesses
7.2.4.2 Midsized Businesses
7.2.4.3 Large Businesses
7.2.5 Historic and Forecasted Market Size by Product
7.2.5.1 Native Mobile Commerce Apps
7.2.5.2 Other
7.2.6 Historic and Forecast Market Size by Country
7.2.6.1 US
7.2.6.2 Canada
7.2.6.3 Mexico
7.3. Eastern Europe B2B Mobile Commerce Market
7.3.1 Key Market Trends, Growth Factors and Opportunities
7.3.2 Top Key Companies
7.3.3 Historic and Forecasted Market Size by Segments
7.3.4 Historic and Forecasted Market Size by Application
7.3.4.1 Small Businesses
7.3.4.2 Midsized Businesses
7.3.4.3 Large Businesses
7.3.5 Historic and Forecasted Market Size by Product
7.3.5.1 Native Mobile Commerce Apps
7.3.5.2 Other
7.3.6 Historic and Forecast Market Size by Country
7.3.6.1 Russia
7.3.6.2 Bulgaria
7.3.6.3 The Czech Republic
7.3.6.4 Hungary
7.3.6.5 Poland
7.3.6.6 Romania
7.3.6.7 Rest of Eastern Europe
7.4. Western Europe B2B Mobile Commerce Market
7.4.1 Key Market Trends, Growth Factors and Opportunities
7.4.2 Top Key Companies
7.4.3 Historic and Forecasted Market Size by Segments
7.4.4 Historic and Forecasted Market Size by Application
7.4.4.1 Small Businesses
7.4.4.2 Midsized Businesses
7.4.4.3 Large Businesses
7.4.5 Historic and Forecasted Market Size by Product
7.4.5.1 Native Mobile Commerce Apps
7.4.5.2 Other
7.4.6 Historic and Forecast Market Size by Country
7.4.6.1 Germany
7.4.6.2 UK
7.4.6.3 France
7.4.6.4 The Netherlands
7.4.6.5 Italy
7.4.6.6 Spain
7.4.6.7 Rest of Western Europe
7.5. Asia Pacific B2B Mobile Commerce Market
7.5.1 Key Market Trends, Growth Factors and Opportunities
7.5.2 Top Key Companies
7.5.3 Historic and Forecasted Market Size by Segments
7.5.4 Historic and Forecasted Market Size by Application
7.5.4.1 Small Businesses
7.5.4.2 Midsized Businesses
7.5.4.3 Large Businesses
7.5.5 Historic and Forecasted Market Size by Product
7.5.5.1 Native Mobile Commerce Apps
7.5.5.2 Other
7.5.6 Historic and Forecast Market Size by Country
7.5.6.1 China
7.5.6.2 India
7.5.6.3 Japan
7.5.6.4 South Korea
7.5.6.5 Malaysia
7.5.6.6 Thailand
7.5.6.7 Vietnam
7.5.6.8 The Philippines
7.5.6.9 Australia
7.5.6.10 New Zealand
7.5.6.11 Rest of APAC
7.6. Middle East & Africa B2B Mobile Commerce Market
7.6.1 Key Market Trends, Growth Factors and Opportunities
7.6.2 Top Key Companies
7.6.3 Historic and Forecasted Market Size by Segments
7.6.4 Historic and Forecasted Market Size by Application
7.6.4.1 Small Businesses
7.6.4.2 Midsized Businesses
7.6.4.3 Large Businesses
7.6.5 Historic and Forecasted Market Size by Product
7.6.5.1 Native Mobile Commerce Apps
7.6.5.2 Other
7.6.6 Historic and Forecast Market Size by Country
7.6.6.1 Turkiye
7.6.6.2 Bahrain
7.6.6.3 Kuwait
7.6.6.4 Saudi Arabia
7.6.6.5 Qatar
7.6.6.6 UAE
7.6.6.7 Israel
7.6.6.8 South Africa
7.7. South America B2B Mobile Commerce Market
7.7.1 Key Market Trends, Growth Factors and Opportunities
7.7.2 Top Key Companies
7.7.3 Historic and Forecasted Market Size by Segments
7.7.4 Historic and Forecasted Market Size by Application
7.7.4.1 Small Businesses
7.7.4.2 Midsized Businesses
7.7.4.3 Large Businesses
7.7.5 Historic and Forecasted Market Size by Product
7.7.5.1 Native Mobile Commerce Apps
7.7.5.2 Other
7.7.6 Historic and Forecast Market Size by Country
7.7.6.1 Brazil
7.7.6.2 Argentina
7.7.6.3 Rest of SA
Chapter 8 Analyst Viewpoint and Conclusion
8.1 Recommendations and Concluding Analysis
8.2 Potential Market Strategies
Chapter 9 Research Methodology
9.1 Research Process
9.2 Primary Research
9.3 Secondary Research
|
Global B2B Mobile Commerce Market |
|||
|
Base Year: |
2024 |
Forecast Period: |
2025-2032 |
|
Historical Data: |
2018 to 2023 |
Market Size in 2024: |
USD 23.05 Bn. |
|
Forecast Period 2024-32 CAGR: |
17.6% |
Market Size in 2032: |
USD 84.32 Bn. |
|
Segments Covered: |
By Application |
|
|
|
By Product |
|
||
|
By Region |
|
||
|
Key Market Drivers: |
|
||
|
Key Market Restraints: |
|
||
|
Key Opportunities: |
|
||
|
Companies Covered in the report: |
|
||


