


Aquaculture Therapeutics Market Synopsis
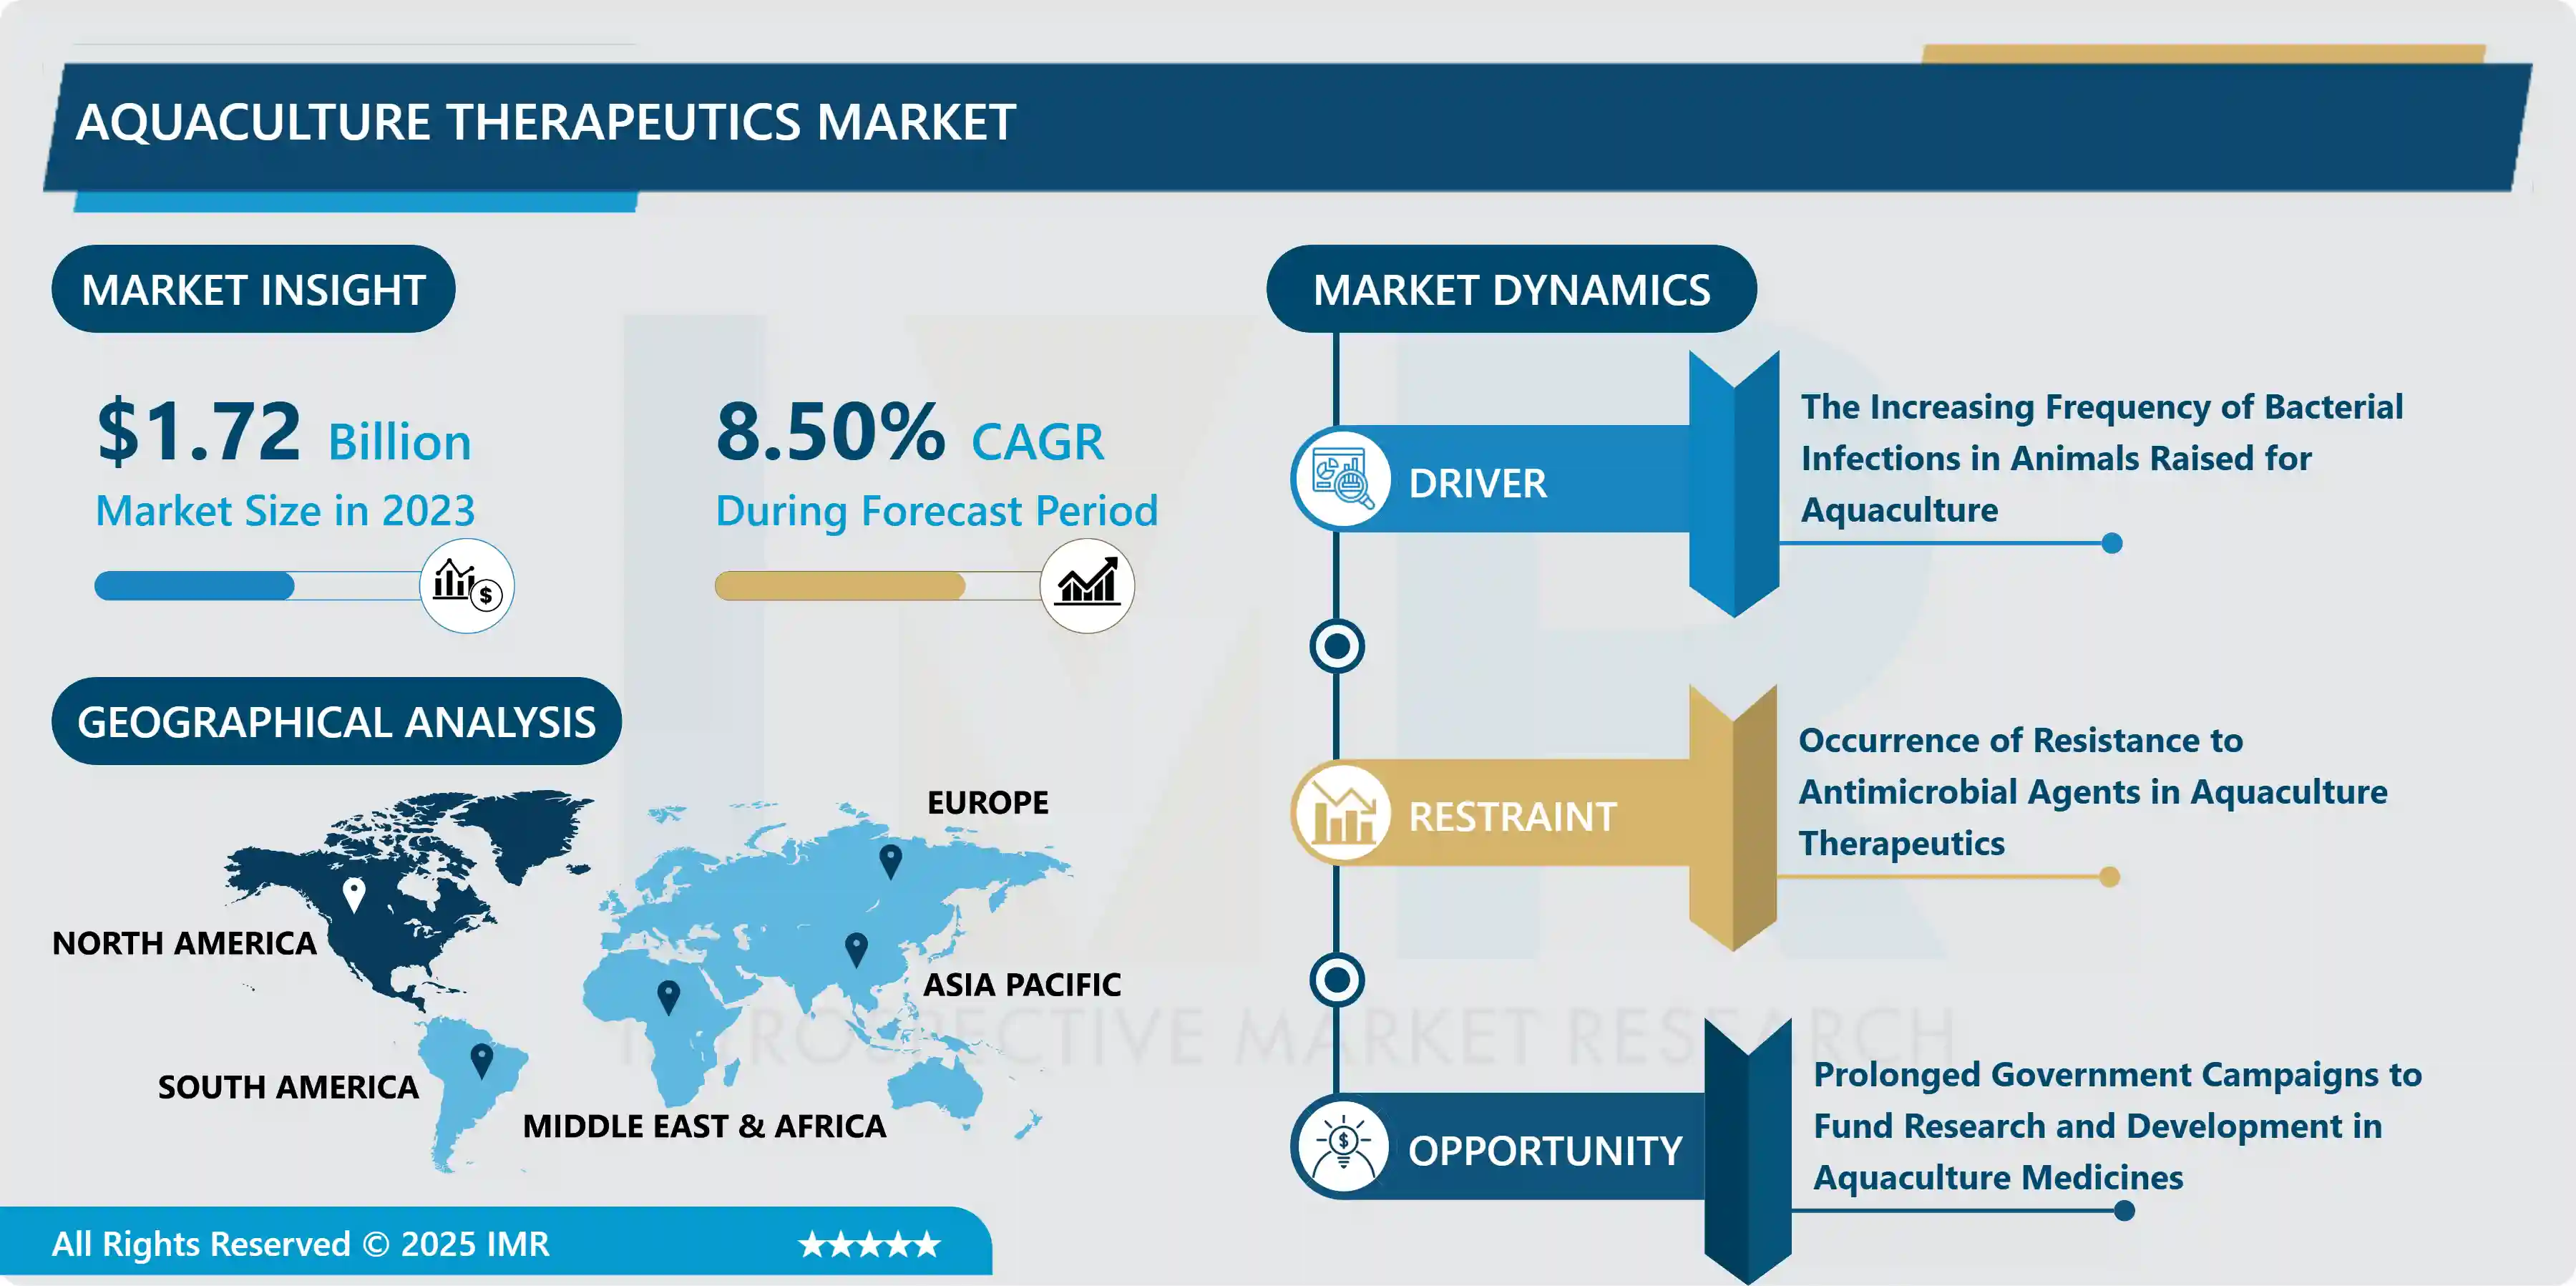
Aquaculture Therapeutics Market Size Was Valued at USD 1.72 Billion in 2023, and is Projected to Reach 3.58 USD Billion by 2032, Growing at a CAGR of 8.5 % From 2024-2032.
Aquaculture refers to the farming of aquatic organisms, such as fish, shellfish, and aquatic plants, under controlled conditions. It involves cultivating freshwater and saltwater species for commercial, recreational, and conservation purposes. Aquaculture plays a crucial role in meeting the growing demand for seafood, reducing pressure on wild fish populations, and supporting food security.
Aquaculture Therapeutics, also known as aqua therapy or hydrotherapy, uses water for therapeutic purposes. It can be beneficial for physical and mental health conditions. Aquatic therapy aids in physical rehabilitation by reducing joint impact, improving mobility, and reducing stress. It also contributes to mental health by calming the mind through swimming and water exercises. Aquatic therapy can also be beneficial for individuals with autism spectrum disorders, as the sensory experience and structured activities in a controlled aquatic environment can be therapeutic. Additionally, aquatic exercise offers a low-impact option for improving fitness and overall well-being.
Aquatic therapy offers low-impact exercise due to water's buoyancy, which reduces joint impact, making it beneficial for those with joint pain, arthritis, or recovering from surgery. It also promotes flexibility and muscle strength due to its resistance. Water's therapeutic properties, including buoyancy, hydrostatic pressure, and warmth, can alleviate pain and promote relaxation. Aquatic therapy is accessible to a wide range of individuals, including those with difficulty with traditional exercise. Additionally, water has been linked to mental health benefits like stress reduction and improved mood.
 Aquaculture Therapeutics Market Trend Analysis:
The Increasing Frequency of Bacterial Infections in Animals Raised for Aquaculture
- The Aquaculture Therapeutics market is experiencing substantial growth, propelled by the heightened prevalence of bacterial infections in animals bred for aquaculture, emerging as a pivotal driver. These infections pose a significant risk to the well-being and efficiency of aquaculture species, resulting in financial setbacks for farmers and potential concerns regarding food safety. To combat this challenge, there is an increasing focus on developing therapeutic interventions within the aquaculture sector.
- The surge in bacterial infections has stimulated research and ingenuity in aquaculture therapeutics, seeking to address health issues in a precise and sustainable manner. Concerns about antibiotic resistance in traditional animal farming practices have further emphasized the necessity for alternative solutions in aquaculture. Consequently, the Aquaculture Therapeutics market is experiencing a rise in investments directed towards creating innovative treatments, encompassing vaccines, probiotics, and additional biosecurity measures. These advancements not only contribute to the general health and prosperity of aquatic species but also align with the industry's overarching objectives of fostering sustainability and mitigating the environmental impact of aquaculture practices. Essentially, the escalating occurrence of bacterial infections in aquaculture animals acts as a stimulant for the expansion of the Aquaculture Therapeutics market, propelling both inventive solutions and economic development within the sector.
Prolonged Government Campaigns to Fund Research and Development in Aquaculture Medicines
- Governments worldwide are acknowledging the pivotal role of aquaculture in securing food supplies, fostering economic progress, and relieving strain on wild fish populations. Consequently, there is a growing trend of increased investment in initiatives that stimulate innovation within the aquaculture sector, with a specific focus on allocating resources for the research and development of aquaculture medicines. This strategic funding aims to tackle challenges such as disease management, antibiotic resistance, and the overall health enhancement of aquaculture species.
- Government-led campaigns not only provide financial support for scientific progress but also establish an environment conducive to collaboration among researchers, industry stakeholders, and regulatory bodies. This collaborative approach nurtures the creation of impactful and sustainable aquaculture medicines, including therapeutic interventions designed to combat diseases and uplift the general health of aquatic species. The enduring nature of these campaigns ensures that the aquaculture industry possesses the requisite resources and incentives to consistently refine its practices, fostering innovation and contributing to the market's expansion. Ultimately, the alignment of governmental support with the goals of sustainable aquaculture positions the industry for increased resilience and growth.
Aquaculture Therapeutics Market Segment Analysis:
Aquaculture Therapeutics Market is Segmented Based on By Type and Application
By Type, Oxytetracycline Segment Is Expected to Dominate the Market During the Forecast Period
- The dominance of the oxytetracycline segment in the market is anticipated, driven by its extensive usage and effectiveness in aquaculture. Oxytetracycline recognized as a broad-spectrum antibiotic, is widely applied in the aquaculture sector for treating and preventing bacterial infections in fish and other aquatic organisms. Its broad applicability, reasonable cost, and proven efficacy contribute significantly to its elevated standing in the market.
- Oxytetracycline's effectiveness against diverse bacterial pathogens makes it a preferred choice for aquaculture farmers seeking dependable solutions for disease management. With bacterial infections posing a persistent threat to aquaculture species, the demand for oxytetracycline is expected to remain robust, consolidating its dominance in the aquaculture therapeutics market. The prominence of this segment underscores the pivotal role of antibiotics like oxytetracycline in ensuring the health and sustainability of aquaculture practices.
By Application, Veterinary Clinics Segment Held the Largest Share of 40.10% In 2022
- The veterinary clinics segment has positioned itself as the market leader, securing the largest share, owing to its crucial role in delivering aquaculture therapeutics. Serving as pivotal centers for the diagnosis, treatment, and prevention of diseases in aquatic species, veterinary clinics offer specialized care tailored to the distinctive needs of aquaculture.
- These clinics play a vital role in providing expert guidance on the application of therapeutics, encompassing antibiotics, vaccines, and other medicinal solutions, ensuring the optimal health and well-being of aquaculture populations. As the health challenges faced by aquaculture farms become more intricate, the demand for veterinary clinics has seen a substantial rise. The accessibility of professional advice and tailored therapeutic solutions establishes veterinary clinics as frontrunners in the aquaculture therapeutics market, making them the preferred choice for farmers seeking comprehensive healthcare services for their aquatic organisms.
Aquaculture Therapeutics Market Regional Insights:
North America is Expected to Dominate the Market Over the Forecast Period
- The region's strong market standing is a result of advanced infrastructure, significant investments in research and development, and a well-established aquaculture sector. The presence of prominent pharmaceutical and biotechnology companies specializing in aquatic health further enhances North America's dominance. Stringent regulatory frameworks play a crucial role in ensuring the quality and safety of aquaculture therapeutics.
- North America's dedication to sustainable aquaculture practices and ongoing technological innovation positions it as a frontrunner in the global market. With a growing focus on health and wellness, the region's demand for effective aquaculture therapeutics is anticipated to remain robust, reinforcing its leading role in the industry. The combination of robust infrastructure, research capabilities, and a commitment to industry best practices establishes North America as a dominant force in the evolving landscape of aquaculture therapeutics.
Key Players Covered in Aquaculture Therapeutics Market:
- TunaTech GmbH (Germany)
- ViAqua Therapeutics Ltd. (Israel)
- Alpharma Inc. (U.S.)
- Blue Ridge Aquaculture (U.S.)
- Cermaq ASA (Norway)
- Cooke Aquaculture (Canada)
- Nireus Aquaculture S.A. (Greece)
- Tassal Group Ltd. (Australia)
- Unima Group (Mexico)
- Nutreco Holding N.V. (Netherlands)
- Kona Bay Marine Resources (U.S.)
- Royal Greenland A/S (Denmark)
- Sea Watch International Ltd. (U.S.)
- Selonda Aquaculture S.A. (Greece)
- StarKist Taylor Shellfish Inc. (U.S.)
- TriMarine International (U.S.)
- AquaBounty Technologies, Inc. (U.S.)
- Benchmark Holdings PLC (UK)
- Elanco Animal Health Incorporated (U.S.)
- Zoetis Inc. (U.S.), and Other Major Players
Key Industry Development in The Aquaculture Therapeutics Market:
- In September 2023, ViAqua Therapeutics, a biotechnology company and developer of an orally administered RNA-particle platform to promote and improve animal health in aquaculture, announced it has completed a US$8.25M round led by S2G Ventures with participation from Rabo Ventures, The Trendlines Group Ltd., Agriline Limited, Nutreco, I-Lab Angels and Circle Investments LLC.
|
Aquaculture Therapeutics Market |
|||
|
Base Year: |
2023 |
Forecast Period: |
2024-2032 |
|
Historical Data: |
2017 to 2023 |
Market Size in 2023: |
USD 1.72 Bn. |
|
Forecast Period 2024-32 CAGR: |
8.5% |
Market Size in 2032: |
USD 3.58 Bn. |
|
Segments Covered: |
By Type |
|
|
|
By Application |
|
||
|
By Region |
|
||
|
Key Market Drivers: |
|
||
|
Key Market Restraints: |
|
||
|
Key Opportunities: |
|
||
|
Companies Covered in the report: |
|
||
Chapter 1: Introduction
1.1 Scope and Coverage
Chapter 2:Executive Summary
Chapter 3: Market Landscape
3.1 Market Dynamics
3.1.1 Drivers
3.1.2 Restraints
3.1.3 Opportunities
3.1.4 Challenges
3.2 Market Trend Analysis
3.3 PESTLE Analysis
3.4 Porter's Five Forces Analysis
3.5 Industry Value Chain Analysis
3.6 Ecosystem
3.7 Regulatory Landscape
3.8 Price Trend Analysis
3.9 Patent Analysis
3.10 Technology Evolution
3.11 Investment Pockets
3.12 Import-Export Analysis
Chapter 4: Aquaculture Therapeutics Market by Type (2018-2032)
4.1 Aquaculture Therapeutics Market Snapshot and Growth Engine
4.2 Market Overview
4.3 Chorionic Gonadotropin
4.3.1 Introduction and Market Overview
4.3.2 Historic and Forecasted Market Size in Value USD and Volume Units
4.3.3 Key Market Trends, Growth Factors, and Opportunities
4.3.4 Geographic Segmentation Analysis
4.4 Formalin Solution
4.5 Florfenicol
4.6 Oxytetracycline
4.7 Tricaine Methane Sulfonate
4.8 Others
Chapter 5: Aquaculture Therapeutics Market by Application (2018-2032)
5.1 Aquaculture Therapeutics Market Snapshot and Growth Engine
5.2 Market Overview
5.3 Veterinary Pharmacies
5.3.1 Introduction and Market Overview
5.3.2 Historic and Forecasted Market Size in Value USD and Volume Units
5.3.3 Key Market Trends, Growth Factors, and Opportunities
5.3.4 Geographic Segmentation Analysis
5.4 E-commerce
5.5 Veterinary Clinics
5.6 Veterinary Hospitals
Chapter 6: Company Profiles and Competitive Analysis
6.1 Competitive Landscape
6.1.1 Competitive Benchmarking
6.1.2 Aquaculture Therapeutics Market Share by Manufacturer (2024)
6.1.3 Industry BCG Matrix
6.1.4 Heat Map Analysis
6.1.5 Mergers and Acquisitions
6.2 CORTEVA AGRISCIENCE (U.S.)
6.2.1 Company Overview
6.2.2 Key Executives
6.2.3 Company Snapshot
6.2.4 Role of the Company in the Market
6.2.5 Sustainability and Social Responsibility
6.2.6 Operating Business Segments
6.2.7 Product Portfolio
6.2.8 Business Performance
6.2.9 Key Strategic Moves and Recent Developments
6.2.10 SWOT Analysis
6.3 BECK'S HYBRIDS (U.S.)
6.4 HARRIS SEEDS (U.S.)
6.5 FMC CORPORATION (U.S.)
6.6 JOHNNY'S SELECTED SEEDS (U.S.)
6.7 DL SEEDS (CANADA)
6.8 SYNGENTA (SWITZERLAND)
6.9 BAYER CROPSCIENCE AG (GERMANY)
6.10 LIMAGRAIN (FRANCE)
6.11 BASF SE (GERMANY)
6.12 DLF (DENMARK)
6.13 KWS SAAT SE & CO. KGAA (GERMANY)
6.14 MAHYCO SEEDS (INDIA)
6.15 NATH BIO-GENES (I) LTD (INDIA)
6.16 ADVANTA SEEDS (INDIA)
6.17 KAVERI SEEDS (INDIA)
6.18 MAY SEEDS (TURKEY)
6.19 SAKATA SEED CORPORATION (JAPAN)
6.20 PACIFIC SEEDS (AUSTRALIA)
6.21 CHINA NATIONAL SEED (CHINA)
6.22
Chapter 7: Global Aquaculture Therapeutics Market By Region
7.1 Overview
7.2. North America Aquaculture Therapeutics Market
7.2.1 Key Market Trends, Growth Factors and Opportunities
7.2.2 Top Key Companies
7.2.3 Historic and Forecasted Market Size by Segments
7.2.4 Historic and Forecasted Market Size by Type
7.2.4.1 Chorionic Gonadotropin
7.2.4.2 Formalin Solution
7.2.4.3 Florfenicol
7.2.4.4 Oxytetracycline
7.2.4.5 Tricaine Methane Sulfonate
7.2.4.6 Others
7.2.5 Historic and Forecasted Market Size by Application
7.2.5.1 Veterinary Pharmacies
7.2.5.2 E-commerce
7.2.5.3 Veterinary Clinics
7.2.5.4 Veterinary Hospitals
7.2.6 Historic and Forecast Market Size by Country
7.2.6.1 US
7.2.6.2 Canada
7.2.6.3 Mexico
7.3. Eastern Europe Aquaculture Therapeutics Market
7.3.1 Key Market Trends, Growth Factors and Opportunities
7.3.2 Top Key Companies
7.3.3 Historic and Forecasted Market Size by Segments
7.3.4 Historic and Forecasted Market Size by Type
7.3.4.1 Chorionic Gonadotropin
7.3.4.2 Formalin Solution
7.3.4.3 Florfenicol
7.3.4.4 Oxytetracycline
7.3.4.5 Tricaine Methane Sulfonate
7.3.4.6 Others
7.3.5 Historic and Forecasted Market Size by Application
7.3.5.1 Veterinary Pharmacies
7.3.5.2 E-commerce
7.3.5.3 Veterinary Clinics
7.3.5.4 Veterinary Hospitals
7.3.6 Historic and Forecast Market Size by Country
7.3.6.1 Russia
7.3.6.2 Bulgaria
7.3.6.3 The Czech Republic
7.3.6.4 Hungary
7.3.6.5 Poland
7.3.6.6 Romania
7.3.6.7 Rest of Eastern Europe
7.4. Western Europe Aquaculture Therapeutics Market
7.4.1 Key Market Trends, Growth Factors and Opportunities
7.4.2 Top Key Companies
7.4.3 Historic and Forecasted Market Size by Segments
7.4.4 Historic and Forecasted Market Size by Type
7.4.4.1 Chorionic Gonadotropin
7.4.4.2 Formalin Solution
7.4.4.3 Florfenicol
7.4.4.4 Oxytetracycline
7.4.4.5 Tricaine Methane Sulfonate
7.4.4.6 Others
7.4.5 Historic and Forecasted Market Size by Application
7.4.5.1 Veterinary Pharmacies
7.4.5.2 E-commerce
7.4.5.3 Veterinary Clinics
7.4.5.4 Veterinary Hospitals
7.4.6 Historic and Forecast Market Size by Country
7.4.6.1 Germany
7.4.6.2 UK
7.4.6.3 France
7.4.6.4 The Netherlands
7.4.6.5 Italy
7.4.6.6 Spain
7.4.6.7 Rest of Western Europe
7.5. Asia Pacific Aquaculture Therapeutics Market
7.5.1 Key Market Trends, Growth Factors and Opportunities
7.5.2 Top Key Companies
7.5.3 Historic and Forecasted Market Size by Segments
7.5.4 Historic and Forecasted Market Size by Type
7.5.4.1 Chorionic Gonadotropin
7.5.4.2 Formalin Solution
7.5.4.3 Florfenicol
7.5.4.4 Oxytetracycline
7.5.4.5 Tricaine Methane Sulfonate
7.5.4.6 Others
7.5.5 Historic and Forecasted Market Size by Application
7.5.5.1 Veterinary Pharmacies
7.5.5.2 E-commerce
7.5.5.3 Veterinary Clinics
7.5.5.4 Veterinary Hospitals
7.5.6 Historic and Forecast Market Size by Country
7.5.6.1 China
7.5.6.2 India
7.5.6.3 Japan
7.5.6.4 South Korea
7.5.6.5 Malaysia
7.5.6.6 Thailand
7.5.6.7 Vietnam
7.5.6.8 The Philippines
7.5.6.9 Australia
7.5.6.10 New Zealand
7.5.6.11 Rest of APAC
7.6. Middle East & Africa Aquaculture Therapeutics Market
7.6.1 Key Market Trends, Growth Factors and Opportunities
7.6.2 Top Key Companies
7.6.3 Historic and Forecasted Market Size by Segments
7.6.4 Historic and Forecasted Market Size by Type
7.6.4.1 Chorionic Gonadotropin
7.6.4.2 Formalin Solution
7.6.4.3 Florfenicol
7.6.4.4 Oxytetracycline
7.6.4.5 Tricaine Methane Sulfonate
7.6.4.6 Others
7.6.5 Historic and Forecasted Market Size by Application
7.6.5.1 Veterinary Pharmacies
7.6.5.2 E-commerce
7.6.5.3 Veterinary Clinics
7.6.5.4 Veterinary Hospitals
7.6.6 Historic and Forecast Market Size by Country
7.6.6.1 Turkiye
7.6.6.2 Bahrain
7.6.6.3 Kuwait
7.6.6.4 Saudi Arabia
7.6.6.5 Qatar
7.6.6.6 UAE
7.6.6.7 Israel
7.6.6.8 South Africa
7.7. South America Aquaculture Therapeutics Market
7.7.1 Key Market Trends, Growth Factors and Opportunities
7.7.2 Top Key Companies
7.7.3 Historic and Forecasted Market Size by Segments
7.7.4 Historic and Forecasted Market Size by Type
7.7.4.1 Chorionic Gonadotropin
7.7.4.2 Formalin Solution
7.7.4.3 Florfenicol
7.7.4.4 Oxytetracycline
7.7.4.5 Tricaine Methane Sulfonate
7.7.4.6 Others
7.7.5 Historic and Forecasted Market Size by Application
7.7.5.1 Veterinary Pharmacies
7.7.5.2 E-commerce
7.7.5.3 Veterinary Clinics
7.7.5.4 Veterinary Hospitals
7.7.6 Historic and Forecast Market Size by Country
7.7.6.1 Brazil
7.7.6.2 Argentina
7.7.6.3 Rest of SA
Chapter 8 Analyst Viewpoint and Conclusion
8.1 Recommendations and Concluding Analysis
8.2 Potential Market Strategies
Chapter 9 Research Methodology
9.1 Research Process
9.2 Primary Research
9.3 Secondary Research
|
Aquaculture Therapeutics Market |
|||
|
Base Year: |
2023 |
Forecast Period: |
2024-2032 |
|
Historical Data: |
2017 to 2023 |
Market Size in 2023: |
USD 1.72 Bn. |
|
Forecast Period 2024-32 CAGR: |
8.5% |
Market Size in 2032: |
USD 3.58 Bn. |
|
Segments Covered: |
By Type |
|
|
|
By Application |
|
||
|
By Region |
|
||
|
Key Market Drivers: |
|
||
|
Key Market Restraints: |
|
||
|
Key Opportunities: |
|
||
|
Companies Covered in the report: |
|
||
Frequently Asked Questions :
The forecast period in the market research report is 2024-2032.
The Aquaculture Therapeutics market is segmented into application type, product type and region. By Application type, the market is categorized into Veterinary Pharmacies, Veterinary Hospitals, E-Commerce, Veterinary Clinics. By product type, it is classified into Formalin Solution, Chorionic Gonadotropin, Florfenicol, Tricaine Methane Sulfonate, Oxytetracycline, Hydrogen Peroxide and others. By region, it is analysed across North America (U.S.; Canada; Mexico), Europe (Germany; U.K.; France; Italy; Russia; Spain etc.), Asia-Pacific (China; India; Japan; Southeast Asia etc.), South America (Brazil; Argentina etc.), Middle East & Africa (Saudi Arabia; South Africa etc.).


