


Account Receivable Automation Market Synopsis
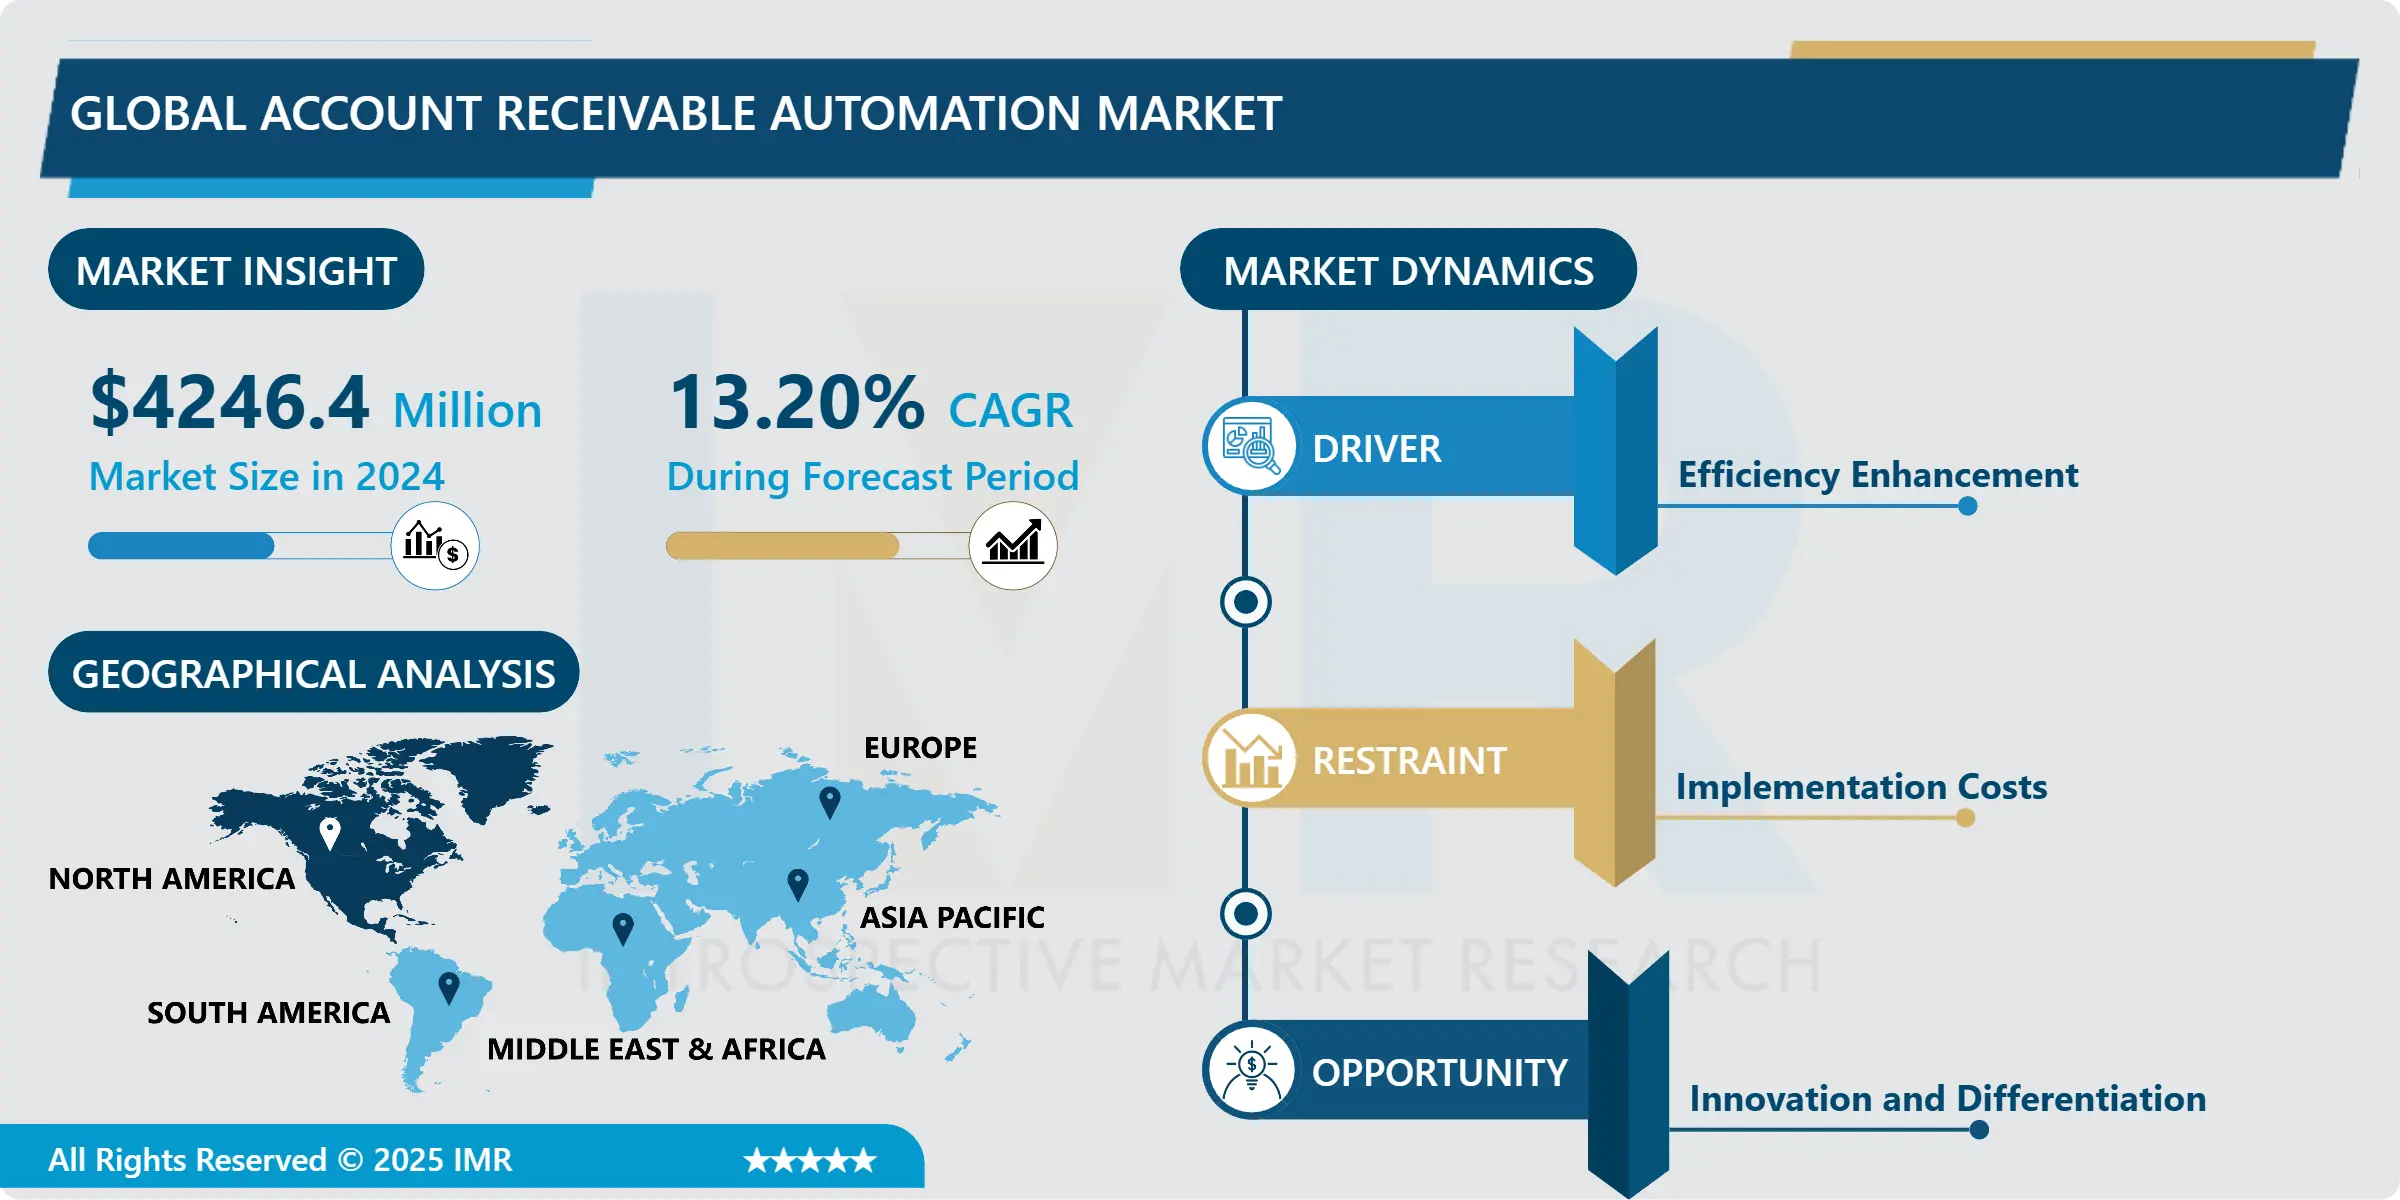
Account Receivable Automation Market Size Was Valued at USD 4246.4 Million in 2024, and is Projected to Reach USD 11449.65 Million by 2032, Growing at a CAGR of 13.20% From 2025-2032.
The Account Receivable Automation Market refers to the segment of the financial technology industry dedicated to streamlining and optimizing the processes involved in managing and processing accounts receivable for businesses. It encompasses a range of software solutions and technologies designed to automate tasks such as invoice generation, payment processing, collections management, and reconciliation. By leveraging artificial intelligence, machine learning, and robotic process automation, companies aim to reduce manual effort, minimize errors, accelerate cash flows, and enhance overall efficiency in managing their receivables, thereby improving their financial health and operational performance.
Account Receivable Automation market is in the course of extreme transition due to increased technological innovations and higher need for efficiency of financial solutions. Due to the growing concern for proper Account Receivables management, it has become important to incorporate automation solutions within businesses. This report analyses this market’s executive summary for the purpose of comprehending trends that influence the market’s growth.
First, it is essential to highlight that there is an ever-increasing demand for cloud-based automations with open access to markets due to positive factors included in the plan with references to the overall flexibility and affordability for business. This is because cloud solutions allow users to gain instant access to their financial information and data which in return increases the rate of decision-making and other activities. Further, through deep incorporation of AI and ML, the receivables management is also under transition in organizations that such algorithms eliminates the need for repetitive tasks, enhances the accuracy of results and helps to identify the best possible strategies for collection of outstanding amounts.
Also, increasing the level of regulation compliance and concerns related to data protection are causing companies to look out for reliable automation solutions that would guarantee compliance to these regulation measures as well as protection of financial data. Since companies are developing strategies to reduce exposure to risks imposed by frauds and cyber attacks, these companies are buying subsystems with a high level of encryption and authentication.
In addition, there is a higher level of market emphasis on the comprehensive outbound and inbound receivables management systems that are aimed at providing the full spectrum of services, including invoicing, payments, collections, and information reporting. These systems make a smooth flow of actions for a user and avoid working and coordinating through different software applications and thus removing the costs of extra manual work.
As a whole, the Account Receivable Automation market continues to be highly favorable for the aspect of solution because companies in all industries look for ways in improving their accounts receivables and subsequently, make improvements on their accounts receivables to cash conversion. However, the implementation hurdles that include, resistance to change as well as the need for expertise to drive and manage automation solutions serves as the major factors of consideration among the market stakeholders. When tackling these issues and leveraging on the opportunities identified, firms may enhance their prospects of continued success and resilience in the receiveables management business environment that is increasing in complexity and dynamics.

Account Receivable Automation Market Trend Analysis
Cloud-Based Solutions Transforming Account Receivable Automation
- Account Receivable Automation is a new concept that signifies a shift of businesses to the cloud for managing their crucial accounts receivable services and operations. The promise of scalability in many cloud-based platforms is one of the main reasons for this kind of pattern. Another compelling advantage of cloud solutions is their ability to scale up or scale down bearing in mind that cloud capacity can quickly be adjusted to meet demands of workload or higher number of transactions without necessarily meaning expensive infrastructure investments to be made. This aspect of scalability is of particular importance to organizations engaged in growth or features with fluctuations since they can easily scale up or down on AR automation resource depending on the business needs for maximum functionality and efficiency.
- The last advantage, which is also worth emphasizing is flexibility of cloud-based AR automation solutions. Some of the disadvantages that are inherent in the on-premise software model include; The program cannot be easily altered to meet other needs of the business or integrated easily with other programs in the business environment. On the other hand, cloud-based platforms tend to be more flexible for businesses to implement methodologies and solutions more flexibly without having them integrated into other business applications or enterprise systems, which can be a rigid concept. It makes organizations leverage opportunities to be more responsive to the changing consumers’ needs, tastes, and preferences and the emerging rules and regulations in the accounts receivable collection and management. In summary, the flexibility, cost control, and scalability of cloud-based AR automation solutions are its main advantages, which may be of interest to numerous organizations looking to enhance their operations’ efficiency in the highly competitive environment of the modern world.
The Impact of AI and ML Integration in Account Receivable Automation
- Artificial Intelligence (AI) and, to a greater extent, Machine Learning (ML) are transforming the Account Receivable Automation by providing abstract levels of reach, effectiveness, and visibility. AI and ML integrated selected automation platforms can provide inputs for rapid analysis of humongous amounts of data leaving no room for manual follow-through and can identify patterns and trends inherent and not easily discernible. Through PMML method, firms can detect payment problems before they transform into disorders, thereby allowing for intervention. Furthermore, these technologies facilitate improved accuracy with respect to forecasting of cash flows thereby providing businesses good insight on them and help the financial health in the business improve.
- In addition, AI and ML are instrumental in an organization’s ability to deliver individualized message delivery to its customers in a way that would help create loyal customers and properly manage its cash inflows. Automation platforms which are integrated with AI can cluster the customers, relying on their payment records, preferences, and behavior, which create a unique approach for interacting with such clients. Not only does this approach make it easier for companies to form more personal relationships with customers but it also has them make payments sooner. Further, AI-based chatbots and smart personal assistants help in engaging customers and respond in real-time to questions, complaints, and to some extent, even handle payments, making collections easier and contributing more effectively to developing a healthy collection on the accounts receivable side as well. In a nutshell, advanced integration of AI and ML technologies is the key that can change the Account Receivable Automation efficiently and bring more benefits for business sectors in terms of risk mitigation and growth.
Account Receivable Automation Market Segment Analysis:
Account Receivable Automation Market is Segmented based on Component, Deployment, By Organization Size and Vertical
By Component, Solutions (Credit Evaluation & Management) segment is expected to dominate the market during the forecast period
- Credit evaluation and management solutions dominate in the Banking and Financial Services sector due to the critical role these solutions play in assessing creditworthiness and managing credit risk. Banks and financial institutions deal with a high volume of credit transactions daily, including loans, credit cards, and other credit products. The need to thoroughly evaluate the creditworthiness of applicants is paramount to mitigate the risk of default and ensure the stability of financial portfolios. These institutions rely heavily on sophisticated credit evaluation tools that utilize advanced algorithms, comprehensive financial data, and predictive analytics to assess the risk profiles of potential borrowers accurately. This proactive approach to credit management not only helps in reducing bad debt but also enhances the institution's ability to offer competitive interest rates and terms, thereby attracting more customers.
- Furthermore, the regulatory landscape in the Banking and Financial Services sector imposes stringent requirements for risk management and reporting. Compliance with these regulations necessitates the use of robust credit evaluation and management systems that can generate detailed risk assessments and maintain accurate records of credit decisions. These systems are essential for meeting the compliance standards set by regulatory bodies such as the Basel Committee on Banking Supervision, which emphasizes the need for effective risk management practices. As a result, the demand for advanced credit evaluation and management solutions is particularly high in this sector, cementing its dominant share. Financial institutions continuously invest in these technologies to enhance their credit risk frameworks, improve decision-making processes, and ensure long-term financial health and regulatory compliance.
By Vertical, IT & Telecom segment held the largest share in 2024
- The IT & Telecom sector commands the largest share in advanced analytics and automation solutions due to the intricate and multifaceted nature of its billing cycles and the sheer volume of its customer base. Companies in this sector often offer a wide range of services, including voice, data, and various digital services, each with its own billing requirements and cycles. Managing such complexity manually is not feasible; hence, the adoption of advanced analytics becomes crucial. These analytics tools help telecom companies make sense of vast amounts of billing data, identifying trends, discrepancies, and opportunities for optimization. By leveraging predictive analytics, companies can forecast customer behaviors, anticipate billing issues, and streamline operations to ensure timely and accurate billing, thus enhancing overall customer satisfaction and reducing churn.
- Automation further solidifies its dominance in the IT & Telecom sector by enabling the efficient handling of repetitive and time-consuming tasks associated with billing and customer management. Automation tools facilitate processes such as invoice generation, payment processing, and account reconciliation, significantly reducing the margin for human error and speeding up the entire billing cycle. This is particularly important in a sector with a large and diverse customer base, where maintaining accuracy and efficiency is crucial for customer retention and regulatory compliance. Moreover, automation allows IT & Telecom companies to scale their operations seamlessly as they grow, ensuring that the billing infrastructure can handle increased demand without compromising on performance. The integration of advanced analytics and automation not only optimizes operational efficiency but also provides valuable insights that drive strategic decision-making, giving companies in this sector a competitive edge.
Account Receivable Automation Market Regional Insights:
North America is Expected to Dominate the Market Over the Forecast period
- North America dominates the accounts receivable (AR) automation market, primarily due to the widespread adoption of advanced financial technologies and the presence of key market players such as Oracle, SAP, and Workday. The U.S. and Canada are at the forefront of this trend, with a significant number of enterprises across various sectors, including manufacturing, retail, healthcare, and finance, actively seeking to optimize their financial processes. These companies are increasingly turning to AR automation to streamline workflows, enhance accuracy, and reduce operational costs. The region's robust technological infrastructure and high internet penetration further facilitate the rapid implementation and integration of these advanced solutions, making North America a leader in AR automation.
- Moreover, the strong emphasis on compliance and regulatory requirements in the U.S. and Canada significantly propels the demand for AR automation solutions. Financial regulations such as the Sarbanes-Oxley Act in the U.S. and the Canadian Anti-Spam Legislation mandate stringent reporting and data accuracy standards, compelling businesses to adopt automation to ensure compliance. Automated AR solutions help organizations maintain transparency and accuracy in financial transactions, thereby reducing the risk of regulatory breaches and associated penalties. Additionally, the ongoing advancements in artificial intelligence and machine learning within the region are continuously enhancing the capabilities of AR automation tools, making them more efficient and reliable. This regulatory landscape, combined with technological innovation, underscores North America's leading position in the AR automation market.
Active Key Players in the Account Receivable Automation Market
- SK Global Software
- Quadient (YayPay Inc.)
- Kofax Inc.
- Workday, Inc.
- Corcentric LLC
- HighRadius Corporation
- Qvalia AB
- MHC Automation
- Bill.com Holdings Inc.
- Comarch SA
- Esker Inc.
- Sage
- SAP
- Oracle
- Bottomline Technologies
- Other Active Players
Key Industry Developments in the Account Receivable Automation Market:
- In December 2023, Paymerang launched its Receivables Automation product, enhancing its finance automation solutions. This new offering streamlines accounts receivable processes, providing real-time cash flow insights, increasing efficiency, and reducing errors. Integrated with Fiserv, it enables card payment acceptance and processing across the U.S. Paymerang CEO Nasser Chanda highlighted the product's role in driving financial efficiency for CFOs and finance teams.
- In June 2023, Oracle NetSuite launched NetSuite Account Reconciliation to automate and streamline balance sheet account reconciliation. Integrated into NetSuite’s cloud ERP suite, this solution leverages Oracle technology to enhance financial statement accuracy, bolster internal controls, and accelerate the financial close process.
|
Global Account Receivable Automation Market |
|||
|
Base Year: |
2024 |
Forecast Period: |
2025-2032 |
|
Historical Data: |
2018 to 2023 |
Market Size in 2024: |
USD 4246.4 Mn. |
|
Forecast Period 2024-32 CAGR: |
13.20% |
Market Size in 2032: |
USD 11449.65 Mn. |
|
Segments Covered: |
By Component |
|
|
|
By Deployment |
|
||
|
By Organization Size |
|
||
|
By Vertical |
|
||
|
By Region |
|
||
|
Key Market Drivers: |
|
||
|
Key Market Restraints: |
|
||
|
Key Opportunities: |
|
||
|
Companies Covered in the report: |
SK Global Software, Quadient (YayPay Inc.), Kofax Inc., Workday, Inc., Corcentric LLC, HighRadius Corporation, Qvalia AB, MHC Automation, Bill.com Holdings Inc., Comarch SA, Esker Inc., Sage, SAP , Oracle , Bottomline Technologies and Other Active Players. |
||
Chapter 1: Introduction
1.1 Scope and Coverage
Chapter 2:Executive Summary
Chapter 3: Market Landscape
3.1 Market Dynamics
3.1.1 Drivers
3.1.2 Restraints
3.1.3 Opportunities
3.1.4 Challenges
3.2 Market Trend Analysis
3.3 PESTLE Analysis
3.4 Porter's Five Forces Analysis
3.5 Industry Value Chain Analysis
3.6 Ecosystem
3.7 Regulatory Landscape
3.8 Price Trend Analysis
3.9 Patent Analysis
3.10 Technology Evolution
3.11 Investment Pockets
3.12 Import-Export Analysis
Chapter 4: Account Receivable Automation Market by Component (2018-2032)
4.1 Account Receivable Automation Market Snapshot and Growth Engine
4.2 Market Overview
4.3 Solutions
4.3.1 Introduction and Market Overview
4.3.2 Historic and Forecasted Market Size in Value USD and Volume Units
4.3.3 Key Market Trends, Growth Factors, and Opportunities
4.3.4 Geographic Segmentation Analysis
4.4 Services
Chapter 5: Account Receivable Automation Market by Deployment (2018-2032)
5.1 Account Receivable Automation Market Snapshot and Growth Engine
5.2 Market Overview
5.3 Cloud
5.3.1 Introduction and Market Overview
5.3.2 Historic and Forecasted Market Size in Value USD and Volume Units
5.3.3 Key Market Trends, Growth Factors, and Opportunities
5.3.4 Geographic Segmentation Analysis
5.4 On-premises
Chapter 6: Account Receivable Automation Market by Organization Size (2018-2032)
6.1 Account Receivable Automation Market Snapshot and Growth Engine
6.2 Market Overview
6.3 Large Enterprises
6.3.1 Introduction and Market Overview
6.3.2 Historic and Forecasted Market Size in Value USD and Volume Units
6.3.3 Key Market Trends, Growth Factors, and Opportunities
6.3.4 Geographic Segmentation Analysis
6.4 Small & Medium Sized Enterprises
Chapter 7: Account Receivable Automation Market by Vertical (2018-2032)
7.1 Account Receivable Automation Market Snapshot and Growth Engine
7.2 Market Overview
7.3 Banking
7.3.1 Introduction and Market Overview
7.3.2 Historic and Forecasted Market Size in Value USD and Volume Units
7.3.3 Key Market Trends, Growth Factors, and Opportunities
7.3.4 Geographic Segmentation Analysis
7.4 Financial Services & Insurance
7.5 IT & Telecom
7.6 Manufacturing
7.7 Consumer Goods & Retail
7.8 Healthcare
7.9 Energy & Utilities
7.10 Other Verticals
Chapter 8: Company Profiles and Competitive Analysis
8.1 Competitive Landscape
8.1.1 Competitive Benchmarking
8.1.2 Account Receivable Automation Market Share by Manufacturer (2024)
8.1.3 Industry BCG Matrix
8.1.4 Heat Map Analysis
8.1.5 Mergers and Acquisitions
8.2 QUALCOMM TECHNOLOGIES INC. (U.S.)
8.2.1 Company Overview
8.2.2 Key Executives
8.2.3 Company Snapshot
8.2.4 Role of the Company in the Market
8.2.5 Sustainability and Social Responsibility
8.2.6 Operating Business Segments
8.2.7 Product Portfolio
8.2.8 Business Performance
8.2.9 Key Strategic Moves and Recent Developments
8.2.10 SWOT Analysis
8.3 BROADCOM (U.S.)
8.4 UNISOC COMMUNICATIONS INC. (CHINA)
8.5 MEDIATEK INC. (TAIWAN)
8.6 INTEL CORPORATION (U.S.)
8.7 SAMSUNG ELECTRONICS COLTD. (SOUTH KOREA)
8.8 HUAWEI TECHNOLOGIES COLTD. (CHINA)
8.9 QORVO (U.S.)
8.10 XILINX INC. (U.S.)
8.11 INFINEON TECHNOLOGIES AG (GERMANY)
8.12 OTHER KEY PLAYERS
Chapter 9: Global Account Receivable Automation Market By Region
9.1 Overview
9.2. North America Account Receivable Automation Market
9.2.1 Key Market Trends, Growth Factors and Opportunities
9.2.2 Top Key Companies
9.2.3 Historic and Forecasted Market Size by Segments
9.2.4 Historic and Forecasted Market Size by Component
9.2.4.1 Solutions
9.2.4.2 Services
9.2.5 Historic and Forecasted Market Size by Deployment
9.2.5.1 Cloud
9.2.5.2 On-premises
9.2.6 Historic and Forecasted Market Size by Organization Size
9.2.6.1 Large Enterprises
9.2.6.2 Small & Medium Sized Enterprises
9.2.7 Historic and Forecasted Market Size by Vertical
9.2.7.1 Banking
9.2.7.2 Financial Services & Insurance
9.2.7.3 IT & Telecom
9.2.7.4 Manufacturing
9.2.7.5 Consumer Goods & Retail
9.2.7.6 Healthcare
9.2.7.7 Energy & Utilities
9.2.7.8 Other Verticals
9.2.8 Historic and Forecast Market Size by Country
9.2.8.1 US
9.2.8.2 Canada
9.2.8.3 Mexico
9.3. Eastern Europe Account Receivable Automation Market
9.3.1 Key Market Trends, Growth Factors and Opportunities
9.3.2 Top Key Companies
9.3.3 Historic and Forecasted Market Size by Segments
9.3.4 Historic and Forecasted Market Size by Component
9.3.4.1 Solutions
9.3.4.2 Services
9.3.5 Historic and Forecasted Market Size by Deployment
9.3.5.1 Cloud
9.3.5.2 On-premises
9.3.6 Historic and Forecasted Market Size by Organization Size
9.3.6.1 Large Enterprises
9.3.6.2 Small & Medium Sized Enterprises
9.3.7 Historic and Forecasted Market Size by Vertical
9.3.7.1 Banking
9.3.7.2 Financial Services & Insurance
9.3.7.3 IT & Telecom
9.3.7.4 Manufacturing
9.3.7.5 Consumer Goods & Retail
9.3.7.6 Healthcare
9.3.7.7 Energy & Utilities
9.3.7.8 Other Verticals
9.3.8 Historic and Forecast Market Size by Country
9.3.8.1 Russia
9.3.8.2 Bulgaria
9.3.8.3 The Czech Republic
9.3.8.4 Hungary
9.3.8.5 Poland
9.3.8.6 Romania
9.3.8.7 Rest of Eastern Europe
9.4. Western Europe Account Receivable Automation Market
9.4.1 Key Market Trends, Growth Factors and Opportunities
9.4.2 Top Key Companies
9.4.3 Historic and Forecasted Market Size by Segments
9.4.4 Historic and Forecasted Market Size by Component
9.4.4.1 Solutions
9.4.4.2 Services
9.4.5 Historic and Forecasted Market Size by Deployment
9.4.5.1 Cloud
9.4.5.2 On-premises
9.4.6 Historic and Forecasted Market Size by Organization Size
9.4.6.1 Large Enterprises
9.4.6.2 Small & Medium Sized Enterprises
9.4.7 Historic and Forecasted Market Size by Vertical
9.4.7.1 Banking
9.4.7.2 Financial Services & Insurance
9.4.7.3 IT & Telecom
9.4.7.4 Manufacturing
9.4.7.5 Consumer Goods & Retail
9.4.7.6 Healthcare
9.4.7.7 Energy & Utilities
9.4.7.8 Other Verticals
9.4.8 Historic and Forecast Market Size by Country
9.4.8.1 Germany
9.4.8.2 UK
9.4.8.3 France
9.4.8.4 The Netherlands
9.4.8.5 Italy
9.4.8.6 Spain
9.4.8.7 Rest of Western Europe
9.5. Asia Pacific Account Receivable Automation Market
9.5.1 Key Market Trends, Growth Factors and Opportunities
9.5.2 Top Key Companies
9.5.3 Historic and Forecasted Market Size by Segments
9.5.4 Historic and Forecasted Market Size by Component
9.5.4.1 Solutions
9.5.4.2 Services
9.5.5 Historic and Forecasted Market Size by Deployment
9.5.5.1 Cloud
9.5.5.2 On-premises
9.5.6 Historic and Forecasted Market Size by Organization Size
9.5.6.1 Large Enterprises
9.5.6.2 Small & Medium Sized Enterprises
9.5.7 Historic and Forecasted Market Size by Vertical
9.5.7.1 Banking
9.5.7.2 Financial Services & Insurance
9.5.7.3 IT & Telecom
9.5.7.4 Manufacturing
9.5.7.5 Consumer Goods & Retail
9.5.7.6 Healthcare
9.5.7.7 Energy & Utilities
9.5.7.8 Other Verticals
9.5.8 Historic and Forecast Market Size by Country
9.5.8.1 China
9.5.8.2 India
9.5.8.3 Japan
9.5.8.4 South Korea
9.5.8.5 Malaysia
9.5.8.6 Thailand
9.5.8.7 Vietnam
9.5.8.8 The Philippines
9.5.8.9 Australia
9.5.8.10 New Zealand
9.5.8.11 Rest of APAC
9.6. Middle East & Africa Account Receivable Automation Market
9.6.1 Key Market Trends, Growth Factors and Opportunities
9.6.2 Top Key Companies
9.6.3 Historic and Forecasted Market Size by Segments
9.6.4 Historic and Forecasted Market Size by Component
9.6.4.1 Solutions
9.6.4.2 Services
9.6.5 Historic and Forecasted Market Size by Deployment
9.6.5.1 Cloud
9.6.5.2 On-premises
9.6.6 Historic and Forecasted Market Size by Organization Size
9.6.6.1 Large Enterprises
9.6.6.2 Small & Medium Sized Enterprises
9.6.7 Historic and Forecasted Market Size by Vertical
9.6.7.1 Banking
9.6.7.2 Financial Services & Insurance
9.6.7.3 IT & Telecom
9.6.7.4 Manufacturing
9.6.7.5 Consumer Goods & Retail
9.6.7.6 Healthcare
9.6.7.7 Energy & Utilities
9.6.7.8 Other Verticals
9.6.8 Historic and Forecast Market Size by Country
9.6.8.1 Turkiye
9.6.8.2 Bahrain
9.6.8.3 Kuwait
9.6.8.4 Saudi Arabia
9.6.8.5 Qatar
9.6.8.6 UAE
9.6.8.7 Israel
9.6.8.8 South Africa
9.7. South America Account Receivable Automation Market
9.7.1 Key Market Trends, Growth Factors and Opportunities
9.7.2 Top Key Companies
9.7.3 Historic and Forecasted Market Size by Segments
9.7.4 Historic and Forecasted Market Size by Component
9.7.4.1 Solutions
9.7.4.2 Services
9.7.5 Historic and Forecasted Market Size by Deployment
9.7.5.1 Cloud
9.7.5.2 On-premises
9.7.6 Historic and Forecasted Market Size by Organization Size
9.7.6.1 Large Enterprises
9.7.6.2 Small & Medium Sized Enterprises
9.7.7 Historic and Forecasted Market Size by Vertical
9.7.7.1 Banking
9.7.7.2 Financial Services & Insurance
9.7.7.3 IT & Telecom
9.7.7.4 Manufacturing
9.7.7.5 Consumer Goods & Retail
9.7.7.6 Healthcare
9.7.7.7 Energy & Utilities
9.7.7.8 Other Verticals
9.7.8 Historic and Forecast Market Size by Country
9.7.8.1 Brazil
9.7.8.2 Argentina
9.7.8.3 Rest of SA
Chapter 10 Analyst Viewpoint and Conclusion
10.1 Recommendations and Concluding Analysis
10.2 Potential Market Strategies
Chapter 11 Research Methodology
11.1 Research Process
11.2 Primary Research
11.3 Secondary Research
|
Global Account Receivable Automation Market |
|||
|
Base Year: |
2024 |
Forecast Period: |
2025-2032 |
|
Historical Data: |
2018 to 2023 |
Market Size in 2024: |
USD 4246.4 Mn. |
|
Forecast Period 2024-32 CAGR: |
13.20% |
Market Size in 2032: |
USD 11449.65 Mn. |
|
Segments Covered: |
By Component |
|
|
|
By Deployment |
|
||
|
By Organization Size |
|
||
|
By Vertical |
|
||
|
By Region |
|
||
|
Key Market Drivers: |
|
||
|
Key Market Restraints: |
|
||
|
Key Opportunities: |
|
||
|
Companies Covered in the report: |
SK Global Software, Quadient (YayPay Inc.), Kofax Inc., Workday, Inc., Corcentric LLC, HighRadius Corporation, Qvalia AB, MHC Automation, Bill.com Holdings Inc., Comarch SA, Esker Inc., Sage, SAP , Oracle , Bottomline Technologies and Other Active Players. |
||


