


3D Printed Wearables Market Synopsis
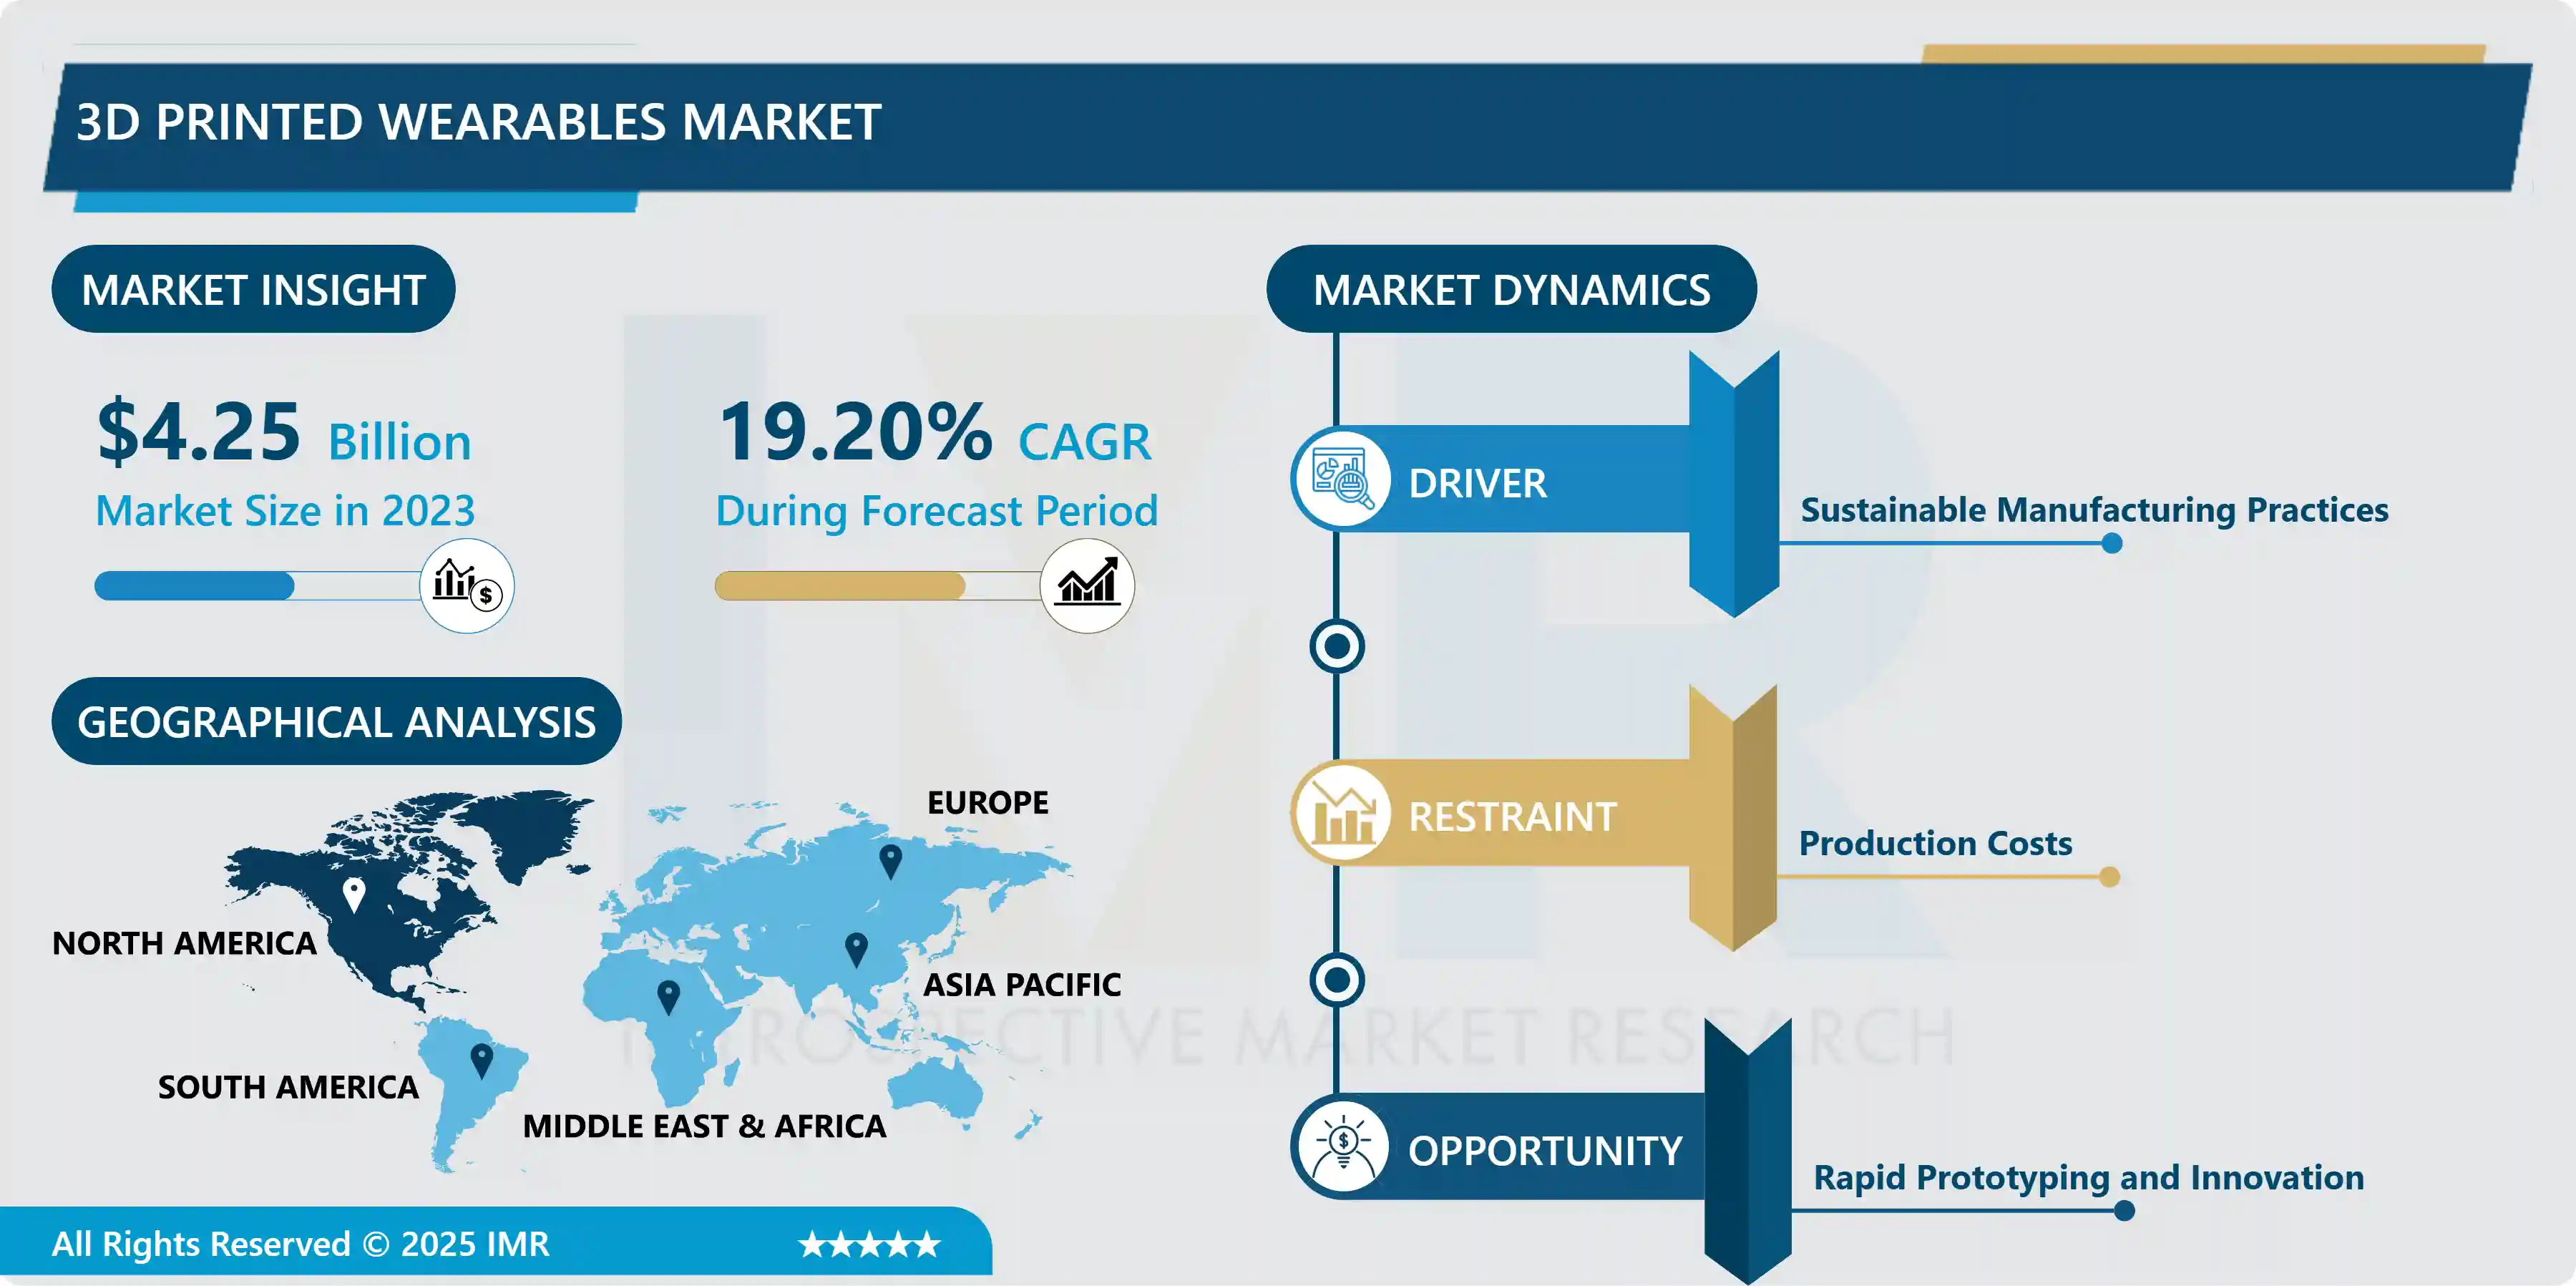
3D Printed Wearables Market Size Was Valued at USD 4.25 Billion in 2023 and is Projected to Reach USD 9.38 Billion by 2032, Growing at a CAGR of 19.20% From 2024-2032.
Smart garments are smart garments which are created on demand, with an individual approach, only using 3D printers. This concept makes it possible to combine several design elements into a single designed garment based on a particular body shape or personal needs. And with more than just clothing and fashion jewelry, 3D wearables provide superior comfort with exact measurements, protocol ability to design and create custom products. It does not only change the way of styling people and handling people’s health but it also contributes to the environment by practically producing less and decentralizing production.
3D printed wearables market is also growing in many new and emerging locations around the world now due to technological and demand side growth. This sector includes a range of products such as smart-watches, fitness bands, fashionable wear, and even prosthetics which, due to the 3D printing technology, are in the process of being transformed. The wearable 3D printing niche stands to benefit in a number of ways from its application in 3D printing. This personalization is especially useful in the case of products that are used to cure or improve medical conditions this includes the devices that can be used in the replacement of lost limbs or bits that have been affected. This technology is optimal for rapid prototyping and revision of new design primarily on time and cost saving compared to conventional manufacturing techniques.
3D enables the achievement of features which are otherwise difficult or impossible to obtain using typical fabrication processes. This capability is essential in producing highly lightweight durable wearable devices which are critical to the users and the wearable device’s durability for long hours of usage. Meanwhile, the market is developing the way of increasing material diversity – coming with more flexible and biocompatible variations, which adds new possibilities for 3D printed wearables. For instance, there are some efforts to develop smartwatches and fitness bands made of flexible materials for more comfort and biocompatible materials for medical wearables to be more in contact with the body.
The use of 3D printing in conjunction with other leading-edge technologies such IoT and AI to enable further innovation in the market. Tracking devices are another category of wearables that with their core being a collection of sensors and other connectivity features can gather information from the user to provide insights for health analysis. This convergence of technologies helps to boost the capabilities of wearables and provide a wider range of possibilities for wearables that consumers appreciate.
The way 3D printing helps the environment to a greater extent. Additive manufacturing takes much longer time to produce designs compared to subtractive manufacturing processes which leads more to waste, which does not fit very well with the modern consumer and regulator-led push for sustainability. It is possible to assume that this sustainability aspect will become one of the main competitive advantages as a growing concern for the environment is established in different countries.
A number of benefits associated with 3D printed wearables are mentioned including the high level of personalisation and flexibility; and the fact that there is no need for capital costs associated with machines or materials. On the other hand, some challenges are identified in regards to 3D wornables including the high cost of owning or renting advanced 3D printers or specialized material and lessened durability and scalability of product production. Nonetheless, R&D works for further improvement are underway which are expected to further eliminate these issues to further solidify 3D printing’s role in wearable technology.
The trend of 3D printing wearables shows that this market has a strong potential for growth as more people want to buy quality clothes and the 3D printing technology keeps evolving. The market is also seen as one that has significant potential to grow further with more manufacturers pushing for solutions to some of the current limitations and with potential development of more applications, from functional wearables for consumers to increased opportunities for clinical uses.

3D Printed Wearables Market Trend Analysis
Increased Integration of Smart Technology in 3D Printed Wearables
- The ability to 3D print smart fabrics is enabling the integration and application of wearable technology in ways that previously would have been almost unthinkable. 3D printing of wearables is a way of manufacturing safety gear which is made to fit the specific shape of a human body and therefore ensures a maximum level of usability. The smart devices are essentially embedded smart sensors, actuators, and communication modules which are incorporated within these three-dimensional structures that are printable to enable real time monitoring of data in terms of heartbeat, body temperature, and motion patterns from most wearable items. This makes the collection of information highly accurate and reliable with the same time enabling the possibility of personalized health tracking, athletic performance, and diagnostic tools.
- In addition, generation of innovative technologies and implementations of smart technology through the use of 3D printing 3D printing technology is applicable for various activities such as in the sport, entertainment, and healthcare industries. The healthcare sector is a good example as 3D wearable wearables can offer continued surveillance thus a natural shift towards proactive care rather than reactive type. Sport fanatics would also want devices which are able to give more in-depth information on the sportsperson’s performance and fitness status. For example, in the entertainment business area, wearables might be used to deliver haptic feedback and complete VR interaction. In general 3D printing and smart technology are together creating innovative trends in the development of smart wearables which are shaped by personal demands and more connected.
Rapid Prototyping and Innovation
- Among the consumer products that are seeing significant growth in the adoption of 3D printing technology is the wearables market and this trend is mainly driven by the fusion of technology and fashion and the growing popularity of personalization. Rapid prototyping technologies have been the key in shaping this particular market as most designers and manufacturers are able to get fast and efficient designs which are unique and in addition may be able to bring products to the market quicker than before. Wearables can go into customization of the body itself with 3D printing where different body shapes get tailored to accommodate different tastes and comforts without its traditional difficulty in mass production. This flexibility of design and production has resulted in the production of an array of wearable products that include sensors and electronics incorporated into clothes for tracking health to fashionable lifestyle products that meld technology in their design.
- In addition, the combination of rapid prototyping with innovation in wearables production using 3DP has motivated looking for and leveraging more cooperation between different industries that have been recently engaged in the exploration of new materials and production techniques in the fields of electronics or design. Compared to the conventional materials used in the development of wearables, companies are now turned to materials that are more durable, flexible, and biocompatible to bring the wearables into healthcare and fitness as well as fashion industry. This combination between rapid prototyping as well as innovation has not only come in the form of increased speed in product development but also made such devices accessible for the general population and even businesses as the new revolution where prior models demanded huge investments that were impossible for most individuals as well as new startups to come through. With the technology continuing to develop, 3-D printing will likely find an even larger space in wearables where people will be able to personalize any new device; thus, it will fuel unending innovation possibilities.
3D Printed Wearables Market Segment Analysis:
3D Printed Wearables Market is segmented based on Product Type, End-use Sector and Sales Channel.
By Product Type, Prosthetics segment is expected to dominate the market during the forecast period
- Footwear: It was a start of 3D printing technology in the footwear industry and its popularity due to custom-fit shoes and innovative design. Superior products like Adidas and Nike have already been designed using 3D printing for the midsole and upper part, thus producing distinctively personalized and high-performing footwear.
- Prosthetics: It has been a press that has revolutionized the prosthetic field by producing customized prosthetic legs that are lighter, stronger, and cheaper to manufacture than the typical prosthetic procedure. Enables prosthetists to fabricate customized accident functional devices that can best suit patients’ body and the efficacy of its operation.
- Orthopedic Implants: Similarly 3D printing has also been important in the manufacturing of personalized or custom made orthopedic implants based on patient’s body morphology. This approach reportedly optimizes implant fit and enhanced osseointegration to ensure minimal complications and better patient care. Orthopedic implants are sometimes printed using biocompatible materials including titanium.
- Surgical Instruments: 3D printing has made it possible to create objects that could not have been fabricated using conventional methods because of their complex designs especially in the area of surgical instruments. Designers can also design surgical tools which are used in a particular surgical method in order to achieve maximum efficiency and accuracy
- Smart Watches: Personally, I am not too sure of the percentage of smart watches that are being printed using 3D printing technology; however, there might be a few of its components or accessories that might be taking advantage of the same. For instance, 3D printing can be used to print the custom watch straps according to the style of the past wearer. Furthermore, 3D printing technology could be of use for the process of prototyping new designs or components for smart watches.
- Fitness Trackers: It is not a coincidence that a lot of smart watches are 3D printed but the whole structure or they may only use this technology for the creation of some pieces or add-on. For instance, 3D printing can be used in the manufacture for custom-fit straps or casing for the fitness trackers that could provide the end-users with comfortable wearables according to their specific body sizes.
By End Use Sector, Hospital segment held the largest share in 2023
- Hospital:Increasing number of hospitals is using 3D wearable devices for care and monitoring. They can even entail the use of braces or prosthetics that will be tailored to the child’s specifications as well as specific wearable sensors for perpetual health tracking. The following 3D printing-based capability is one of the key added values of 3D printing in the healthcare sector: There are examples of the use of 3D printing in numerous healthcare providers where the person can present the individual’s problem and propose a specific solution.
- Pharma and Biotech Companies:The bioprinting has become increasingly important for pharmaceutical and biotech businesses as they employ 3D printing technology for drug delivery system, tissue engineering, and tailor-made medicine Newer approaches in manufacturing technologies such as three dimensional printing might become useful for the creation of mobile chemical drug devices such as patches and implants to allow more flexibility and more precise control of the concentration of drugs administered as pills or injection.
- Academic Institutes:College campuses also provide a location for developing 3D printing technology and research on the subject. Scholars in these institutions conduct research in new materials, the various methods of printing, and the potential applications of wearable devises for this particular market. Furthermore the academic institutions can also team up among themselves or with other sectors to build simulated prototypes for testing and validation.
- Others:The industrial sectors and organizations falling under this category cover several industries and organizations that are utilizing 3D printed wearables for different purposes. It can include industries such as sports and healthy living, fashion, aircraft and aeronautics, automobile. For instance, an athlete can have the 3D printed wearables worn for data and for better sports performance and injury prevention whereas fashion designers would use the 3D printing to create dramatic and unconventional fashion.
3D Printed Wearables Market Regional Insights:
North America is Expected to Dominate the Market Over the Forecast period
- North America is expected to continue dominating the 3D printed wearables market through the projected period. These factors have led to a great shift in supremacy within the region including the presence of key players and great technological advancements in additive manufacturing within the region. Also, the technological advancement being experienced in North America has led to establishing research and development facilities which promotes innovation of the 3D printable wearable devices. Furthermore, the presence of a strong customer base and the growing requirement for individual and tailored observable products adds to the market growth of the area and puts it at the forefront of the wearables revolution in North America.
- In addition, there is a lot of support from the government in the field of 3D wearables in North America and especially the favorable regulation in favor of 3D printed wearables contribute to the growth of the market. These regulations provide for the safe and ethical application of the additive manufacturing technologies as well as appropriate R&D investments in the sector. Moreover, the existing infrastructure and the well systemized logistical channels make the production and delivery of 3D printed wearable devices for North America a seamless process, which explains why North America has a significant market share in the global market. North America is the largest region in wearable market and will continue to dominate the North American market in the coming years because of the increasing preference of consumers for personalized and technologically advanced wearable solutions.
Active Key Players in the 3D Printed Wearables Market
- New Balance (US)
- Under Armour (US)
- Adidas America Inc. (US)
- 3D Systems Inc. (US)
- Shapeways Inc. (US)
- Formlabs (US)
- Materialise (Belgium)
- Zortrax (Poland)
- Stratasys Ltd. (US)
- EnvisionTEC (US)
- Carbon, Inc. (US)
- Other Key Players
Key Industry Developments in the 3D Printed Wearables Market
- In October 2023, the Fingy3D startup firm, managed by Mon Health's Intermed Labs, will continue to position West Virginia at the forefront of medical technology. The firm offers online purchasing of 3D-printed prosthetic fingers through Mon Health's Intermed Labs. The worldwide event received entries from 21 nations and states, with five finalists competing for a $350,000 prize.
- In September 2023, scientists at the Lawrence Livermore National Laboratory (LLNL) and Meta created a new form of 3D printed material for real-world wearable applications. These novel materials can replicate biological materials, which may have implications for the future of enhanced humanity.
|
Global 3D Printed Wearables Market |
|||
|
Base Year: |
2023 |
Forecast Period: |
2024-2032 |
|
Historical Data: |
2017 to 2023 |
Market Size in 2023: |
USD 4.25 Bn. |
|
Forecast Period 2024-32 CAGR: |
19.20% |
Market Size in 2032: |
USD 9.38 Bn. |
|
Segments Covered: |
By Product Type |
|
|
|
By End-User |
|
||
|
By Sales Channel |
|
||
|
By Region |
|
||
|
Key Market Drivers: |
|
||
|
Key Market Restraints: |
|
||
|
Key Opportunities: |
|
||
|
Companies Covered in the report: |
|
||
Chapter 1: Introduction
1.1 Scope and Coverage
Chapter 2:Executive Summary
Chapter 3: Market Landscape
3.1 Market Dynamics
3.1.1 Drivers
3.1.2 Restraints
3.1.3 Opportunities
3.1.4 Challenges
3.2 Market Trend Analysis
3.3 PESTLE Analysis
3.4 Porter's Five Forces Analysis
3.5 Industry Value Chain Analysis
3.6 Ecosystem
3.7 Regulatory Landscape
3.8 Price Trend Analysis
3.9 Patent Analysis
3.10 Technology Evolution
3.11 Investment Pockets
3.12 Import-Export Analysis
Chapter 4: 3D Printed Wearables Market by Product Type (2018-2032)
4.1 3D Printed Wearables Market Snapshot and Growth Engine
4.2 Market Overview
4.3 Footwear
4.3.1 Introduction and Market Overview
4.3.2 Historic and Forecasted Market Size in Value USD and Volume Units
4.3.3 Key Market Trends, Growth Factors, and Opportunities
4.3.4 Geographic Segmentation Analysis
4.4 Prosthetics
4.5 Orthopedic Implants
4.6 Surgical Instruments
4.7 Smart Watches
4.8 Fitness Trackers
Chapter 5: 3D Printed Wearables Market by End-User (2018-2032)
5.1 3D Printed Wearables Market Snapshot and Growth Engine
5.2 Market Overview
5.3 Hospital
5.3.1 Introduction and Market Overview
5.3.2 Historic and Forecasted Market Size in Value USD and Volume Units
5.3.3 Key Market Trends, Growth Factors, and Opportunities
5.3.4 Geographic Segmentation Analysis
5.4 Pharma and Biotech companies
5.5 Academic Institutes
5.6 Others
Chapter 6: 3D Printed Wearables Market by Sales Channel (2018-2032)
6.1 3D Printed Wearables Market Snapshot and Growth Engine
6.2 Market Overview
6.3 Online Retail
6.3.1 Introduction and Market Overview
6.3.2 Historic and Forecasted Market Size in Value USD and Volume Units
6.3.3 Key Market Trends, Growth Factors, and Opportunities
6.3.4 Geographic Segmentation Analysis
6.4 Offline Retail
6.5 Direct Sales
6.6 Healthcare Providers
6.7 Customization Platforms
Chapter 7: Company Profiles and Competitive Analysis
7.1 Competitive Landscape
7.1.1 Competitive Benchmarking
7.1.2 3D Printed Wearables Market Share by Manufacturer (2024)
7.1.3 Industry BCG Matrix
7.1.4 Heat Map Analysis
7.1.5 Mergers and Acquisitions
7.2 ACE INSURANCE (USA)
7.2.1 Company Overview
7.2.2 Key Executives
7.2.3 Company Snapshot
7.2.4 Role of the Company in the Market
7.2.5 Sustainability and Social Responsibility
7.2.6 Operating Business Segments
7.2.7 Product Portfolio
7.2.8 Business Performance
7.2.9 Key Strategic Moves and Recent Developments
7.2.10 SWOT Analysis
7.3 ACHMEA(NETHERLANDS)
7.4 AEGON (NETHERLANDS)
7.5 AIA GROUP (HONG KONG)
7.6 ALFASTRAKHOVANIE (RUSSIA)
7.7 ALLIANZ
7.8 ANADOLU HAYAT EMEKLILIK (TURKEY)
7.9 ASSICURAZIONI GENERALI (ITALY)
7.10 ASSURANT (UNITED STATES)
7.11 AVIVA (UK)
7.12 AXA (FRANCE)
7.13 BANAMEX (MEXICO)
7.14 BANCO BILBAO VIZCAYA ARGENTARIA (SPAIN)
7.15 BANCO BRADESCO (BRAZIL)
7.16 BNP PARIBAS CARDIF (PARIS)
7.17 CHINA LIFE INSURANCE COMPANY (CHINA)
7.18 CHINA PACIFIC INSURANCE (CHINA)
7.19 CNP ASSURANCES (FRANCE)
7.20 CREDIT AGRICOLE (FRANCE)
7.21 DZ BANK (GERMANY)
7.22 GARANTI EMEKLILIK VE HAYAT (TURKEY)
7.23 GREAT EASTERN HOLDINGS (SINGAPORE)
7.24 GRUPO NACIONAL PROVINCIAL (MEXICO)
7.25
Chapter 8: Global 3D Printed Wearables Market By Region
8.1 Overview
8.2. North America 3D Printed Wearables Market
8.2.1 Key Market Trends, Growth Factors and Opportunities
8.2.2 Top Key Companies
8.2.3 Historic and Forecasted Market Size by Segments
8.2.4 Historic and Forecasted Market Size by Product Type
8.2.4.1 Footwear
8.2.4.2 Prosthetics
8.2.4.3 Orthopedic Implants
8.2.4.4 Surgical Instruments
8.2.4.5 Smart Watches
8.2.4.6 Fitness Trackers
8.2.5 Historic and Forecasted Market Size by End-User
8.2.5.1 Hospital
8.2.5.2 Pharma and Biotech companies
8.2.5.3 Academic Institutes
8.2.5.4 Others
8.2.6 Historic and Forecasted Market Size by Sales Channel
8.2.6.1 Online Retail
8.2.6.2 Offline Retail
8.2.6.3 Direct Sales
8.2.6.4 Healthcare Providers
8.2.6.5 Customization Platforms
8.2.7 Historic and Forecast Market Size by Country
8.2.7.1 US
8.2.7.2 Canada
8.2.7.3 Mexico
8.3. Eastern Europe 3D Printed Wearables Market
8.3.1 Key Market Trends, Growth Factors and Opportunities
8.3.2 Top Key Companies
8.3.3 Historic and Forecasted Market Size by Segments
8.3.4 Historic and Forecasted Market Size by Product Type
8.3.4.1 Footwear
8.3.4.2 Prosthetics
8.3.4.3 Orthopedic Implants
8.3.4.4 Surgical Instruments
8.3.4.5 Smart Watches
8.3.4.6 Fitness Trackers
8.3.5 Historic and Forecasted Market Size by End-User
8.3.5.1 Hospital
8.3.5.2 Pharma and Biotech companies
8.3.5.3 Academic Institutes
8.3.5.4 Others
8.3.6 Historic and Forecasted Market Size by Sales Channel
8.3.6.1 Online Retail
8.3.6.2 Offline Retail
8.3.6.3 Direct Sales
8.3.6.4 Healthcare Providers
8.3.6.5 Customization Platforms
8.3.7 Historic and Forecast Market Size by Country
8.3.7.1 Russia
8.3.7.2 Bulgaria
8.3.7.3 The Czech Republic
8.3.7.4 Hungary
8.3.7.5 Poland
8.3.7.6 Romania
8.3.7.7 Rest of Eastern Europe
8.4. Western Europe 3D Printed Wearables Market
8.4.1 Key Market Trends, Growth Factors and Opportunities
8.4.2 Top Key Companies
8.4.3 Historic and Forecasted Market Size by Segments
8.4.4 Historic and Forecasted Market Size by Product Type
8.4.4.1 Footwear
8.4.4.2 Prosthetics
8.4.4.3 Orthopedic Implants
8.4.4.4 Surgical Instruments
8.4.4.5 Smart Watches
8.4.4.6 Fitness Trackers
8.4.5 Historic and Forecasted Market Size by End-User
8.4.5.1 Hospital
8.4.5.2 Pharma and Biotech companies
8.4.5.3 Academic Institutes
8.4.5.4 Others
8.4.6 Historic and Forecasted Market Size by Sales Channel
8.4.6.1 Online Retail
8.4.6.2 Offline Retail
8.4.6.3 Direct Sales
8.4.6.4 Healthcare Providers
8.4.6.5 Customization Platforms
8.4.7 Historic and Forecast Market Size by Country
8.4.7.1 Germany
8.4.7.2 UK
8.4.7.3 France
8.4.7.4 The Netherlands
8.4.7.5 Italy
8.4.7.6 Spain
8.4.7.7 Rest of Western Europe
8.5. Asia Pacific 3D Printed Wearables Market
8.5.1 Key Market Trends, Growth Factors and Opportunities
8.5.2 Top Key Companies
8.5.3 Historic and Forecasted Market Size by Segments
8.5.4 Historic and Forecasted Market Size by Product Type
8.5.4.1 Footwear
8.5.4.2 Prosthetics
8.5.4.3 Orthopedic Implants
8.5.4.4 Surgical Instruments
8.5.4.5 Smart Watches
8.5.4.6 Fitness Trackers
8.5.5 Historic and Forecasted Market Size by End-User
8.5.5.1 Hospital
8.5.5.2 Pharma and Biotech companies
8.5.5.3 Academic Institutes
8.5.5.4 Others
8.5.6 Historic and Forecasted Market Size by Sales Channel
8.5.6.1 Online Retail
8.5.6.2 Offline Retail
8.5.6.3 Direct Sales
8.5.6.4 Healthcare Providers
8.5.6.5 Customization Platforms
8.5.7 Historic and Forecast Market Size by Country
8.5.7.1 China
8.5.7.2 India
8.5.7.3 Japan
8.5.7.4 South Korea
8.5.7.5 Malaysia
8.5.7.6 Thailand
8.5.7.7 Vietnam
8.5.7.8 The Philippines
8.5.7.9 Australia
8.5.7.10 New Zealand
8.5.7.11 Rest of APAC
8.6. Middle East & Africa 3D Printed Wearables Market
8.6.1 Key Market Trends, Growth Factors and Opportunities
8.6.2 Top Key Companies
8.6.3 Historic and Forecasted Market Size by Segments
8.6.4 Historic and Forecasted Market Size by Product Type
8.6.4.1 Footwear
8.6.4.2 Prosthetics
8.6.4.3 Orthopedic Implants
8.6.4.4 Surgical Instruments
8.6.4.5 Smart Watches
8.6.4.6 Fitness Trackers
8.6.5 Historic and Forecasted Market Size by End-User
8.6.5.1 Hospital
8.6.5.2 Pharma and Biotech companies
8.6.5.3 Academic Institutes
8.6.5.4 Others
8.6.6 Historic and Forecasted Market Size by Sales Channel
8.6.6.1 Online Retail
8.6.6.2 Offline Retail
8.6.6.3 Direct Sales
8.6.6.4 Healthcare Providers
8.6.6.5 Customization Platforms
8.6.7 Historic and Forecast Market Size by Country
8.6.7.1 Turkiye
8.6.7.2 Bahrain
8.6.7.3 Kuwait
8.6.7.4 Saudi Arabia
8.6.7.5 Qatar
8.6.7.6 UAE
8.6.7.7 Israel
8.6.7.8 South Africa
8.7. South America 3D Printed Wearables Market
8.7.1 Key Market Trends, Growth Factors and Opportunities
8.7.2 Top Key Companies
8.7.3 Historic and Forecasted Market Size by Segments
8.7.4 Historic and Forecasted Market Size by Product Type
8.7.4.1 Footwear
8.7.4.2 Prosthetics
8.7.4.3 Orthopedic Implants
8.7.4.4 Surgical Instruments
8.7.4.5 Smart Watches
8.7.4.6 Fitness Trackers
8.7.5 Historic and Forecasted Market Size by End-User
8.7.5.1 Hospital
8.7.5.2 Pharma and Biotech companies
8.7.5.3 Academic Institutes
8.7.5.4 Others
8.7.6 Historic and Forecasted Market Size by Sales Channel
8.7.6.1 Online Retail
8.7.6.2 Offline Retail
8.7.6.3 Direct Sales
8.7.6.4 Healthcare Providers
8.7.6.5 Customization Platforms
8.7.7 Historic and Forecast Market Size by Country
8.7.7.1 Brazil
8.7.7.2 Argentina
8.7.7.3 Rest of SA
Chapter 9 Analyst Viewpoint and Conclusion
9.1 Recommendations and Concluding Analysis
9.2 Potential Market Strategies
Chapter 10 Research Methodology
10.1 Research Process
10.2 Primary Research
10.3 Secondary Research
|
Global 3D Printed Wearables Market |
|||
|
Base Year: |
2023 |
Forecast Period: |
2024-2032 |
|
Historical Data: |
2017 to 2023 |
Market Size in 2023: |
USD 4.25 Bn. |
|
Forecast Period 2024-32 CAGR: |
19.20% |
Market Size in 2032: |
USD 9.38 Bn. |
|
Segments Covered: |
By Product Type |
|
|
|
By End-User |
|
||
|
By Sales Channel |
|
||
|
By Region |
|
||
|
Key Market Drivers: |
|
||
|
Key Market Restraints: |
|
||
|
Key Opportunities: |
|
||
|
Companies Covered in the report: |
|
||


