


Virtual Fitting Room Market Synopsis
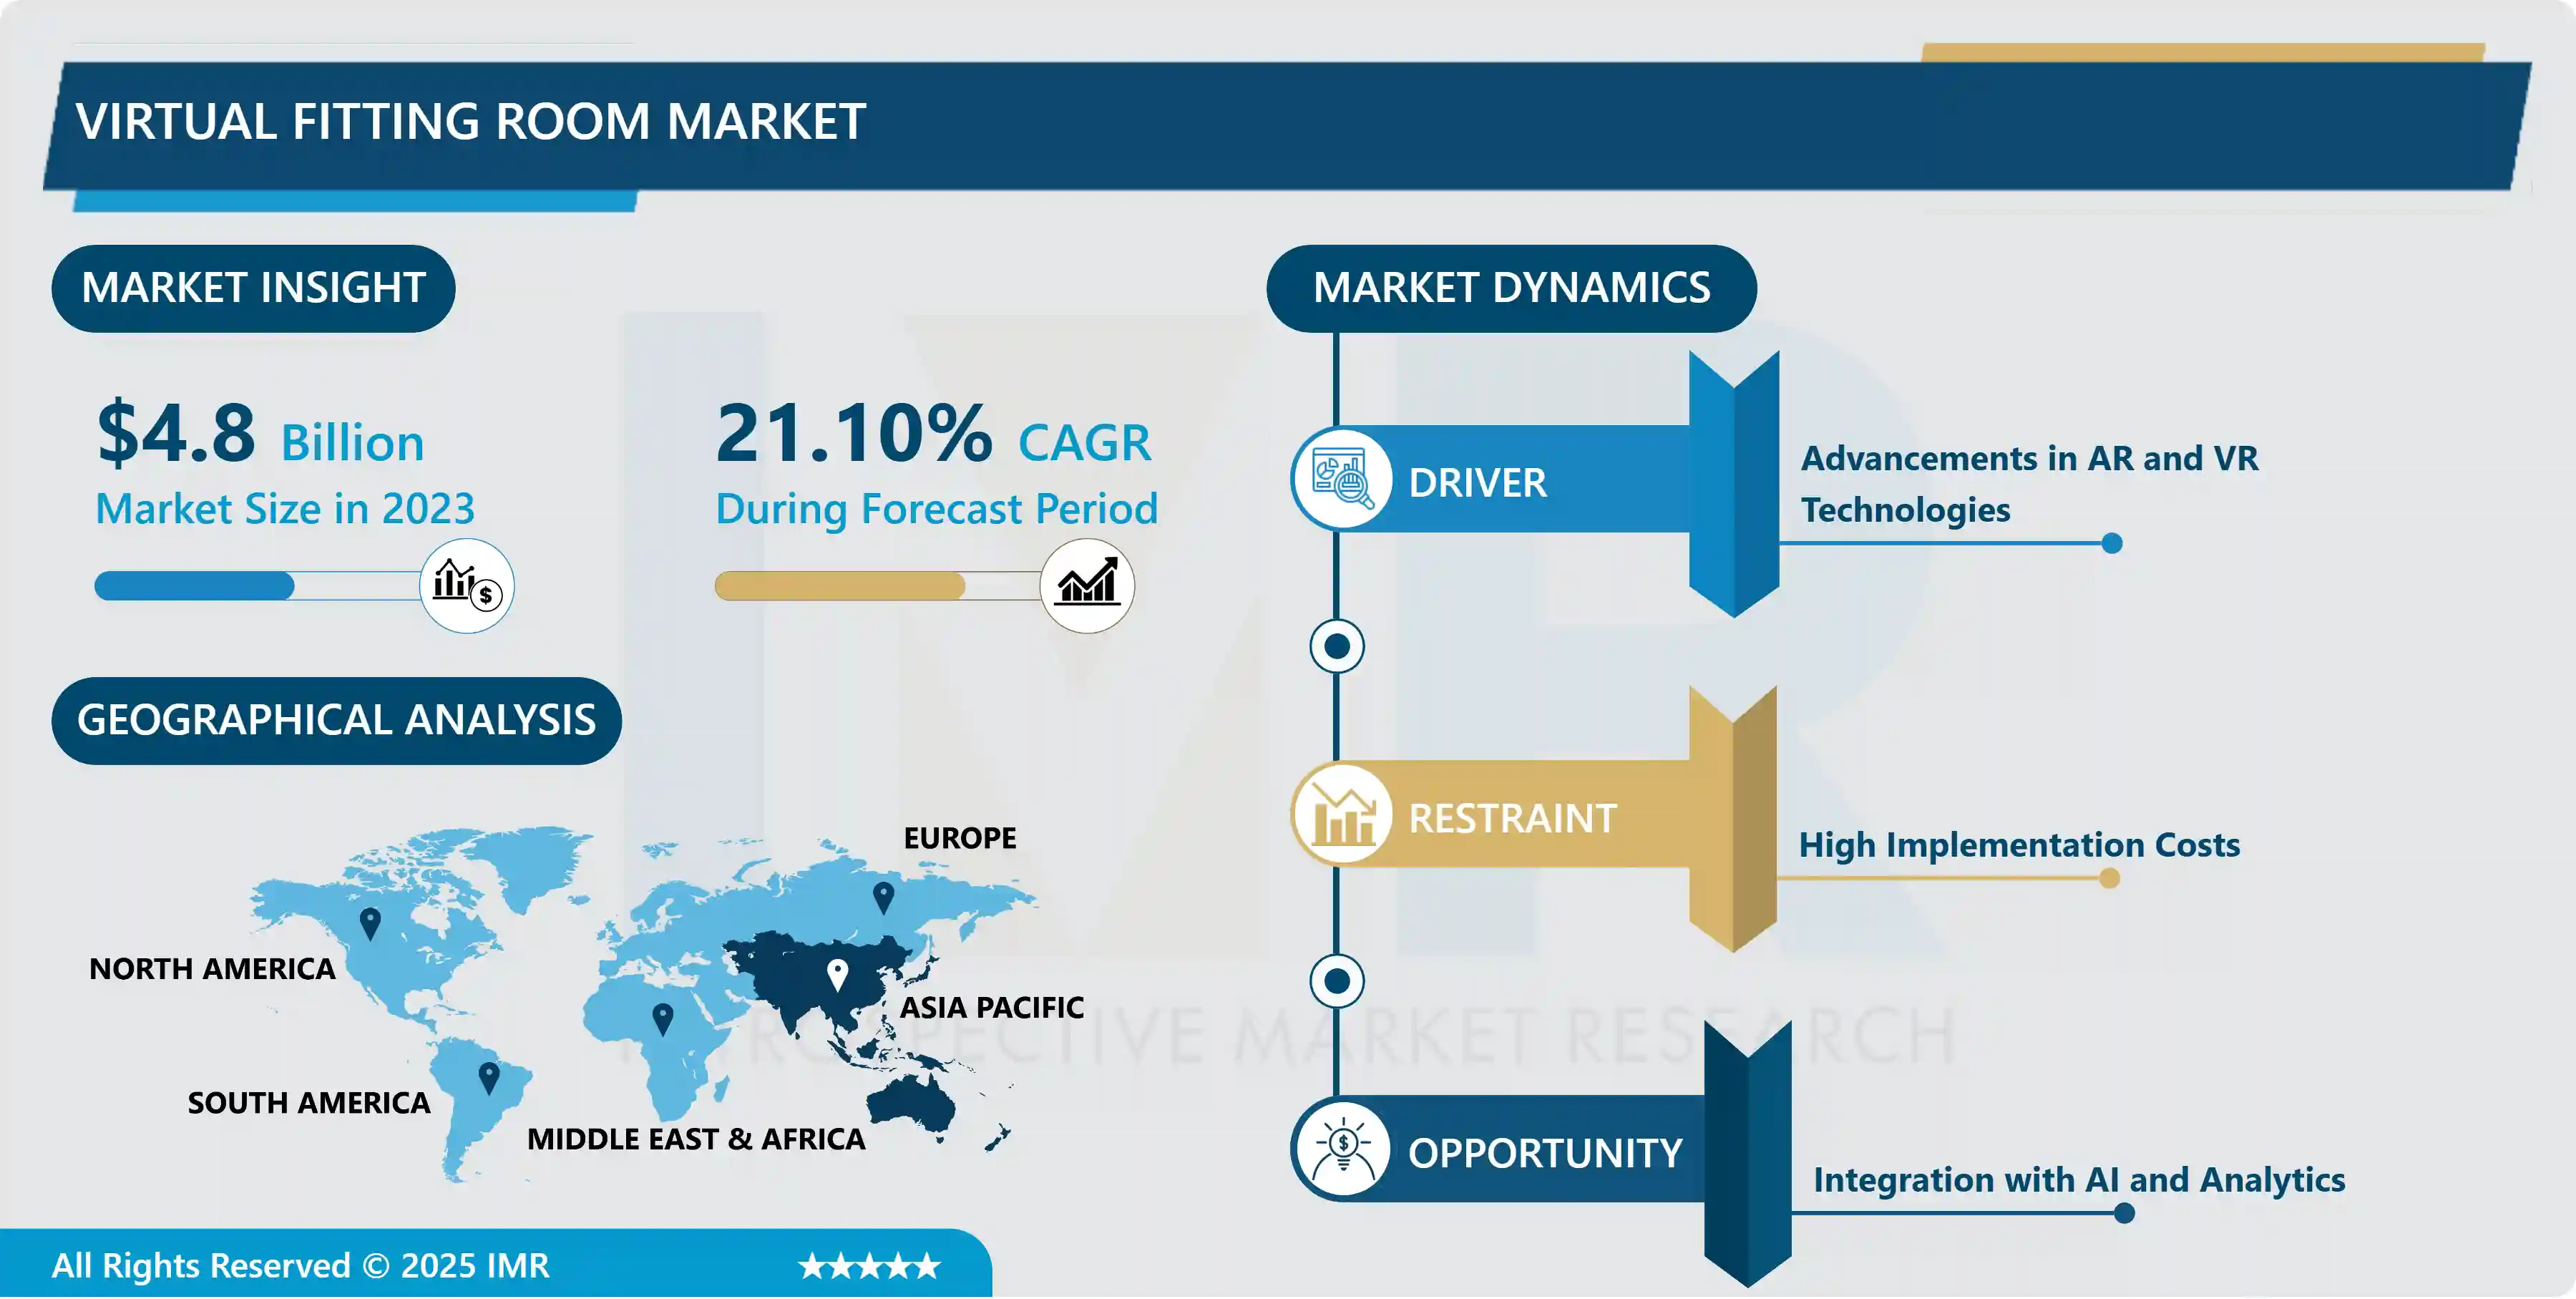
Virtual Fitting Room Market Size Was Valued at USD 4.8 Billion in 2023 and is Projected to Reach USD 26.8 Billion by 2032, Growing at a CAGR of 21.10% From 2024-2032.
A virtual dressing room is a digital tool through which customers can visualize how clothes and accessories look on them without going to a real store. With the latest technology like augmented reality (AR) or virtual reality (VR), the virtual fitting rooms give the customers a sample of trying clothes on in reality by simply superimposing virtual clothes onto their bodies. The customers can play around with virtual clothes, change the size, colors, and styles, and visualize how they would fit them before making the purchase decision. Virtual fitting rooms provide customers with the comfort and flexibility of trying different items and styles from their own homes, which saves time and helps them make informed buying decisions. Furthermore, these channels can reduce the cost of returns and improve customer happiness because they provide a better display of how clothing looks and how big it will be on different body types.
The virtual fitting room as an innovative alternative to the traditional shopping experience that allows customers to try on clothing and accessories virtually through digitally created 3D outfits is a game changer. This technology makes use of the advanced techniques of augmented reality (AR) and virtual reality (VR) to create this feeling as though one is actually trying on clothes in real time straight from where they are.
Through digital garment overlays, consumers can preview numerous designs, sizes, and colors of a certain product that they are really interested in. Apart from the fact that this solves the problem of shopper's convenience, it also deals with the sizing and fit issues, and as a result, it increases customer satisfaction.
Also, virtual fitting rooms provide retailers with a chance of returning reduction and simplification of the shopping process through more exact representation of their sold items. With the progress of the technology, the virtual fitting room is predicted to play a significant role in the retail industry and will make the shopping process more personal and immersive for people around the world.

Virtual Fitting Room Market Trend Analysis
The Evolution of Virtual Fitting Rooms with AR and VR Integration
- The integration of augmented reality (AR) and virtual reality (VR) technology within virtual fitting rooms is highly innovative and is considered a paradigm shift in the way consumers interact with eCommerce shopping. AR embeds virtual content into real world, and VR completely removes the user from the real-life situation and places them in a completely digital environment.
- Encouraging the use of these technologies in volunteers' rooms pulls togther the online and physical shopping experiences, creating a highly interactive 360-degree experience. Now shoppers are virtually able to try on clothing items in real-time, i.e. they can move digital representations of garments to examine them from different angles, hence see how it fits on them in a short period of time. This feature facilitates the appearance of garments with just the right ambiance and reduces the possibility of wrong purchases. Customers can see the garment just the way it will appear in real life.
- Hence, AR and VR technology integrated into the fashion industry's virtual fitting room creates the novel possibilities of customization and personalization. These sophisticated technologies will enable retailers to provide personalized experiences that are designed around what suits each person and their unique body shape. Likewise, AR technology can overlay garments onto a user's actual body in real- time, thereby letting them make use of all the different styles, sizes and colors to best match their actual body shape. In contrast, VR will enable users to visit virtual scenarios where they may interact with virtual avatars or real-time simulations of the product they plan to purchase, thereby providing a more realistic and personalized experience.
- Ultimately, the combination of AR and VR technology into virtual fitting rooms not only intensify the comfort and correctness of online shopping purchase process but also help consumers to be more confident and satisfied about their choices..
The Power of Personalization in Virtual Fitting Rooms
- The customization and personalization of the user experience within virtual fitting rooms represent a significant shift towards more tailored and engaging online shopping experiences. With the proliferation of data analytics and machine learning algorithms, retailers now have access to a wealth of information about shoppers' preferences, purchase history, and even body measurements.
- By harnessing this data, retailers can create highly personalized virtual fitting room experiences that cater to individual tastes and needs. For instance, machine learning algorithms can analyze a customer's past purchases and browsing behavior to recommend clothing items that align with their style preferences. Additionally, by integrating body measurement data, virtual fitting rooms can suggest the most suitable sizes and fits for each customer, reducing the likelihood of returns and enhancing overall satisfaction.
- Furthermore, the personalization of the virtual fitting room experience extends beyond product recommendations to encompass the entire shopping journey. Retailers can customize the interface and features of virtual fitting room applications to match each user's preferences and browsing habits. For example, customers may have the option to filter clothing items based on specific criteria such as color, style, or brand, allowing for a more efficient and tailored browsing experience.
- Moreover, retailers can incorporate interactive features such as virtual stylists or outfit builders, providing users with personalized fashion advice and inspiration. By tailoring the virtual fitting room experience to individual users, retailers can foster stronger connections with their customers, driving loyalty and repeat purchases while simultaneously increasing conversion rates and revenue.
Virtual Fitting Room Market Segment Analysis:
Market Name Market Segmented based on Component Type and Application
By Type, Hardware segment is expected to dominate the market during the forecast period
- In the fashion and beauty industries today, especially, hardware has become a cornerstone of innovation and productivity throughout different stages of the product lifecycle. Along the manufacturing line, the hardware covers extensive types of machines and tools to accommodate the finicking needs of the clothing and cosmetic production. Whether be it precision cutting machines and sewing equipment for apparel manufacturing or high-technology blending and filling machines for cosmetics production, those hardware assets are the foundation of the company that helps companies to improve their quality control and reduce the production time. Furthermore, the danger of environmental degradation makes modern hardware solutions to be provided with not only energy-saving technologies and recyclable materials, but also fulfilling requirements of eco-friendly policy of the industry.
- Alongside manufacturing, hardware also becomes significant in packaging and display, both of which are essential in branding and consumer buying decision making, as they influence the perception of consumers. Packaging machines like automated filling and sealing systems, labeling and coding devices are used to house products, mark them and ready for distribution. Furthermore, hardware goes beyond the retail side, which considers visually attracting and functional display stands, shelving systems, and employees point-of-sale systems that enrich the overall shopping experience together with increases sales and engagement. At the same time as the industry keeps developing its responses to emerging consumer trends and technological advancement software continues to be a key element giving companies in the fashion and beauty industries the opportunities to innovate, differentiate and excel in a very competitive environment..
By Application, Apparel segment held the largest share in 2023
- Apparel is a component which stands at the base of the fashion industry as the picture of individuals’ way of being and cultural norms. The variety of apparel products, containing everyday wear to latest fashion, serve the different requirements and interests of the people internationally. Its rule is based on its universal nature, not only clothing is a necessity, it is used for expressing the characters. People use their clothes to reveal their personalities and goals and also highlight their association with society.
- Besides, the dominance of the apparel sector is largely due to the fact that it is one of the most dynamic industries, being stimulated continually by fresh trends and consumer choices. From the catwalks of Paris to the sidewalk of Tokyo, fashion is always at the mercy of re-invention that cycles through with innovation and creation. This ceaseless cycle of new styles and trends that exists among designers, retailers and consumers remains a growing strong enclave within which the fashion industry continues to stand tall as a major economic influence. Fundamentally fashion here is not just about the clothes stuff and does not cover all aspects of culture..
Virtual Fitting Room Market Regional Insights:
Asia Pacific is Expected to Dominate the Market Over the Forecast period
- Most promising in the Asia Pacific virtual fitting room market is the prevailing trend spearheaded by various factors which have been the catalyst to the flourishing of this technology across countries in the region. With the huge amount of e-commerce sales in china, the country becomes an significant contributor of growth in the global virtual fitting room industry. Powered by a large internet user number and a rapidly expanding group of middle class people who are more and more open to digital shopping experiences, Chinese shoppers are looking for creative approaches to improve their online purchase route. Subsequently, leading e-commerce platforms and retail brands in China are fiercely integrating effective virtual fitting room technologies by means of wise AI and AR capabilities, which provides consumers with interactive and personalized shopping experience that resembles in store trying-ons.
- This trend is not an exception for Japan and South Korea; leaders in technology with highly developed e-commerce systems are following the same path, choosing virtual fitting room options more and more. Japanese customers especially often use "virtual try-on" technology since they are known for their exceptional taste and high-quality products so that they are more confident in buying online in the field of e-commerce where is highly competitive. In addition, South Korea's consumers, who tend to be influenced by fashion and beauty trends, can now explore a new avenue to try out several clothing styles or makeup products before they make a purchase using the virtual fitting rooms.
- Furthermore, the virtual fitting room market in Southeast Asian emerging countries, say Indonesia, Thailand, and Vietnam, provide a fresh market that is still unoccupied. Not surprisingly then, with the rising popularity of smartphones and the shopping-orientated nature of the region’s youthful populace, retailers and e-commerce sites are beginning to see virtual fitting rooms as a realisable practice that would entice consumers to make purchases, reduce returns and improve overall customer satisfaction. And as a consequence, the number of these partnership between technology suppliers and local retailers has increased causing the increment of the adoption rate of virtual fitting room technologies in Southeast Asia.
Active Key Players in the Virtual Fitting Market:
- Perfitly,
- triMirror,
- Zugara Inc.,
- 3D-A-Porter,
- Magic Mirror,
- Visualook,
- Fit Analytics,
- AstraFit,
- ELSE Corp,
- Secret Sauce Partner,
- SIzebay,
- Virtooal,
- Fision AG,
- True Fit Corporation.
- Other Key Players
Key Industry Developments in the Virtual Fitting Room Market:
- September 2022-:NeXR Technologies SE and H&M Thailand collaborated on the virtual fitting solution implementation. Thus this collaboration between H&M Thailand and NeXR will change the whole retail business to a new creative and special level and give their unique body measurements to the customers to make their shopping unique.
- July 2022-:Hugo Boss introduced the 3D digital dressing room through a collaboration with Reactive Reality, a virtual try-on company. This close collaboration, according to both companies, is representing a milestone in fashion and demonstrating new creative ways consumers can connect online stores, thus pushing the envelope of retail industry.
- June 2022-:UK/Germany-based To Act Brand, the women's apparel brand that targets the sizes 42 – 54, joined hands with Perfitly, a technology company that provides AR/VR powered virtual fitting room solutions. Via this, To Act Brand strives to enhance customers experience better while at the same time increasing conversion and decrease returns rates through using Perfitly's virtual fitting system including size visualization and reference in the e-commerce channel.
|
Global Virtual Fitting Room Market |
|||
|
Base Year: |
2023 |
Forecast Period: |
2024-2032 |
|
Historical Data: |
2017 to 2023 |
Market Size in 2023: |
USD 4.8 Bn. |
|
Forecast Period 2024-32 CAGR: |
21.10 % |
Market Size in 2032: |
USD 26.8 Bn. |
|
Segments Covered: |
By Component Type |
|
|
|
By Application |
|
||
|
By Region |
|
||
|
Key Market Drivers: |
|
||
|
Key Market Restraints: |
|
||
|
Key Opportunities: |
|
||
|
Companies Covered in the report: |
|
||
Chapter 1: Introduction
1.1 Scope and Coverage
Chapter 2:Executive Summary
Chapter 3: Market Landscape
3.1 Market Dynamics
3.1.1 Drivers
3.1.2 Restraints
3.1.3 Opportunities
3.1.4 Challenges
3.2 Market Trend Analysis
3.3 PESTLE Analysis
3.4 Porter's Five Forces Analysis
3.5 Industry Value Chain Analysis
3.6 Ecosystem
3.7 Regulatory Landscape
3.8 Price Trend Analysis
3.9 Patent Analysis
3.10 Technology Evolution
3.11 Investment Pockets
3.12 Import-Export Analysis
Chapter 4: Virtual Fitting Room Market by Component Type (2018-2032)
4.1 Virtual Fitting Room Market Snapshot and Growth Engine
4.2 Market Overview
4.3 Hardware
4.3.1 Introduction and Market Overview
4.3.2 Historic and Forecasted Market Size in Value USD and Volume Units
4.3.3 Key Market Trends, Growth Factors, and Opportunities
4.3.4 Geographic Segmentation Analysis
4.4 Software
4.5 Services
Chapter 5: Virtual Fitting Room Market by Application (2018-2032)
5.1 Virtual Fitting Room Market Snapshot and Growth Engine
5.2 Market Overview
5.3 Apparel
5.3.1 Introduction and Market Overview
5.3.2 Historic and Forecasted Market Size in Value USD and Volume Units
5.3.3 Key Market Trends, Growth Factors, and Opportunities
5.3.4 Geographic Segmentation Analysis
5.4 Jewellery
5.5 Eye Wear
5.6 Watches
5.7 Beauty & Cosmetics
Chapter 6: Company Profiles and Competitive Analysis
6.1 Competitive Landscape
6.1.1 Competitive Benchmarking
6.1.2 Virtual Fitting Room Market Share by Manufacturer (2024)
6.1.3 Industry BCG Matrix
6.1.4 Heat Map Analysis
6.1.5 Mergers and Acquisitions
6.2 PRINKER (SOUTH KOREA)
6.2.1 Company Overview
6.2.2 Key Executives
6.2.3 Company Snapshot
6.2.4 Role of the Company in the Market
6.2.5 Sustainability and Social Responsibility
6.2.6 Operating Business Segments
6.2.7 Product Portfolio
6.2.8 Business Performance
6.2.9 Key Strategic Moves and Recent Developments
6.2.10 SWOT Analysis
6.3 TM INTERNATIONAL (US)
6.4 GRIFOLL PRINT PROMOTIONS S.L. (SPAIN)
6.5 TEAM DYNAMICS (UK)
6.6 PROMOSKIN.EU (BELGIUM)
6.7 INKBOX INK INC. (CANADA)
6.8 TATTOOFUN INC (US)
6.9 HORIZONSOURCES (FRANCE)
6.10 INKWEAR (UK)
6.11 MOMENTARY INK (US)
6.12 TINSLEY TRANSFER (US)
6.13 TEMPORARY TATTOOS (US)
6.14 TATTOOEDNOW (GERMANY)
6.15 TATTLY (US)
6.16 TATTOOTATU (CZECH REPUBLIC)
6.17 BUZZ TEMPORARY TATTOOS (US)
6.18 RIFOL (SPAIN)
Chapter 7: Global Virtual Fitting Room Market By Region
7.1 Overview
7.2. North America Virtual Fitting Room Market
7.2.1 Key Market Trends, Growth Factors and Opportunities
7.2.2 Top Key Companies
7.2.3 Historic and Forecasted Market Size by Segments
7.2.4 Historic and Forecasted Market Size by Component Type
7.2.4.1 Hardware
7.2.4.2 Software
7.2.4.3 Services
7.2.5 Historic and Forecasted Market Size by Application
7.2.5.1 Apparel
7.2.5.2 Jewellery
7.2.5.3 Eye Wear
7.2.5.4 Watches
7.2.5.5 Beauty & Cosmetics
7.2.6 Historic and Forecast Market Size by Country
7.2.6.1 US
7.2.6.2 Canada
7.2.6.3 Mexico
7.3. Eastern Europe Virtual Fitting Room Market
7.3.1 Key Market Trends, Growth Factors and Opportunities
7.3.2 Top Key Companies
7.3.3 Historic and Forecasted Market Size by Segments
7.3.4 Historic and Forecasted Market Size by Component Type
7.3.4.1 Hardware
7.3.4.2 Software
7.3.4.3 Services
7.3.5 Historic and Forecasted Market Size by Application
7.3.5.1 Apparel
7.3.5.2 Jewellery
7.3.5.3 Eye Wear
7.3.5.4 Watches
7.3.5.5 Beauty & Cosmetics
7.3.6 Historic and Forecast Market Size by Country
7.3.6.1 Russia
7.3.6.2 Bulgaria
7.3.6.3 The Czech Republic
7.3.6.4 Hungary
7.3.6.5 Poland
7.3.6.6 Romania
7.3.6.7 Rest of Eastern Europe
7.4. Western Europe Virtual Fitting Room Market
7.4.1 Key Market Trends, Growth Factors and Opportunities
7.4.2 Top Key Companies
7.4.3 Historic and Forecasted Market Size by Segments
7.4.4 Historic and Forecasted Market Size by Component Type
7.4.4.1 Hardware
7.4.4.2 Software
7.4.4.3 Services
7.4.5 Historic and Forecasted Market Size by Application
7.4.5.1 Apparel
7.4.5.2 Jewellery
7.4.5.3 Eye Wear
7.4.5.4 Watches
7.4.5.5 Beauty & Cosmetics
7.4.6 Historic and Forecast Market Size by Country
7.4.6.1 Germany
7.4.6.2 UK
7.4.6.3 France
7.4.6.4 The Netherlands
7.4.6.5 Italy
7.4.6.6 Spain
7.4.6.7 Rest of Western Europe
7.5. Asia Pacific Virtual Fitting Room Market
7.5.1 Key Market Trends, Growth Factors and Opportunities
7.5.2 Top Key Companies
7.5.3 Historic and Forecasted Market Size by Segments
7.5.4 Historic and Forecasted Market Size by Component Type
7.5.4.1 Hardware
7.5.4.2 Software
7.5.4.3 Services
7.5.5 Historic and Forecasted Market Size by Application
7.5.5.1 Apparel
7.5.5.2 Jewellery
7.5.5.3 Eye Wear
7.5.5.4 Watches
7.5.5.5 Beauty & Cosmetics
7.5.6 Historic and Forecast Market Size by Country
7.5.6.1 China
7.5.6.2 India
7.5.6.3 Japan
7.5.6.4 South Korea
7.5.6.5 Malaysia
7.5.6.6 Thailand
7.5.6.7 Vietnam
7.5.6.8 The Philippines
7.5.6.9 Australia
7.5.6.10 New Zealand
7.5.6.11 Rest of APAC
7.6. Middle East & Africa Virtual Fitting Room Market
7.6.1 Key Market Trends, Growth Factors and Opportunities
7.6.2 Top Key Companies
7.6.3 Historic and Forecasted Market Size by Segments
7.6.4 Historic and Forecasted Market Size by Component Type
7.6.4.1 Hardware
7.6.4.2 Software
7.6.4.3 Services
7.6.5 Historic and Forecasted Market Size by Application
7.6.5.1 Apparel
7.6.5.2 Jewellery
7.6.5.3 Eye Wear
7.6.5.4 Watches
7.6.5.5 Beauty & Cosmetics
7.6.6 Historic and Forecast Market Size by Country
7.6.6.1 Turkiye
7.6.6.2 Bahrain
7.6.6.3 Kuwait
7.6.6.4 Saudi Arabia
7.6.6.5 Qatar
7.6.6.6 UAE
7.6.6.7 Israel
7.6.6.8 South Africa
7.7. South America Virtual Fitting Room Market
7.7.1 Key Market Trends, Growth Factors and Opportunities
7.7.2 Top Key Companies
7.7.3 Historic and Forecasted Market Size by Segments
7.7.4 Historic and Forecasted Market Size by Component Type
7.7.4.1 Hardware
7.7.4.2 Software
7.7.4.3 Services
7.7.5 Historic and Forecasted Market Size by Application
7.7.5.1 Apparel
7.7.5.2 Jewellery
7.7.5.3 Eye Wear
7.7.5.4 Watches
7.7.5.5 Beauty & Cosmetics
7.7.6 Historic and Forecast Market Size by Country
7.7.6.1 Brazil
7.7.6.2 Argentina
7.7.6.3 Rest of SA
Chapter 8 Analyst Viewpoint and Conclusion
8.1 Recommendations and Concluding Analysis
8.2 Potential Market Strategies
Chapter 9 Research Methodology
9.1 Research Process
9.2 Primary Research
9.3 Secondary Research
|
Global Virtual Fitting Room Market |
|||
|
Base Year: |
2023 |
Forecast Period: |
2024-2032 |
|
Historical Data: |
2017 to 2023 |
Market Size in 2023: |
USD 4.8 Bn. |
|
Forecast Period 2024-32 CAGR: |
21.10 % |
Market Size in 2032: |
USD 26.8 Bn. |
|
Segments Covered: |
By Component Type |
|
|
|
By Application |
|
||
|
By Region |
|
||
|
Key Market Drivers: |
|
||
|
Key Market Restraints: |
|
||
|
Key Opportunities: |
|
||
|
Companies Covered in the report: |
|
||


