


Traffic Safety System Market Synopsis
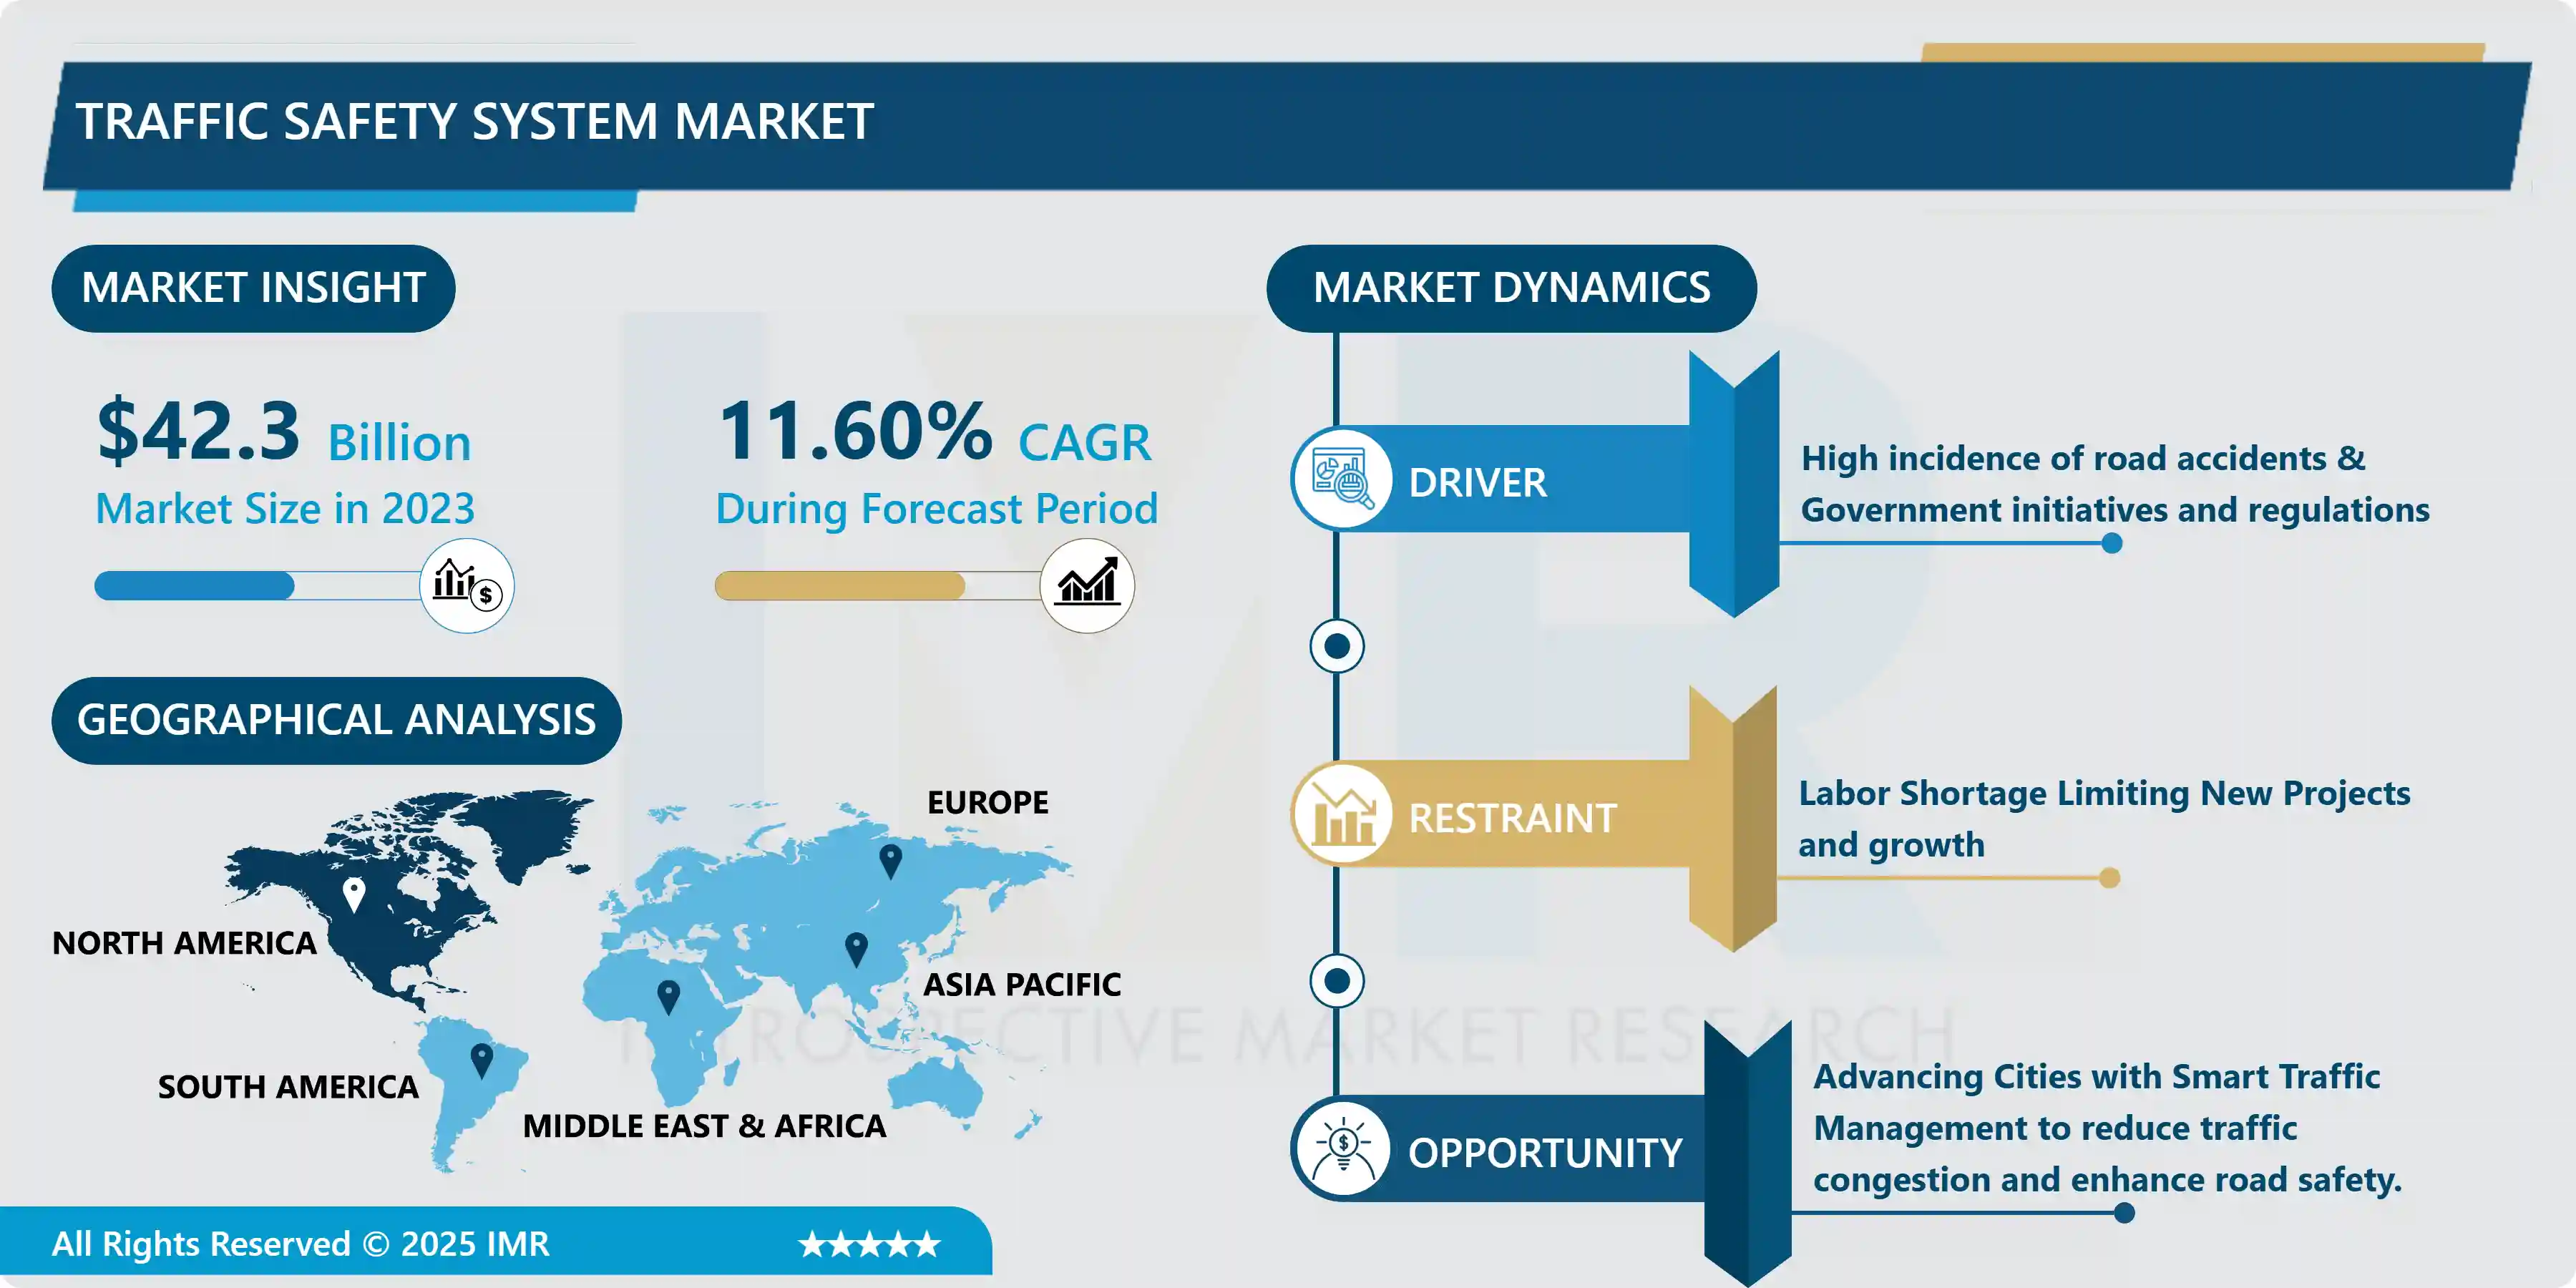
Traffic Safety System Market Size Was Valued at USD 42.3 Billion in 2023, and is Projected to Reach USD 113.58 Billion by 2032, Growing at a CAGR of 11.60% from 2024-2032.
A traffic management system is a cultivated, united system that strives to promote safety, improve traffic flow, and increase overall transportation system effectiveness. To gather and analyse real-time data concerning traffic conditions, it relies on cutting-edge technology like sensors, cameras, communication networks, Automatic Number Plate Detection, and others. Using traffic lights, road signs, and other traffic control equipment and tools, this data is utilized and used to control traffic flow and to give vehicle drivers real-time information on accidents, traffic congestion, and other problems related to traffic.
Reducing traffic jams, improving safety, and boosting the performance of the transportation system as a whole are the main objectives of a traffic management system. The technology can contribute to cutting commute times, lowering fuel consumption and emissions, and improving the general quality of life for city dwellers by streamlining traffic and easing congestion.
The device can also help to lower the chance of accidents and other occurrences by giving drivers real-time traffic information, hence improving safety and security on the roadways.
Overall, a traffic management system is a crucial part of transportation infrastructure, and as traffic volumes grow and urban populations rise, so will the significance of this component. To maintain and manage the security, effectiveness, and sustainability of our transportation networks, traffic management system development and deployment must be given top priority by transportation planners, politicians, and Government bodies.
Traffic Safety System Market Trend Analysis
High incidence of road accidents & Government initiatives and regulations
- According to the data from WHO, Road crashes are the leading killer of children and youth, and they typically strike during our most productive years, causing huge health, social, and economic harm throughout society Since 2010, deaths from road crashes have fallen slightly to 1.19 million per year. More than half of all UN Member States, including some of the worst-affected countries, report a decline in deaths. Road traffic deaths and injuries remain a major global health and development challenge.
- Globally, 28% of all fatalities occur in the WHO South-East Asia Region, 25% in the Western Pacific Region, 19% in the African Region, 12% in the Region of the Americas, 11% in the Eastern Mediterranean Region, and 5% in the European Region. As of 2019, road traffic crashes are the leading killer of children and youth aged 5 to 29 years and are the 12th leading cause of death when all ages are considered. traffic deaths in 2021 – a 5% drop when compared to the 1.25 million deaths in 2010. More than half of all United Nations Member States reduced road traffic deaths between 2010 and 2021.
- Report of the Ministry of Road Transport and Highways (2022) states that During 2022, a total of 4,61,312 accidents were recorded in the country, of which, 1,51,997 (32.9%) took place on the National Highways (NH) including Expressways, 1,06,682 (23.1%) on State Highways (SH) and the remaining 2,02,633 (43.9%) on Other Roads. Out of the total of 1,68,491 fatalities reported in 2022, 61,038 (36.2%) were on National Highways, 41,012 (24.3%) were on State Highways and 66,441 (39.4%) were on Other Roads. Out of the total, 1,55,781 fatal accidents reported in 2022, 55,571 (35.7%) were on National Highways, 37,861 (24.3%) were on State Highways and 62,349 (40%) were on Other Roads.
- This information reveals an alarming lack of progress in advancing laws and rising demand for Road and traffic safety management systems and standards.
Advancing Cities with Smart Traffic Management to reduce traffic congestion and enhance road safety.
- Smart Traffic Management Systems are technology solutions that municipalities and government bodies can integrate into their traffic cabinets and intersections today for fast, cost-effective improvements in safety and traffic flow on their city streets. Intelligent transportation systems (ITS), or smart traffic management systems, provide an organized, integrated approach to lessening traffic problems, congestion, and accidents, and improving safety on city streets through connected technology.
- These systems apply sensors, cameras, cellular routers, and automation to monitor and automatically direct traffic and reduce congestion. The right technology solution can be scaled to any size and painlessly upgraded at any time. Simultaneously, these technology solutions prepare Smart Cities for coming technological evolutions, including Connected Vehicles and the full deployment of 5G networks.
Traffic Safety System Market Segment Analysis:
Traffic Safety System Market is Segmented based on By Solution, Services, System, and End User.
By System, Automatic Number Plate Recognition (ANPR) segment is expected to dominate the market during the forecast period
- The Automatic Number Plate Recognition (ANPR) phase is the highest contributor to the street safety marketplace and is expected to grow all through the forecast length. Users like malls, theatres, restaurants, parking masses, avenue intersections, faculties, and private land, among others, contribute notably to the ALPR section's sales proportion. It is also used widely to get a car back if it's been stolen or used illegally.
- This more and more in-call feature can come across and examine license plates to make it a good deal simpler for customers, or the authorities, to quickly pick out any car at the scene.
By End User, the Government Agencies segment held the largest share in 2023
- Governments everywhere concentrate on maintaining traffic order and guaranteeing commuter safety to reduce worryingly high traffic-related deaths. Government Agencies are the important thing and vital customers of traffic system management. They use these systems to alter and They use these systems to regulate traffic laws and increase safety on public roads. The scope of those systems typically includes speed and light enforcement, computerized road safety, traffic Congestion control, Traffic data collection, and different traffic management services.
- Government authorities need traffic system to monitor the complete highway by various sensors & technologies to take corrective actions that ultimately result in the assurance of safe journeys for road users, enhanced efficiency, productivity, mobility, and better highway traffic
Traffic Safety System Market Regional Insights:
North America is Expected to Dominate the Market Over the Forecast Period
- North American Countries like the United States and Canada are reducing traffic congestion by changing their transportation infrastructure. Telematics service providers in the region aim to develop new solutions and services. The US Department of Transportation (DOT) is taking several initiatives and stands for smart cities and advanced transportation technologies.
- For vehicles in traffic management systems, solutions such as wireless safety communication and integrated hands-free mobile phones are being developed to improve safety.
Active Key Players in the Traffic Safety System Market
- IBM (U.S.)
- Dicke Safety Products (U.S.)
- Traffic Signs & Safety (U.S.)
- Roadtech Manufacturing (U.S.)
- Pro-Line Safety Products (U.S.)
- The Cortina Companies (U.S.)
- 3M (U.S.)
- Honeywell International Inc. (U.S.)
- Pexco LLC. (U.S.)
- Emedco (U.S.)
- Cubic Corporation (U.S.)
- FLIR Systems (U.S.)
- Iteris Inc. (U.S.)
- Zumar Industries Inc. (U.S.)
- Greenlite (Canada)
- WSP Global (Canada)
- Siemens Mobility (Germany)
- Lacroix Group (France)
- Thales Group (France)
- Kapsch TrafficCom (Austria)
- Swarco AG (Austria)
- Swarco Traffic (Austria)
- TomTom (Netherlands)
- Delmon Group of Companies (UAE)
- Zhejiang Traffic Safety Products (China)
Key Industry Developments in the Traffic Safety System Market:
- In March 2024, IBM acquires Pliant to further enhance network IT automation capabilities. IBM announced that it has acquired Pliant, a leading provider of network and IT infrastructure automation products. Pliant adds essential features to automate network and IT infrastructure tasks and bring those features to the application layer, giving applications (and developers) maximum control oversimplifying and managing infrastructure directly within applications.
- In June 2023, Siemens Mobility acquired Optrail to expand the functionality of its train planning system. Siemens Mobility has completed the Italian technology company Optrail S.r.l. an acquisition that provides traffic management systems - TMS - with unique algorithms based on mathematical optimization methods and operational research. The acquisition complements Siemens Mobility's existing train planning system - TPS portfolio and strengthens its position as a leading provider of software solutions for railway customers.
|
Global Traffic Safety System Market |
|||
|
Base Year: |
2023 |
Forecast Period: |
2024-2032 |
|
Historical Data: |
2017 to 2023 |
Market Size in 2023: |
USD 42.3 Bn. |
|
Forecast Period 2024-32 CAGR: |
11.60% |
Market Size in 2032: |
USD 113.58 Bn. |
|
Segments Covered: |
By Solution |
|
|
|
By Services |
|
||
|
By System |
|
||
|
By End User |
|
||
|
By Region |
|
||
|
Key Market Drivers: |
|
||
|
Key Market Restraints: |
|
||
|
Key Opportunities: |
|
||
|
Companies Covered in the report: |
|
||
Chapter 1: Introduction
1.1 Scope and Coverage
Chapter 2:Executive Summary
Chapter 3: Market Landscape
3.1 Market Dynamics
3.1.1 Drivers
3.1.2 Restraints
3.1.3 Opportunities
3.1.4 Challenges
3.2 Market Trend Analysis
3.3 PESTLE Analysis
3.4 Porter's Five Forces Analysis
3.5 Industry Value Chain Analysis
3.6 Ecosystem
3.7 Regulatory Landscape
3.8 Price Trend Analysis
3.9 Patent Analysis
3.10 Technology Evolution
3.11 Investment Pockets
3.12 Import-Export Analysis
Chapter 4: Traffic Safety System Market by Solution (2018-2032)
4.1 Traffic Safety System Market Snapshot and Growth Engine
4.2 Market Overview
4.3 Red Light Enforcement
4.3.1 Introduction and Market Overview
4.3.2 Historic and Forecasted Market Size in Value USD and Volume Units
4.3.3 Key Market Trends, Growth Factors, and Opportunities
4.3.4 Geographic Segmentation Analysis
4.4 Speed Enforcement
4.5 Speed Enforcement
4.6 Incident Detection and Response
Chapter 5: Traffic Safety System Market by Services (2018-2032)
5.1 Traffic Safety System Market Snapshot and Growth Engine
5.2 Market Overview
5.3 Consulting
5.3.1 Introduction and Market Overview
5.3.2 Historic and Forecasted Market Size in Value USD and Volume Units
5.3.3 Key Market Trends, Growth Factors, and Opportunities
5.3.4 Geographic Segmentation Analysis
5.4 Support and Maintenance
5.5 Integration and Deployment
Chapter 6: Traffic Safety System Market by System (2018-2032)
6.1 Traffic Safety System Market Snapshot and Growth Engine
6.2 Market Overview
6.3 Speed Enforcement Systems
6.3.1 Introduction and Market Overview
6.3.2 Historic and Forecasted Market Size in Value USD and Volume Units
6.3.3 Key Market Trends, Growth Factors, and Opportunities
6.3.4 Geographic Segmentation Analysis
6.4 Video Surveillance Systems
6.5 Congestion Management Systems
6.6 Variable Message Signs (VMS)
6.7 Traffic Counters and Classifiers
6.8 Incident Detection Systems
6.9 Automatic Number Plate Recognition (ANPR)
Chapter 7: Traffic Safety System Market by End User (2018-2032)
7.1 Traffic Safety System Market Snapshot and Growth Engine
7.2 Market Overview
7.3 Government Agencies
7.3.1 Introduction and Market Overview
7.3.2 Historic and Forecasted Market Size in Value USD and Volume Units
7.3.3 Key Market Trends, Growth Factors, and Opportunities
7.3.4 Geographic Segmentation Analysis
7.4 Construction Companies
7.5 Transportation Companies
Chapter 8: Company Profiles and Competitive Analysis
8.1 Competitive Landscape
8.1.1 Competitive Benchmarking
8.1.2 Traffic Safety System Market Share by Manufacturer (2024)
8.1.3 Industry BCG Matrix
8.1.4 Heat Map Analysis
8.1.5 Mergers and Acquisitions
8.2 COGNIZANT (US)
8.2.1 Company Overview
8.2.2 Key Executives
8.2.3 Company Snapshot
8.2.4 Role of the Company in the Market
8.2.5 Sustainability and Social Responsibility
8.2.6 Operating Business Segments
8.2.7 Product Portfolio
8.2.8 Business Performance
8.2.9 Key Strategic Moves and Recent Developments
8.2.10 SWOT Analysis
8.3 IBM CORPORATION (US)
8.4 DXC TECHNOLOGY (US)
8.5 QUALITEST (US)
8.6 EPAM SYSTEMS (US)
8.7 VIRTUSA CORPORATION (US)
8.8 UST GLOBAL (US)
8.9 SYNTEL (US)
8.10 INFOSYS PUBLIC SERVICES INC. (US)
8.11 CGI INC. (CANADA)
8.12 GFT TECHNOLOGIES SE (GERMANY)
8.13 SQS SOFTWARE QUALITY SYSTEMS AG (GERMANY)
8.14 CAPGEMINI (FRANCE)
8.15 ACCENTURE (IRELAND)
8.16 TIETOEVRY (FINLAND)
8.17 INFOSYS (INDIA)
8.18 WIPRO (INDIA)
8.19 TATA CONSULTANCY SERVICES (INDIA)
8.20 HCL TECHNOLOGIES (INDIA)
8.21 TECH MAHINDRA (INDIA)
8.22 MINDTREE (INDIA)
8.23 L&T INFOTECH (INDIA)
8.24 HEXAWARE TECHNOLOGIES (INDIA)
8.25 NIIT TECHNOLOGIES (INDIA)
8.26 MASTEK LIMITED (INDIA)
8.27
Chapter 9: Global Traffic Safety System Market By Region
9.1 Overview
9.2. North America Traffic Safety System Market
9.2.1 Key Market Trends, Growth Factors and Opportunities
9.2.2 Top Key Companies
9.2.3 Historic and Forecasted Market Size by Segments
9.2.4 Historic and Forecasted Market Size by Solution
9.2.4.1 Red Light Enforcement
9.2.4.2 Speed Enforcement
9.2.4.3 Speed Enforcement
9.2.4.4 Incident Detection and Response
9.2.5 Historic and Forecasted Market Size by Services
9.2.5.1 Consulting
9.2.5.2 Support and Maintenance
9.2.5.3 Integration and Deployment
9.2.6 Historic and Forecasted Market Size by System
9.2.6.1 Speed Enforcement Systems
9.2.6.2 Video Surveillance Systems
9.2.6.3 Congestion Management Systems
9.2.6.4 Variable Message Signs (VMS)
9.2.6.5 Traffic Counters and Classifiers
9.2.6.6 Incident Detection Systems
9.2.6.7 Automatic Number Plate Recognition (ANPR)
9.2.7 Historic and Forecasted Market Size by End User
9.2.7.1 Government Agencies
9.2.7.2 Construction Companies
9.2.7.3 Transportation Companies
9.2.8 Historic and Forecast Market Size by Country
9.2.8.1 US
9.2.8.2 Canada
9.2.8.3 Mexico
9.3. Eastern Europe Traffic Safety System Market
9.3.1 Key Market Trends, Growth Factors and Opportunities
9.3.2 Top Key Companies
9.3.3 Historic and Forecasted Market Size by Segments
9.3.4 Historic and Forecasted Market Size by Solution
9.3.4.1 Red Light Enforcement
9.3.4.2 Speed Enforcement
9.3.4.3 Speed Enforcement
9.3.4.4 Incident Detection and Response
9.3.5 Historic and Forecasted Market Size by Services
9.3.5.1 Consulting
9.3.5.2 Support and Maintenance
9.3.5.3 Integration and Deployment
9.3.6 Historic and Forecasted Market Size by System
9.3.6.1 Speed Enforcement Systems
9.3.6.2 Video Surveillance Systems
9.3.6.3 Congestion Management Systems
9.3.6.4 Variable Message Signs (VMS)
9.3.6.5 Traffic Counters and Classifiers
9.3.6.6 Incident Detection Systems
9.3.6.7 Automatic Number Plate Recognition (ANPR)
9.3.7 Historic and Forecasted Market Size by End User
9.3.7.1 Government Agencies
9.3.7.2 Construction Companies
9.3.7.3 Transportation Companies
9.3.8 Historic and Forecast Market Size by Country
9.3.8.1 Russia
9.3.8.2 Bulgaria
9.3.8.3 The Czech Republic
9.3.8.4 Hungary
9.3.8.5 Poland
9.3.8.6 Romania
9.3.8.7 Rest of Eastern Europe
9.4. Western Europe Traffic Safety System Market
9.4.1 Key Market Trends, Growth Factors and Opportunities
9.4.2 Top Key Companies
9.4.3 Historic and Forecasted Market Size by Segments
9.4.4 Historic and Forecasted Market Size by Solution
9.4.4.1 Red Light Enforcement
9.4.4.2 Speed Enforcement
9.4.4.3 Speed Enforcement
9.4.4.4 Incident Detection and Response
9.4.5 Historic and Forecasted Market Size by Services
9.4.5.1 Consulting
9.4.5.2 Support and Maintenance
9.4.5.3 Integration and Deployment
9.4.6 Historic and Forecasted Market Size by System
9.4.6.1 Speed Enforcement Systems
9.4.6.2 Video Surveillance Systems
9.4.6.3 Congestion Management Systems
9.4.6.4 Variable Message Signs (VMS)
9.4.6.5 Traffic Counters and Classifiers
9.4.6.6 Incident Detection Systems
9.4.6.7 Automatic Number Plate Recognition (ANPR)
9.4.7 Historic and Forecasted Market Size by End User
9.4.7.1 Government Agencies
9.4.7.2 Construction Companies
9.4.7.3 Transportation Companies
9.4.8 Historic and Forecast Market Size by Country
9.4.8.1 Germany
9.4.8.2 UK
9.4.8.3 France
9.4.8.4 The Netherlands
9.4.8.5 Italy
9.4.8.6 Spain
9.4.8.7 Rest of Western Europe
9.5. Asia Pacific Traffic Safety System Market
9.5.1 Key Market Trends, Growth Factors and Opportunities
9.5.2 Top Key Companies
9.5.3 Historic and Forecasted Market Size by Segments
9.5.4 Historic and Forecasted Market Size by Solution
9.5.4.1 Red Light Enforcement
9.5.4.2 Speed Enforcement
9.5.4.3 Speed Enforcement
9.5.4.4 Incident Detection and Response
9.5.5 Historic and Forecasted Market Size by Services
9.5.5.1 Consulting
9.5.5.2 Support and Maintenance
9.5.5.3 Integration and Deployment
9.5.6 Historic and Forecasted Market Size by System
9.5.6.1 Speed Enforcement Systems
9.5.6.2 Video Surveillance Systems
9.5.6.3 Congestion Management Systems
9.5.6.4 Variable Message Signs (VMS)
9.5.6.5 Traffic Counters and Classifiers
9.5.6.6 Incident Detection Systems
9.5.6.7 Automatic Number Plate Recognition (ANPR)
9.5.7 Historic and Forecasted Market Size by End User
9.5.7.1 Government Agencies
9.5.7.2 Construction Companies
9.5.7.3 Transportation Companies
9.5.8 Historic and Forecast Market Size by Country
9.5.8.1 China
9.5.8.2 India
9.5.8.3 Japan
9.5.8.4 South Korea
9.5.8.5 Malaysia
9.5.8.6 Thailand
9.5.8.7 Vietnam
9.5.8.8 The Philippines
9.5.8.9 Australia
9.5.8.10 New Zealand
9.5.8.11 Rest of APAC
9.6. Middle East & Africa Traffic Safety System Market
9.6.1 Key Market Trends, Growth Factors and Opportunities
9.6.2 Top Key Companies
9.6.3 Historic and Forecasted Market Size by Segments
9.6.4 Historic and Forecasted Market Size by Solution
9.6.4.1 Red Light Enforcement
9.6.4.2 Speed Enforcement
9.6.4.3 Speed Enforcement
9.6.4.4 Incident Detection and Response
9.6.5 Historic and Forecasted Market Size by Services
9.6.5.1 Consulting
9.6.5.2 Support and Maintenance
9.6.5.3 Integration and Deployment
9.6.6 Historic and Forecasted Market Size by System
9.6.6.1 Speed Enforcement Systems
9.6.6.2 Video Surveillance Systems
9.6.6.3 Congestion Management Systems
9.6.6.4 Variable Message Signs (VMS)
9.6.6.5 Traffic Counters and Classifiers
9.6.6.6 Incident Detection Systems
9.6.6.7 Automatic Number Plate Recognition (ANPR)
9.6.7 Historic and Forecasted Market Size by End User
9.6.7.1 Government Agencies
9.6.7.2 Construction Companies
9.6.7.3 Transportation Companies
9.6.8 Historic and Forecast Market Size by Country
9.6.8.1 Turkiye
9.6.8.2 Bahrain
9.6.8.3 Kuwait
9.6.8.4 Saudi Arabia
9.6.8.5 Qatar
9.6.8.6 UAE
9.6.8.7 Israel
9.6.8.8 South Africa
9.7. South America Traffic Safety System Market
9.7.1 Key Market Trends, Growth Factors and Opportunities
9.7.2 Top Key Companies
9.7.3 Historic and Forecasted Market Size by Segments
9.7.4 Historic and Forecasted Market Size by Solution
9.7.4.1 Red Light Enforcement
9.7.4.2 Speed Enforcement
9.7.4.3 Speed Enforcement
9.7.4.4 Incident Detection and Response
9.7.5 Historic and Forecasted Market Size by Services
9.7.5.1 Consulting
9.7.5.2 Support and Maintenance
9.7.5.3 Integration and Deployment
9.7.6 Historic and Forecasted Market Size by System
9.7.6.1 Speed Enforcement Systems
9.7.6.2 Video Surveillance Systems
9.7.6.3 Congestion Management Systems
9.7.6.4 Variable Message Signs (VMS)
9.7.6.5 Traffic Counters and Classifiers
9.7.6.6 Incident Detection Systems
9.7.6.7 Automatic Number Plate Recognition (ANPR)
9.7.7 Historic and Forecasted Market Size by End User
9.7.7.1 Government Agencies
9.7.7.2 Construction Companies
9.7.7.3 Transportation Companies
9.7.8 Historic and Forecast Market Size by Country
9.7.8.1 Brazil
9.7.8.2 Argentina
9.7.8.3 Rest of SA
Chapter 10 Analyst Viewpoint and Conclusion
10.1 Recommendations and Concluding Analysis
10.2 Potential Market Strategies
Chapter 11 Research Methodology
11.1 Research Process
11.2 Primary Research
11.3 Secondary Research
|
Global Traffic Safety System Market |
|||
|
Base Year: |
2023 |
Forecast Period: |
2024-2032 |
|
Historical Data: |
2017 to 2023 |
Market Size in 2023: |
USD 42.3 Bn. |
|
Forecast Period 2024-32 CAGR: |
11.60% |
Market Size in 2032: |
USD 113.58 Bn. |
|
Segments Covered: |
By Solution |
|
|
|
By Services |
|
||
|
By System |
|
||
|
By End User |
|
||
|
By Region |
|
||
|
Key Market Drivers: |
|
||
|
Key Market Restraints: |
|
||
|
Key Opportunities: |
|
||
|
Companies Covered in the report: |
|
||


