


Tea PolyPhenols Market Synopsis
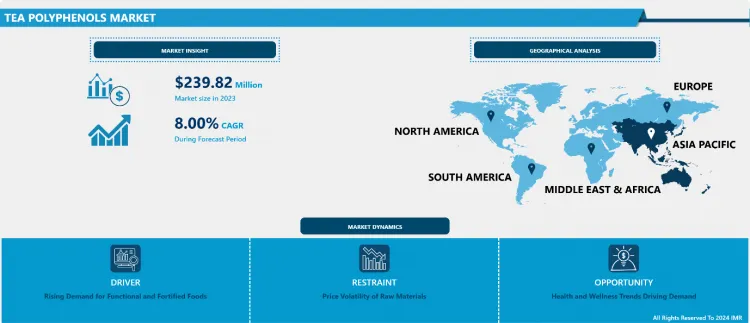
Tea PolyPhenols MarketSize Was Valued at USD 239.82 Million in 2024, and is Projected to Reach USD 479.40 Million by 2032, Growing at a CAGR of 8 % From 2025-2032.
Free radicals are highly reactive unstable molecules that circulate in the human body; these molecules can cause diseases and infections in the body due to their instability. There are catechins, theaflavins, tannins, and flavonoids which play role in the quality of tea in terms of colour and taste not forgetting the health aspect of it. These polyphenols have antioxidant effects on cells thereby preventing oxidation by free radicals, are beneficial to the heart, and may also have anti-cancer properties. Some of the prevalent categories of tea polyphenols are the flavan-3-ols especially the EGCG in green tea or theaflavins in black tea.
The Tea Polyphenols Market has shown spectacular growth in recent years and it is likely to experience more robust growth in the years to come because of the increasing health consciousness among people the world over and the use of polyphenols in so many industries. The bioactive compounds are Tea polyphenols which mainly include Catechins, Theaflavins and Tannins present in tea leaves that are powerful antioxidants. They have received a lot of attention longitudinally in relation to the reduction of chronic diseases like cardiovascular diseases diabetes and some forms of cancer. Due to the growing trend of consumers shifting more of their focus toward natural products, including organics, tea polyphenols are also expected to be safe and offered as health beneficial supplements.
Food and beverages is the largest industry thus far in the tea polyphenols market. These compounds are gradually being formulated into functional foods, drinks, and nutraceuticals due to the clinically-associated health benefits. The demand is especially high in regions like the Operations within North America and even Europe where customers are willing to go deeper into their pockets to purchase products that are associated with additional health benefits. Also the demand for the use of tea polyphenols as healthy products together with the increased use of nutraceuticals and cosmeceuticals have occasioned the increased market of the tea polyphenols. Cosmetics with tea polyphenol contents are being introduced in the market as it is known to help reduce aging and protect skin; these aspects are expected to drive the market.
The Asia-Pacific Desk has the largest market for tea polyphenols since the location has the oldest drinking tea custom and contains main tea producers including China, India, and Japan. The tea products consumption trend in the region has been high due the region’s tea culture meaning a high use of tea polyphenol products. On the same note, improved standard of living and the change of attitude that has seen people adopt healthier lifestyle has also seen market growth in these nations. Another factor is the changing diversification of new product formulations and novel tea polyphenol added products lined in the market.
This is mainly due to factors such as inherent price vulnerability of the raw materials used in production of tea polyphenols and the governing policies regarding the approval and use of polyphenols in food and medicine. Nevertheless, challenges such as fluctuating tea prices and volatility of other dynamics such as exchange rate values could be countered by improved extraction technologies and research and development evidence on the proven health benefits of tea polyphenols in today’s world. The continuing research, production and further developments in bioavailability and efficiency of the tea polyphenols are predicted to create future growth rates for the market.
Therefore, the tea polyphenols market is in a position to maintain the positive growth curve over the forecast period due to increased health consciousness, rising demand for natural products globally, and new applications across the different industries. Despite the current and projected slowdown in the growth rates of the market, there are prospects for development due to the creation of new attractive products, catering to today’s global trends and the increasing demand for healthier and more natural products.

Tea PolyPhenols Market Trend Analysis
Increasing Demand for Functional Beverages
- The functional beverages product segment has experienced tremendous growth in popularity due to the shift of consumer concerns to healthier segments. This trend has fuelled the rise of the tea polyphenols market, since these compunds are well known for their antioxidant effects and possible medicinal uses. Tea polyphenols obtainable from green tea, black tea, oolong tea, and others are now being added to energy drink, sports drinks, and flavored water since they assist in adding nutritional value to the foods, particularly in the energy and sports drinks that are becoming popular among people who are more conscious of health issues. People are slowly beginning to understand the possible health benefits associated with tea polyphenols given by continuing studies, some of which include the health of the heart, management of body weight and support of the immune system, hence there is expected to be an increase in the demand for functional beverages with these compounds in the near future.
- Also, emphasis on consumption of healthy foods and engaging in healthy lifestyles through functional and fortified food and beverages has encouraged consumption of functional beverages containing tea polyphenols. There has been a trend where consumers are now opting to consume water reliant food products that will be accompanied by several other health benefits. Thus, the beverage producers developed their products based on natural ingredients containing tea polyphenols for particular aims and purposes like combating stress, enhancing learning abilities, or improving digestion. Additionally, the global market for functional drinks experience growth due to the now trending towards natural ingredients and clean label products, where, the tea polyphenols perfectly fall in this aspect due to their plant origin and perceived health benefits. Thus, the market share within functional beverages segment for tea polyphenols is expected to show further increase in the future due to the growing popularity of such beverages that provide not only the basic need of refreshment but also several health benefits.
Health and Wellness Trends Driving Demand
-
Tea polyphenols, renowned for their antioxidant properties, are riding the wave of health and wellness trends shaping consumer behavior. As individuals increasingly prioritize preventive healthcare, they are turning to natural remedies like tea polyphenols to support their well-being. With growing concerns about chronic diseases and aging, consumers are seeking products that offer holistic benefits, including improved immune function, cardiovascular health, and skin rejuvenation all of which tea polyphenols are believed to promote. This demand is further fueled by the rising interest in functional foods and beverages, where tea polyphenols find extensive application due to their ability to enhance the nutritional profile of products without compromising taste or convenience.
- Moreover, as awareness of the environmental and social impacts of consumption grows, there's a shift towards sustainable and ethically sourced ingredients, which aligns well with the production processes of tea polyphenols. Consumers are not only looking for products that benefit their health but also ones that are produced in an environmentally responsible manner, fostering biodiversity and supporting local communities. This emphasis on sustainability adds another layer of appeal to tea polyphenols, positioning them as not just a health-promoting ingredient but also as a conscious choice for individuals mindful of their impact on the planet and society.
Tea PolyPhenols Market Segment Analysis:
Tea PolyPhenols Market is Segmented based on Type, Application and Distribution Channels.
By Type, Green Tea segment is expected to dominate the market during the forecast period
- Tea polyphenols, known for their potent antioxidant properties, are key constituents that contribute to the health benefits associated with various types of tea. Green tea, particularly abundant in catechins such as epigallocatechin gallate (EGCG), has garnered attention for its potential in combating oxidative stress and inflammation. The rising consumer inclination towards healthier lifestyles has propelled the demand for green tea polyphenols, especially in regions where traditional tea consumption is prevalent. Black tea, though fermented and possessing a different polyphenol profile compared to green tea, still contains significant levels of these compounds, particularly theaflavins and thearubigins, contributing to its antioxidant activity. However, Oolong tea, undergoing partial oxidation, presents a unique polyphenol composition with varying degrees of catechins and polymerized polyphenols, offering a distinct flavor profile and potential health benefits.
- The "Others" category encompasses a diverse range of teas such as white tea, herbal infusions, and blends, each with its own polyphenolic composition and health implications. White tea, minimally processed and rich in catechins and flavonoids, is gaining traction for its delicate flavor and purported health-promoting properties. Herbal teas, derived from various plant parts, offer a plethora of polyphenols with potential medicinal effects, contributing to their growing popularity among health-conscious consumers. Blends, combining different types of teas and botanicals, provide a multifaceted approach to polyphenol consumption, catering to diverse taste preferences and wellness goals. Overall, the by-type analysis of the tea polyphenols market underscores the significance of polyphenol-rich teas in meeting consumer demand for functional beverages with antioxidant benefits and diverse flavor profiles.
By Application , Food & Beverages segment held the largest share in 2024
- The tea polyphenols are innovative food additives and functional diets in the food and beverages category that are associated with numerous health benefits and antioxidant characteristics. They are widely used as a component for foods like teas, juices and energy drinks to boost the quality and to appeal to the nutritional and diabetic conscious market. Increasing trend towards natural and functional ingredients for the consumption in food and beverages is a major factor triggering the growth of tea polyphenols in this segment and manufacturers are now proving more valuable by adding these compounds to their products portfolio as the consumers are more conscious about their health.
- Global interest has recently been directed towards the potentials of tea polyphenols that have started to be used in cosmetics, particularly for anti-aging effects, UV protectiveness, and anti-inflammatory characteristics. Since the consumers are getting more sensitive towards the damages that are caused to the skin by the environmental pollutants as well as the ultraviolet related radiation, there is a good market demand for skincare products that contains natural elements like the tea polyphenols. Consequently, cosmetics producers are developing all sorts of skin care products such as creams, serums, and sunscreens containing tea polyphenols to fit in this niche market and accelerate the industry’s shift to clean-label and sustainable cosmetics.
Tea PolyPhenols Market Regional Insights:
Asia Pacific is Expected to Dominate the Market Over the Forecast period
- One of the critical trends expecting in the Tea PolyPhenols market over the years is growing domination of Asia Pacific region. The assumptions for the above projection are as follows. Firstly, Asia Pacific region represents some of the most significant tea producing countries including China, India and Japan to name a few which contribute to the key percentage of the global tea manufacture. Since tea polyphenols are derived from tea leaves, availability of infrastructure for tea cultivation in this region means a good source of supply for its extraction thus enabling market growth. In addition, as the overall awareness of the health effects of tea polyphenols including antioxidant and disease fighting or preventing substances, increases in the region, it also augments the market for Tea Powder and consolidates the region’s hold on the global market.
- Also, evolving consumer preference for natural and organic is in harmony with traditional characteristics of tea polyphenols, which are considered natural bioactive compounds. This is especially the case in China/India which are some of the largest users of traditional/indigenous systems that encourage the use of natural products. Additionally, global consumers’ inclination toward healthier diet due to the prevailing life style diseases, along with improved disposable income in the emerging Asia Pacific nations, is expected to lead towards higher spending on functional food and beverages including the products containing tea polyphenols. Therefore, Asia Pacific is forecasted to remain dominant and may even increase its market share of Tea PolyPolyphenols within the global domain over the forecast period.
Active Key Players in the Tea PolyPhenols Market
- Indena (Italy)
- DSM (Netherlands)
- Amax NutraSource (USA)
- Frutarom (Israel)
- Bioserae (France)
- Layn Natural Ingredients ( USA)
- DuPont-Danisco ( USA)
- FutureCeuticals ( USA)
- HERZA Schokolade (Germany)
- Martin Bauer Group(Germany)
- Naturex (France)
- Prinova ( USA)
- Sabinsa (India)
- Seppic (France)
- Other Active Players
|
Global Tea PolyPhenols Market |
|||
|
Base Year: |
2024 |
Forecast Period: |
2025-2032 |
|
Historical Data: |
2018 to 2023 |
Market Size in 2024: |
USD 239.82 Mn. |
|
Forecast Period 2024-32 CAGR: |
8.00% |
Market Size in 2032: |
USD 479.40 Mn. |
|
Segments Covered: |
By Type |
|
|
|
By Application |
|
||
|
By Distribution Channels |
|
||
|
By Region |
|
||
|
Key Market Drivers: |
|
||
|
Key Market Restraints: |
|
||
|
Key Opportunities: |
|
||
|
Companies Covered in the report: |
|
||
Chapter 1: Introduction
1.1 Scope and Coverage
Chapter 2:Executive Summary
Chapter 3: Market Landscape
3.1 Market Dynamics
3.1.1 Drivers
3.1.2 Restraints
3.1.3 Opportunities
3.1.4 Challenges
3.2 Market Trend Analysis
3.3 PESTLE Analysis
3.4 Porter's Five Forces Analysis
3.5 Industry Value Chain Analysis
3.6 Ecosystem
3.7 Regulatory Landscape
3.8 Price Trend Analysis
3.9 Patent Analysis
3.10 Technology Evolution
3.11 Investment Pockets
3.12 Import-Export Analysis
Chapter 4: Tea PolyPhenols Market by Type (2018-2032)
4.1 Tea PolyPhenols Market Snapshot and Growth Engine
4.2 Market Overview
4.3 Green Tea
4.3.1 Introduction and Market Overview
4.3.2 Historic and Forecasted Market Size in Value USD and Volume Units
4.3.3 Key Market Trends, Growth Factors, and Opportunities
4.3.4 Geographic Segmentation Analysis
4.4 Black Tea
4.5 Oolong Tea
4.6 Others
Chapter 5: Tea PolyPhenols Market by Application (2018-2032)
5.1 Tea PolyPhenols Market Snapshot and Growth Engine
5.2 Market Overview
5.3 Food & Beverages
5.3.1 Introduction and Market Overview
5.3.2 Historic and Forecasted Market Size in Value USD and Volume Units
5.3.3 Key Market Trends, Growth Factors, and Opportunities
5.3.4 Geographic Segmentation Analysis
5.4 Dietary Supplements
5.5 Functional Foods & Beverages
5.6 Cosmetics
5.7 Others
Chapter 6: Tea PolyPhenols Market by Distribution Channels (2018-2032)
6.1 Tea PolyPhenols Market Snapshot and Growth Engine
6.2 Market Overview
6.3 Online Retailing
6.3.1 Introduction and Market Overview
6.3.2 Historic and Forecasted Market Size in Value USD and Volume Units
6.3.3 Key Market Trends, Growth Factors, and Opportunities
6.3.4 Geographic Segmentation Analysis
6.4 Mass Retailers
6.5 Direct Selling
Chapter 7: Company Profiles and Competitive Analysis
7.1 Competitive Landscape
7.1.1 Competitive Benchmarking
7.1.2 Tea PolyPhenols Market Share by Manufacturer (2024)
7.1.3 Industry BCG Matrix
7.1.4 Heat Map Analysis
7.1.5 Mergers and Acquisitions
7.2 BASF SE (GERMANY)
7.2.1 Company Overview
7.2.2 Key Executives
7.2.3 Company Snapshot
7.2.4 Role of the Company in the Market
7.2.5 Sustainability and Social Responsibility
7.2.6 Operating Business Segments
7.2.7 Product Portfolio
7.2.8 Business Performance
7.2.9 Key Strategic Moves and Recent Developments
7.2.10 SWOT Analysis
7.3 TYSON FOODS INC. (USA)
7.4 LALLEMAND INC. (CANADA)
7.5 KEMIN INDUSTRIES (USA)
7.6 E. I. DU PONT DE NEMOURS AND COMPANY (DUPONT) (USA)
7.7 AJINOMOTO CO. INC. (JAPAN)
7.8 KONINKLIJKE DSM N.V. (NETHERLANDS)
7.9 AKZO NOBEL N.V. (NETHERLANDS)
7.10 ALLTECH INC. (USA)
7.11 BIOMIN GMBH (AUSTRIA)
7.12 CARGILL INC. (USA)
7.13 CHR. HANSEN HOLDING A/S (DENMARK)
7.14 CP GROUP (THAILAND)
7.15 EVONIK INDUSTRIES AG (GERMANY)
7.16 NOREL S.A. (SPAIN)
7.17 NOVOZYMES A/S (DENMARK)
7.18 NUTRECO (NETHERLANDS)
7.19 PHIBRO ANIMAL HEALTH CORPORATION (USA)
7.20 NOVUS INTERNATIONAL INC. (USA)
7.21 SOLVAY GROUP (BELGIUM)
7.22 ARCHER DANIELS MIDLAND COMPANY (ADM) (USA)
7.23 INVIVO GROUP (FRANCE)
Chapter 8: Global Tea PolyPhenols Market By Region
8.1 Overview
8.2. North America Tea PolyPhenols Market
8.2.1 Key Market Trends, Growth Factors and Opportunities
8.2.2 Top Key Companies
8.2.3 Historic and Forecasted Market Size by Segments
8.2.4 Historic and Forecasted Market Size by Type
8.2.4.1 Green Tea
8.2.4.2 Black Tea
8.2.4.3 Oolong Tea
8.2.4.4 Others
8.2.5 Historic and Forecasted Market Size by Application
8.2.5.1 Food & Beverages
8.2.5.2 Dietary Supplements
8.2.5.3 Functional Foods & Beverages
8.2.5.4 Cosmetics
8.2.5.5 Others
8.2.6 Historic and Forecasted Market Size by Distribution Channels
8.2.6.1 Online Retailing
8.2.6.2 Mass Retailers
8.2.6.3 Direct Selling
8.2.7 Historic and Forecast Market Size by Country
8.2.7.1 US
8.2.7.2 Canada
8.2.7.3 Mexico
8.3. Eastern Europe Tea PolyPhenols Market
8.3.1 Key Market Trends, Growth Factors and Opportunities
8.3.2 Top Key Companies
8.3.3 Historic and Forecasted Market Size by Segments
8.3.4 Historic and Forecasted Market Size by Type
8.3.4.1 Green Tea
8.3.4.2 Black Tea
8.3.4.3 Oolong Tea
8.3.4.4 Others
8.3.5 Historic and Forecasted Market Size by Application
8.3.5.1 Food & Beverages
8.3.5.2 Dietary Supplements
8.3.5.3 Functional Foods & Beverages
8.3.5.4 Cosmetics
8.3.5.5 Others
8.3.6 Historic and Forecasted Market Size by Distribution Channels
8.3.6.1 Online Retailing
8.3.6.2 Mass Retailers
8.3.6.3 Direct Selling
8.3.7 Historic and Forecast Market Size by Country
8.3.7.1 Russia
8.3.7.2 Bulgaria
8.3.7.3 The Czech Republic
8.3.7.4 Hungary
8.3.7.5 Poland
8.3.7.6 Romania
8.3.7.7 Rest of Eastern Europe
8.4. Western Europe Tea PolyPhenols Market
8.4.1 Key Market Trends, Growth Factors and Opportunities
8.4.2 Top Key Companies
8.4.3 Historic and Forecasted Market Size by Segments
8.4.4 Historic and Forecasted Market Size by Type
8.4.4.1 Green Tea
8.4.4.2 Black Tea
8.4.4.3 Oolong Tea
8.4.4.4 Others
8.4.5 Historic and Forecasted Market Size by Application
8.4.5.1 Food & Beverages
8.4.5.2 Dietary Supplements
8.4.5.3 Functional Foods & Beverages
8.4.5.4 Cosmetics
8.4.5.5 Others
8.4.6 Historic and Forecasted Market Size by Distribution Channels
8.4.6.1 Online Retailing
8.4.6.2 Mass Retailers
8.4.6.3 Direct Selling
8.4.7 Historic and Forecast Market Size by Country
8.4.7.1 Germany
8.4.7.2 UK
8.4.7.3 France
8.4.7.4 The Netherlands
8.4.7.5 Italy
8.4.7.6 Spain
8.4.7.7 Rest of Western Europe
8.5. Asia Pacific Tea PolyPhenols Market
8.5.1 Key Market Trends, Growth Factors and Opportunities
8.5.2 Top Key Companies
8.5.3 Historic and Forecasted Market Size by Segments
8.5.4 Historic and Forecasted Market Size by Type
8.5.4.1 Green Tea
8.5.4.2 Black Tea
8.5.4.3 Oolong Tea
8.5.4.4 Others
8.5.5 Historic and Forecasted Market Size by Application
8.5.5.1 Food & Beverages
8.5.5.2 Dietary Supplements
8.5.5.3 Functional Foods & Beverages
8.5.5.4 Cosmetics
8.5.5.5 Others
8.5.6 Historic and Forecasted Market Size by Distribution Channels
8.5.6.1 Online Retailing
8.5.6.2 Mass Retailers
8.5.6.3 Direct Selling
8.5.7 Historic and Forecast Market Size by Country
8.5.7.1 China
8.5.7.2 India
8.5.7.3 Japan
8.5.7.4 South Korea
8.5.7.5 Malaysia
8.5.7.6 Thailand
8.5.7.7 Vietnam
8.5.7.8 The Philippines
8.5.7.9 Australia
8.5.7.10 New Zealand
8.5.7.11 Rest of APAC
8.6. Middle East & Africa Tea PolyPhenols Market
8.6.1 Key Market Trends, Growth Factors and Opportunities
8.6.2 Top Key Companies
8.6.3 Historic and Forecasted Market Size by Segments
8.6.4 Historic and Forecasted Market Size by Type
8.6.4.1 Green Tea
8.6.4.2 Black Tea
8.6.4.3 Oolong Tea
8.6.4.4 Others
8.6.5 Historic and Forecasted Market Size by Application
8.6.5.1 Food & Beverages
8.6.5.2 Dietary Supplements
8.6.5.3 Functional Foods & Beverages
8.6.5.4 Cosmetics
8.6.5.5 Others
8.6.6 Historic and Forecasted Market Size by Distribution Channels
8.6.6.1 Online Retailing
8.6.6.2 Mass Retailers
8.6.6.3 Direct Selling
8.6.7 Historic and Forecast Market Size by Country
8.6.7.1 Turkiye
8.6.7.2 Bahrain
8.6.7.3 Kuwait
8.6.7.4 Saudi Arabia
8.6.7.5 Qatar
8.6.7.6 UAE
8.6.7.7 Israel
8.6.7.8 South Africa
8.7. South America Tea PolyPhenols Market
8.7.1 Key Market Trends, Growth Factors and Opportunities
8.7.2 Top Key Companies
8.7.3 Historic and Forecasted Market Size by Segments
8.7.4 Historic and Forecasted Market Size by Type
8.7.4.1 Green Tea
8.7.4.2 Black Tea
8.7.4.3 Oolong Tea
8.7.4.4 Others
8.7.5 Historic and Forecasted Market Size by Application
8.7.5.1 Food & Beverages
8.7.5.2 Dietary Supplements
8.7.5.3 Functional Foods & Beverages
8.7.5.4 Cosmetics
8.7.5.5 Others
8.7.6 Historic and Forecasted Market Size by Distribution Channels
8.7.6.1 Online Retailing
8.7.6.2 Mass Retailers
8.7.6.3 Direct Selling
8.7.7 Historic and Forecast Market Size by Country
8.7.7.1 Brazil
8.7.7.2 Argentina
8.7.7.3 Rest of SA
Chapter 9 Analyst Viewpoint and Conclusion
9.1 Recommendations and Concluding Analysis
9.2 Potential Market Strategies
Chapter 10 Research Methodology
10.1 Research Process
10.2 Primary Research
10.3 Secondary Research
|
Global Tea PolyPhenols Market |
|||
|
Base Year: |
2024 |
Forecast Period: |
2025-2032 |
|
Historical Data: |
2018 to 2023 |
Market Size in 2024: |
USD 239.82 Mn. |
|
Forecast Period 2024-32 CAGR: |
8.00% |
Market Size in 2032: |
USD 479.40 Mn. |
|
Segments Covered: |
By Type |
|
|
|
By Application |
|
||
|
By Distribution Channels |
|
||
|
By Region |
|
||
|
Key Market Drivers: |
|
||
|
Key Market Restraints: |
|
||
|
Key Opportunities: |
|
||
|
Companies Covered in the report: |
|
||


