


Social Media Security Market Synopsis
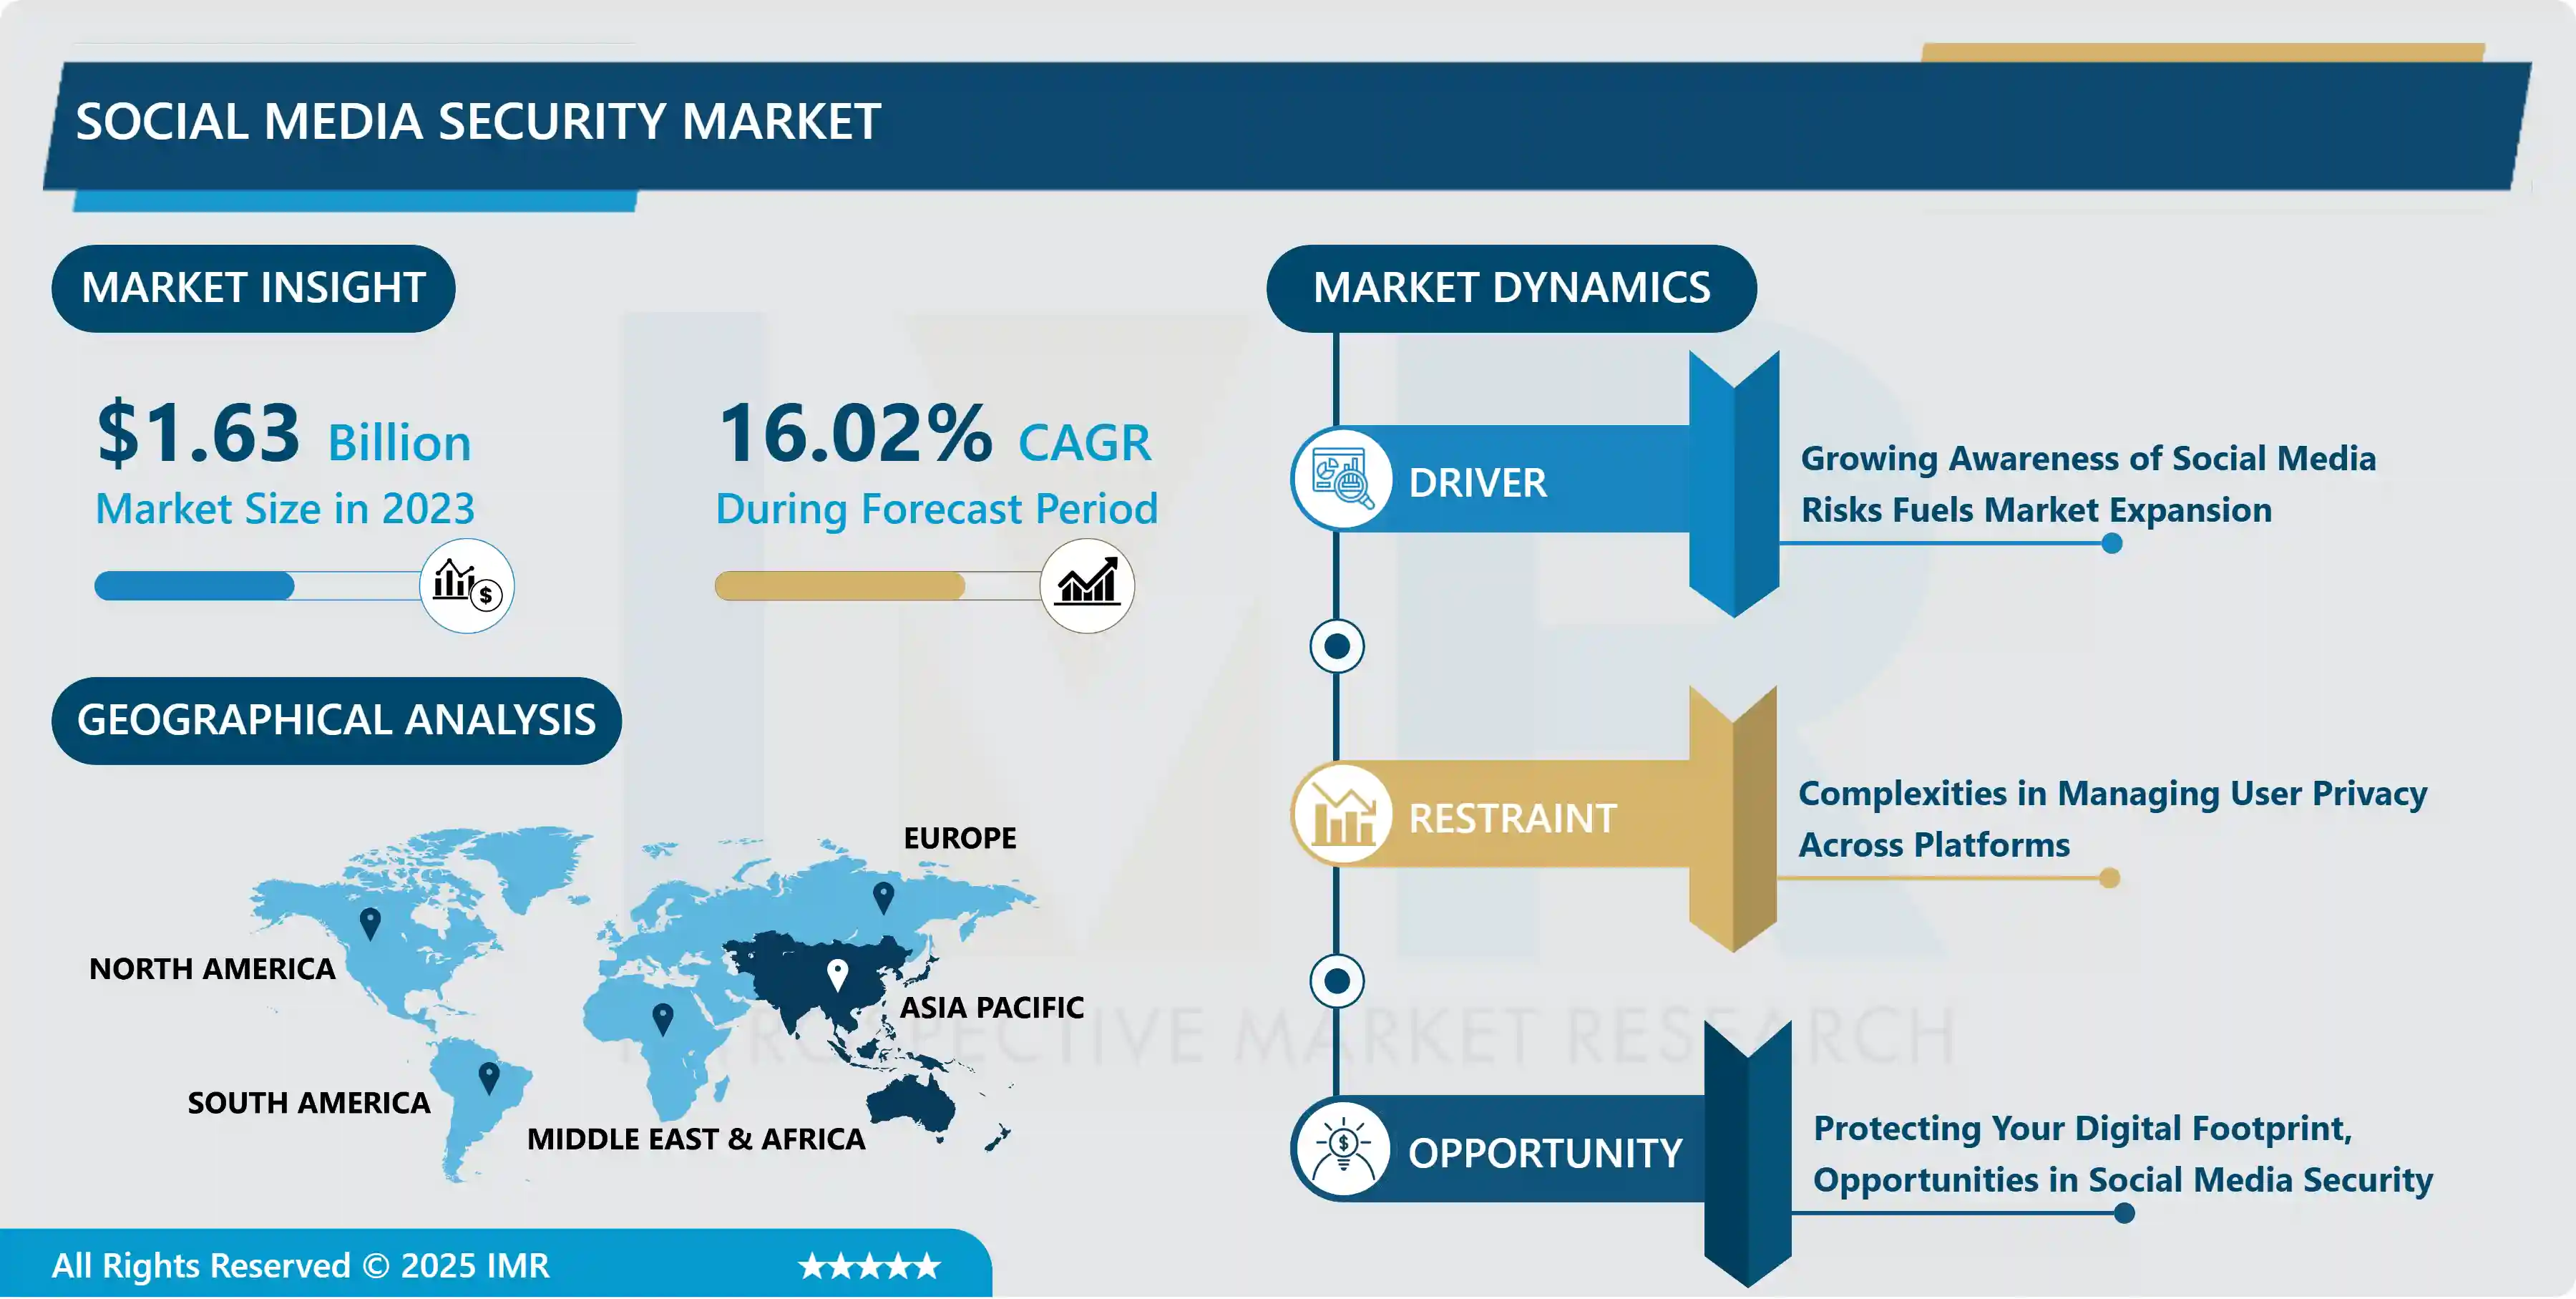
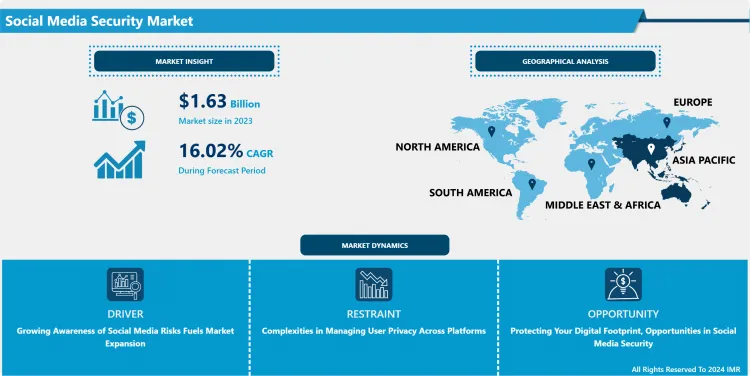
Social Media Security Market Size is Valued at USD 1.63 Billion in 2023 and is Projected to Reach USD 5.37 Billion by 2032, Growing at a CAGR of 16.02% From 2024-2032.
The Social Media Security Market consists of products and services that safeguard the user, institution, and brand from the hazards of social media use. These threats are data theft, identity theft, cyberbullying, brand imitation, and negative image perversion. It usually entails activities such as surveillance of social media activities, threat identification, access control, strict compliance with polices, and incident handling. The market is advancing with the heightening social network presence, regulatory compliance, and growing cognizance of cybercrimes in business communication.
The Driver Social Media Security Market is aimed only at the risks related to the communication tools which are present in the majority of vehicles and belongs to the transportation and logistics industries. To date, as the use of social media applications increases, risks such as distractions leading to traffic accidents, information stealing, and negative information sharing are also rising. Firms within this market provide solution in technologies and services that track as control the social media utilization of drivers for conformity with companies’ regulations and laws. Many of these solutions are in the form of real-time monitoring, content analysis and notification for escalating incidents of misconduct or incidents of risk such as distracted driving due to active social account activity.
Participants in the Driver Social Media Security Market use tactical applications with the help of AI to analyze social media risks and respond to them. These technologies enable the companies that own or operationalize fleets to manage safety presence on the road while at the same time protecting drivers’ privacy and the reputation of companies. In the course of driving, drivers nowadays cannot afford to avoid getting distracted by their smartphones or being avoidance of getting distracted by their smartphones or avoiding use of instant messengers, and given the continuing focus of regulators on endangering of people’s lives by distracted driving, these problems of cybersecurity for drivers are going to surge in importance, meaning that more and more investments will be Channeled into this specific area of cybersecurity.
Social Media Security Market Trend Analysis
Beyond Likes and Shares, Safeguarding Data in Social Media
- The social media security market is still emerging rapidly because more organizations start worrying about data privacy and security threats, and compliance. Due to growth in user base and versatility of platforms being targeted, social media sites are likely to attract more malicious actors intending to obtain individuals’ information, sowing chaos. This has led to design of specific security solutions that will effectively deal with security issues that may be in social media platforms.
- This specific market envelope encompasses the major categories such as superior threat identification/avoidance systems, high-level of encryption for the user data transfer and strong access control solutions. Organizations operating in this field are also adapting to the use of artificial intelligence for analysis to identify risky activities and prevent them in real-time. Also, the regulator pressure in the form of GDPR and CCPA, which require strict data protection, contributes to the implementation of the advanced security models by social media providers.
- In the future, the social media security market will expand even more because of increasing concern for security among companies and people. Trends have it that more organizations are adopting blockchain for improving data credibility and further internal transparency while social media interfaces are associating with cyber security firms to boost mechanisms against new threats. While rules and guidelines are being put into place and followed there is still the need to safeguard the security and reputation of media platforms more specifically, social media sites.
Fortifying Digital Footprints, The Role of Social Media Security Solutions
- Therefore, the market for social media security is significant and will expand due to the saturation of social networks in everyday life and various industries. With people and companies increasing their interactions through social networks and the importance of brands relying on social media for marketing, communication, and customer relations, the risks have skyrocketed. Some of the specific areas of development includes safeguarding users’ data from being stolen, managing carefully the procedures to grant user access and addressing issues related to cyber risks like pharming and malware. Such companies are likely to benefit from this trend by providing new solutions that effectively address global cyber threats while at the same time ensuring that social media can be used safely and to full potential as per the laws.
- Furthermore, with increasing legal actions across the world, especially regarding the privacy of individuals’ data, concerns for regulations like GDPR and CCPA are rising, which in turn, is fueling the need for effective social media security solutions. Such a regulatory environment promotes adoption of technologies that increase security and compliance with strict data privacy standards. Thus, the security market in relation to social networks is still extensive and open for effective and active business development to meet growing new threats and respond quickly and effectively to current tendencies in the sphere.
Social Media Security Market Segment Analysis:
Social Media Security Market Segmented on the basis of type, application, and end-users.
By Solution, Monitoring segment is expected to dominate the market during the forecast period
- In the field of social media security, different activities such as monitoring, threat intelligence, and risk management are critical to protect the platforms from threats. This entails constant observation of the user behavior and content to identify the malicious activities or for unauthorized access while acting in real time. On the other hand, threat intelligence is a sophisticated concept that involves the organized use of analysis and automation, such as the use of machine learning tools to determine existing and future threats and the appropriate measures to take in advance.
- At the same time, risk management provides for the identification of threats, the provision of protective measures and actions that will be necessary to address such threats in the future, thus providing an overall protection of such aspects as data privacy and user interactions in most popular social media platforms. Hence, the integration of these solutions is crucial for organizations that would wish to sustain trust, continue to adhere to regulations’ requirements, and withstand new complex cyber threats in the ever-changing digital environment.
By Security, Web Security segment held the largest share in 2024
- In the field of social media security, each element contributes to enhancing the security of online services against various threats. Web security - it is all about protecting websites and the web interfaces that are invariant in the course of creating web applications against any sort of unlawful activities and attempts. Application security deals with protection of software applications against different risks that might result from different malicious attacks, which include data theft or system compromise.
- Endpoint security refers to the security of entities like smartphones, laptops, and desktops while engaging in the use of social media platforms. Network security is the protection of data that is communicated between devices and servers within a network from network borne threats and break-ins. Cloud security mainly covers protection of information from compliance breaches while in cloud environments, its confidentiality, and availability of social media-related information. In this way, all of the above-mentioned security domains make a comprehensive approach for protecting user data, maintaining platform integrity, and, consequently, building trust within the framework of social media.
Social Media Security Market Regional Insights:
Asia Pacific is Expected to Dominate the Market Over the Forecast period
- The Asia-Pacific region is expected to grow substantially in the Social Media Security Market due to the growing digitalization and intensity of internetwork across the emerging economies. As for the examples, people in China, India, and many countries of Southeast Asia actively use social networks, and thus the need to strengthen security increasingly becomes critical. The governments and the enterprises are spending huge amount in the advanced security measures to protect from the data breaches, phishing attacks and other spams on the social media websites.
- Also, the market of the region is heterogeneous qualitatively due to the difference of regulations that affect the choice of compliance-centered security solutions. It has been identified that market players are coming up with differential strategies to address geography specific micro markets and develop a legal solution that meets the specific markets’ demands; this has helped cultivate competitiveness in the social media security market. Considering that protective data and security aspects remain priorities for many organizations, the Asia-Pacific Social Media Security Market is fated for further development due to increasing digital threats and the need for an adequate comprehensive Security strategy compatible with the features of the Asia-Pacific region.
Active Key Players in the Social Media Security Market
- Symantec (United States)
- CA Technologies (United States)
- ZeroFOX (United States)
- RiskIQ (United States)
- SolarWinds (United States)
- Proofpoint (United States)
- LookingGlass Cyber Solutions (United States)
- KnowBe4 (United States)
- Centrify (United States)
- Social Hub (United States)
- Brandle (United States)
- DigitalStakeout (United States)
- Bowline Security (United States)
- Social Sentinel (United States)
- SecureMySocial (United States)
- Hueya (United States)
- CSC (United States)
- CoNetrix (United States)
- Sophos (United Kingdom)
- Micro Focus (United Kingdom)
- Digital Shadows (United Kingdom)
- Crisp Thinking (United Kingdom)
- CrowdControlHQ (United Kingdom)
- Trend Micro (Japan) and Others Major Players
|
Global Social Media Security Market |
|||
|
Base Year: |
2023 |
Forecast Period: |
2024-2032 |
|
Historical Data: |
2017 to 2023 |
Market Size in 2023: |
USD 1.63 Bn. |
|
Forecast Period 2024-32 CAGR: |
16.02 % |
Market Size in 2032: |
USD 5.37 Bn. |
|
Segments Covered: |
By Solution |
|
|
|
By Security |
|
||
|
By End User |
|
||
|
By Region |
|
||
|
Key Market Drivers: |
|
||
|
Key Market Restraints: |
|
||
|
Key Opportunities: |
|
||
|
Companies Covered in the report: |
|
||
Chapter 1: Introduction
1.1 Scope and Coverage
Chapter 2:Executive Summary
Chapter 3: Market Landscape
3.1 Market Dynamics
3.1.1 Drivers
3.1.2 Restraints
3.1.3 Opportunities
3.1.4 Challenges
3.2 Market Trend Analysis
3.3 PESTLE Analysis
3.4 Porter's Five Forces Analysis
3.5 Industry Value Chain Analysis
3.6 Ecosystem
3.7 Regulatory Landscape
3.8 Price Trend Analysis
3.9 Patent Analysis
3.10 Technology Evolution
3.11 Investment Pockets
3.12 Import-Export Analysis
Chapter 4: Social Media Security Market by Solution (2018-2032)
4.1 Social Media Security Market Snapshot and Growth Engine
4.2 Market Overview
4.3 Monitoring
4.3.1 Introduction and Market Overview
4.3.2 Historic and Forecasted Market Size in Value USD and Volume Units
4.3.3 Key Market Trends, Growth Factors, and Opportunities
4.3.4 Geographic Segmentation Analysis
4.4 Threat Intelligence
4.5 Risk Management
Chapter 5: Social Media Security Market by Security (2018-2032)
5.1 Social Media Security Market Snapshot and Growth Engine
5.2 Market Overview
5.3 Web Security
5.3.1 Introduction and Market Overview
5.3.2 Historic and Forecasted Market Size in Value USD and Volume Units
5.3.3 Key Market Trends, Growth Factors, and Opportunities
5.3.4 Geographic Segmentation Analysis
5.4 Application Security
5.5 Endpoint Security
5.6 Network Security
5.7 Cloud Security
Chapter 6: Social Media Security Market by End User (2018-2032)
6.1 Social Media Security Market Snapshot and Growth Engine
6.2 Market Overview
6.3 BFSI
6.3.1 Introduction and Market Overview
6.3.2 Historic and Forecasted Market Size in Value USD and Volume Units
6.3.3 Key Market Trends, Growth Factors, and Opportunities
6.3.4 Geographic Segmentation Analysis
6.4 Healthcare and life sciences
6.5 Manufacturing
6.6 Telecom & IT
6.7 Media and entertainment
6.8 Others
Chapter 7: Company Profiles and Competitive Analysis
7.1 Competitive Landscape
7.1.1 Competitive Benchmarking
7.1.2 Social Media Security Market Share by Manufacturer (2024)
7.1.3 Industry BCG Matrix
7.1.4 Heat Map Analysis
7.1.5 Mergers and Acquisitions
7.2 AIR CHARTER SERVICE (UNITED KINGDOM)
7.2.1 Company Overview
7.2.2 Key Executives
7.2.3 Company Snapshot
7.2.4 Role of the Company in the Market
7.2.5 Sustainability and Social Responsibility
7.2.6 Operating Business Segments
7.2.7 Product Portfolio
7.2.8 Business Performance
7.2.9 Key Strategic Moves and Recent Developments
7.2.10 SWOT Analysis
7.3 ZODIAC AERO (FRANCE)
7.4 SURVITEC GROUP (UNITED KINGDOM)
7.5 JAMCO CORPORATION (JAPAN)
7.6 SCANDLEARN (DENMARK)
7.7 AIRMED INTERNATIONAL (UNITED STATES)
7.8 OTHERS
7.9
Chapter 8: Global Social Media Security Market By Region
8.1 Overview
8.2. North America Social Media Security Market
8.2.1 Key Market Trends, Growth Factors and Opportunities
8.2.2 Top Key Companies
8.2.3 Historic and Forecasted Market Size by Segments
8.2.4 Historic and Forecasted Market Size by Solution
8.2.4.1 Monitoring
8.2.4.2 Threat Intelligence
8.2.4.3 Risk Management
8.2.5 Historic and Forecasted Market Size by Security
8.2.5.1 Web Security
8.2.5.2 Application Security
8.2.5.3 Endpoint Security
8.2.5.4 Network Security
8.2.5.5 Cloud Security
8.2.6 Historic and Forecasted Market Size by End User
8.2.6.1 BFSI
8.2.6.2 Healthcare and life sciences
8.2.6.3 Manufacturing
8.2.6.4 Telecom & IT
8.2.6.5 Media and entertainment
8.2.6.6 Others
8.2.7 Historic and Forecast Market Size by Country
8.2.7.1 US
8.2.7.2 Canada
8.2.7.3 Mexico
8.3. Eastern Europe Social Media Security Market
8.3.1 Key Market Trends, Growth Factors and Opportunities
8.3.2 Top Key Companies
8.3.3 Historic and Forecasted Market Size by Segments
8.3.4 Historic and Forecasted Market Size by Solution
8.3.4.1 Monitoring
8.3.4.2 Threat Intelligence
8.3.4.3 Risk Management
8.3.5 Historic and Forecasted Market Size by Security
8.3.5.1 Web Security
8.3.5.2 Application Security
8.3.5.3 Endpoint Security
8.3.5.4 Network Security
8.3.5.5 Cloud Security
8.3.6 Historic and Forecasted Market Size by End User
8.3.6.1 BFSI
8.3.6.2 Healthcare and life sciences
8.3.6.3 Manufacturing
8.3.6.4 Telecom & IT
8.3.6.5 Media and entertainment
8.3.6.6 Others
8.3.7 Historic and Forecast Market Size by Country
8.3.7.1 Russia
8.3.7.2 Bulgaria
8.3.7.3 The Czech Republic
8.3.7.4 Hungary
8.3.7.5 Poland
8.3.7.6 Romania
8.3.7.7 Rest of Eastern Europe
8.4. Western Europe Social Media Security Market
8.4.1 Key Market Trends, Growth Factors and Opportunities
8.4.2 Top Key Companies
8.4.3 Historic and Forecasted Market Size by Segments
8.4.4 Historic and Forecasted Market Size by Solution
8.4.4.1 Monitoring
8.4.4.2 Threat Intelligence
8.4.4.3 Risk Management
8.4.5 Historic and Forecasted Market Size by Security
8.4.5.1 Web Security
8.4.5.2 Application Security
8.4.5.3 Endpoint Security
8.4.5.4 Network Security
8.4.5.5 Cloud Security
8.4.6 Historic and Forecasted Market Size by End User
8.4.6.1 BFSI
8.4.6.2 Healthcare and life sciences
8.4.6.3 Manufacturing
8.4.6.4 Telecom & IT
8.4.6.5 Media and entertainment
8.4.6.6 Others
8.4.7 Historic and Forecast Market Size by Country
8.4.7.1 Germany
8.4.7.2 UK
8.4.7.3 France
8.4.7.4 The Netherlands
8.4.7.5 Italy
8.4.7.6 Spain
8.4.7.7 Rest of Western Europe
8.5. Asia Pacific Social Media Security Market
8.5.1 Key Market Trends, Growth Factors and Opportunities
8.5.2 Top Key Companies
8.5.3 Historic and Forecasted Market Size by Segments
8.5.4 Historic and Forecasted Market Size by Solution
8.5.4.1 Monitoring
8.5.4.2 Threat Intelligence
8.5.4.3 Risk Management
8.5.5 Historic and Forecasted Market Size by Security
8.5.5.1 Web Security
8.5.5.2 Application Security
8.5.5.3 Endpoint Security
8.5.5.4 Network Security
8.5.5.5 Cloud Security
8.5.6 Historic and Forecasted Market Size by End User
8.5.6.1 BFSI
8.5.6.2 Healthcare and life sciences
8.5.6.3 Manufacturing
8.5.6.4 Telecom & IT
8.5.6.5 Media and entertainment
8.5.6.6 Others
8.5.7 Historic and Forecast Market Size by Country
8.5.7.1 China
8.5.7.2 India
8.5.7.3 Japan
8.5.7.4 South Korea
8.5.7.5 Malaysia
8.5.7.6 Thailand
8.5.7.7 Vietnam
8.5.7.8 The Philippines
8.5.7.9 Australia
8.5.7.10 New Zealand
8.5.7.11 Rest of APAC
8.6. Middle East & Africa Social Media Security Market
8.6.1 Key Market Trends, Growth Factors and Opportunities
8.6.2 Top Key Companies
8.6.3 Historic and Forecasted Market Size by Segments
8.6.4 Historic and Forecasted Market Size by Solution
8.6.4.1 Monitoring
8.6.4.2 Threat Intelligence
8.6.4.3 Risk Management
8.6.5 Historic and Forecasted Market Size by Security
8.6.5.1 Web Security
8.6.5.2 Application Security
8.6.5.3 Endpoint Security
8.6.5.4 Network Security
8.6.5.5 Cloud Security
8.6.6 Historic and Forecasted Market Size by End User
8.6.6.1 BFSI
8.6.6.2 Healthcare and life sciences
8.6.6.3 Manufacturing
8.6.6.4 Telecom & IT
8.6.6.5 Media and entertainment
8.6.6.6 Others
8.6.7 Historic and Forecast Market Size by Country
8.6.7.1 Turkiye
8.6.7.2 Bahrain
8.6.7.3 Kuwait
8.6.7.4 Saudi Arabia
8.6.7.5 Qatar
8.6.7.6 UAE
8.6.7.7 Israel
8.6.7.8 South Africa
8.7. South America Social Media Security Market
8.7.1 Key Market Trends, Growth Factors and Opportunities
8.7.2 Top Key Companies
8.7.3 Historic and Forecasted Market Size by Segments
8.7.4 Historic and Forecasted Market Size by Solution
8.7.4.1 Monitoring
8.7.4.2 Threat Intelligence
8.7.4.3 Risk Management
8.7.5 Historic and Forecasted Market Size by Security
8.7.5.1 Web Security
8.7.5.2 Application Security
8.7.5.3 Endpoint Security
8.7.5.4 Network Security
8.7.5.5 Cloud Security
8.7.6 Historic and Forecasted Market Size by End User
8.7.6.1 BFSI
8.7.6.2 Healthcare and life sciences
8.7.6.3 Manufacturing
8.7.6.4 Telecom & IT
8.7.6.5 Media and entertainment
8.7.6.6 Others
8.7.7 Historic and Forecast Market Size by Country
8.7.7.1 Brazil
8.7.7.2 Argentina
8.7.7.3 Rest of SA
Chapter 9 Analyst Viewpoint and Conclusion
9.1 Recommendations and Concluding Analysis
9.2 Potential Market Strategies
Chapter 10 Research Methodology
10.1 Research Process
10.2 Primary Research
10.3 Secondary Research
|
Global Social Media Security Market |
|||
|
Base Year: |
2023 |
Forecast Period: |
2024-2032 |
|
Historical Data: |
2017 to 2023 |
Market Size in 2023: |
USD 1.63 Bn. |
|
Forecast Period 2024-32 CAGR: |
16.02 % |
Market Size in 2032: |
USD 5.37 Bn. |
|
Segments Covered: |
By Solution |
|
|
|
By Security |
|
||
|
By End User |
|
||
|
By Region |
|
||
|
Key Market Drivers: |
|
||
|
Key Market Restraints: |
|
||
|
Key Opportunities: |
|
||
|
Companies Covered in the report: |
|
||


