

Smart Labels Market Overview
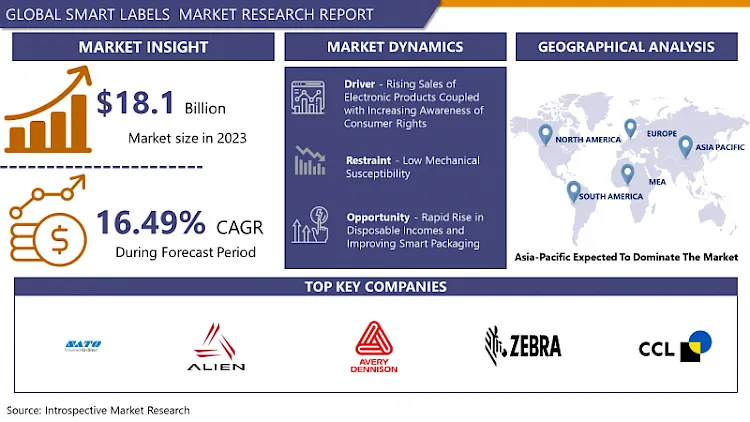
Smart Labels Market Size Was Valued at USD 18.1 Billion in 2023 and is Projected to Reach USD 71.5 Billion by 2032, Growing at a CAGR of 16.49 % From 2024-2032.
Smart labels are innovative tags equipped with technologies like RFID (Radio Frequency Identification) or NFC (Near Field Communication) to provide real-time data about products. They enhance supply chain management, enabling tracking, authentication, and inventory control. Smart labels can store information about a product's origin, expiration date, and usage instructions. They facilitate inventory management, reduce counterfeit products, and enhance consumer experiences through interactive features like product information or promotions accessed via smartphones.
The smart Labels Market is the growing need for product traceability and verification across industries like retail, healthcare, food & beverage, and logistics. RFID and NFC-enabled smart labels allow businesses to monitor their supply chains efficiently, reducing instances of imitating and enhancing inventory management practices. In the retail sector, smart labels facilitate seamless checkout processes and enable retailers to gather valuable insights into consumer behavior. Moreover, the increasing adoption of IoT (Internet of Things) technology is fueling the demand for smart labels as they serve as a crucial interface between physical products and digital platforms. This integration enables innovative applications such as smart packaging, where labels provide real-time information about product freshness and usage instructions.
- The Smart Labels Market is also witnessing significant growth due to regulatory mandates aimed at ensuring product safety and authenticity. Governments worldwide are imposing stringent regulations, especially in industries like pharmaceuticals and food, driving the adoption of smart labeling solutions. Furthermore, advancements in printing technologies, such as digital printing and flexible electronics, are making smart labels more affordable and customizable, further boosting market growth. Overall, the Smart Labels Market is poised for substantial expansion driven by technological innovations, regulatory requirements, and the growing need for enhanced supply chain visibility and consumer engagement.
Market Segmentation
Segmentation Analysis of Smart Labels Market:
- By Technology Type, the RFID segment is accounted for the largest segment with Smart Labels market share of 54.32% and estimated to have a market size of USD 15.39 billion in the year 2026. Due to key benefits associated with the RFID segment like Automatic data capture, information accuracy, and real-time tracking, the segment RFID is growing the Smart Labels market.
- By Applications Type, the Perishable Goods segment is accounted for the largest segment with Smart Labels market share of 45.32% and estimated to have a market size of USD 12.48 billion in the year 2026 with a CAGR of 16.05%. Apart from perishable goods, retail inventory is the fastest and largest growing segment that is witnessing and leading the growth of Smart Labels market.
Regional Insights:
The Smart Labels market is growing rapidly in the Asia-Pacific region. Asia-Pacific region is accounted for the largest Smart Labels market share of 37.2% across the globe with a CAGR of 16.52% and a market size of USD 3.71 billion in the year 2019. But in the forecast period, due to the high demand from the regions like China, Japan, Australia, and India, Asia-Pacific is expected to continue the growth with estimated market size of USD 10.71 billion in the year 2026.
Major Key Players Considered in the Market
- Avery Dennison Corporation
- CCL Industries.
- Checkpoint Systems.
- Smartrac N.V.
- Zebra Technologies Corporation
- Alien Technology.
- Sato Holding Corporation
- Intermec Inc.
- Thin Film Electronics ASA
- Checkpoint Systems, Inc. and other major players.
Salient Features of the Smart Labels Market
Global Smart Labels market was valued at USD 13.36 billion in 2021 and is expected to reach USD 38.66 billion by the year 2028, at a CAGR of 16.39% between 2022 to 2028.
- Microprocessor from the component segment is expected to show the fastest growth for Smart Labels forecast period due to the heavy demand from the automotive and the electronics industry. Increasing usage from inventory management and asset tracking is driving the Smart Labels market rapidly.
- The retail segment from the end-user industry is expected to be the largest segment in the forecast period with a Smart Labels market share of 35.36% and an estimated market size of USD 10.06 billion in the year 2026.
- Logistics and Fast-moving consumer goods (FMCG) are also one of the fastest-growing while healthcare and pharmaceutical are also expected to have a boost in Smart Labels forecast period with a CAGR of 16.5%.
Key Industry Developments in the Smart Labels Market:
- In July 2023, CCL Industries strengthened its European presence with the acquisition of Germany's Faubel & Co. Nachf. GmbH, a pharmaceutical label business. This strategic move enhances CCL Industries' organizational and operational capabilities, propelling its global expansion efforts. The acquisition underscores CCL Industries' commitment to fortifying its foothold in the European market and signifies a significant step forward in its pursuit of global prominence.
- In January 2023, Avery Dennison unveiled its acquisition agreement with Thermopatch, a leading provider of labeling and embellishments for various industries. The deal positions Thermopatch under Avery Dennison's RBIS Apparel Solutions division. This strategic move aims to capitalize on collective expertise, enhancing external embellishments. Thermopatch, based in Syracuse, New York, reported 2022 revenues of around $40 million, boasting approximately 200 employees across North America and Europe.
|
Global Smart Labels Market |
|||
|
Base Year: |
2023 |
Forecast Period: |
2024-2032 |
|
Historical Data : |
2016 to 2020 |
Market Size in 2023 : |
USD 18.01 Bn. |
|
Forecast Period 2022-28 CAGR: |
16.49 % |
Market Size in 2032 : |
USD 71.05 Bn. |
|
Segments Covered: |
By Technology Type |
|
|
|
By Application |
|
||
|
By Region |
|
||
|
Key Market Drivers: |
|
||
|
Key Market Restraints: |
|
||
|
Key Opportunities: |
|
||
|
Companies Covered in the report: |
|
||
Chapter 1: Introduction
1.1 Research Objectives
1.2 Research Methodology
1.3 Research Process
1.4 Scope and Coverage
1.4.1 Market Definition
1.4.2 Key Questions Answered
1.5 Market Segmentation
Chapter 2:Executive Summary
Chapter 3:Growth Opportunities By Segment
3.1 By Type
3.2 By Application
Chapter 4: Market Landscape
4.1 Porter's Five Forces Analysis
4.1.1 Bargaining Power of Supplier
4.1.2 Threat of New Entrants
4.1.3 Threat of Substitutes
4.1.4 Competitive Rivalry
4.1.5 Bargaining Power Among Buyers
4.2 Industry Value Chain Analysis
4.3 Market Dynamics
4.3.1 Drivers
4.3.2 Restraints
4.3.3 Opportunities
4.5.4 Challenges
4.4 Pestle Analysis
4.5 Technological Roadmap
4.6 Regulatory Landscape
4.7 SWOT Analysis
4.8 Price Trend Analysis
4.9 Patent Analysis
4.10 Analysis of the Impact of Covid-19
4.10.1 Impact on the Overall Market
4.10.2 Impact on the Supply Chain
4.10.3 Impact on the Key Manufacturers
4.10.4 Impact on the Pricing
Chapter 5: Smart Labels Market by Type
5.1 Smart Labels Market Overview Snapshot and Growth Engine
5.2 Smart Labels Market Overview
5.3 EAS
5.3.1 Introduction and Market Overview
5.3.2 Historic and Forecasted Market Size (2016-2028F)
5.3.3 Key Market Trends, Growth Factors and Opportunities
5.3.4 EAS: Grographic Segmentation
5.4 RFID
5.4.1 Introduction and Market Overview
5.4.2 Historic and Forecasted Market Size (2016-2028F)
5.4.3 Key Market Trends, Growth Factors and Opportunities
5.4.4 RFID: Grographic Segmentation
5.5 Sensing
5.5.1 Introduction and Market Overview
5.5.2 Historic and Forecasted Market Size (2016-2028F)
5.5.3 Key Market Trends, Growth Factors and Opportunities
5.5.4 Sensing: Grographic Segmentation
5.6 ESL
5.6.1 Introduction and Market Overview
5.6.2 Historic and Forecasted Market Size (2016-2028F)
5.6.3 Key Market Trends, Growth Factors and Opportunities
5.6.4 ESL: Grographic Segmentation
5.7 Near Field Communication (NFC) tags
5.7.1 Introduction and Market Overview
5.7.2 Historic and Forecasted Market Size (2016-2028F)
5.7.3 Key Market Trends, Growth Factors and Opportunities
5.7.4 Near Field Communication (NFC) tags: Grographic Segmentation
Chapter 6: Smart Labels Market by Application
6.1 Smart Labels Market Overview Snapshot and Growth Engine
6.2 Smart Labels Market Overview
6.3 Retail Inventory
6.3.1 Introduction and Market Overview
6.3.2 Historic and Forecasted Market Size (2016-2028F)
6.3.3 Key Market Trends, Growth Factors and Opportunities
6.3.4 Retail Inventory: Grographic Segmentation
6.4 Perishable Goods
6.4.1 Introduction and Market Overview
6.4.2 Historic and Forecasted Market Size (2016-2028F)
6.4.3 Key Market Trends, Growth Factors and Opportunities
6.4.4 Perishable Goods: Grographic Segmentation
6.5 Electronics & IT Assets
6.5.1 Introduction and Market Overview
6.5.2 Historic and Forecasted Market Size (2016-2028F)
6.5.3 Key Market Trends, Growth Factors and Opportunities
6.5.4 Electronics & IT Assets: Grographic Segmentation
6.6 Others
6.6.1 Introduction and Market Overview
6.6.2 Historic and Forecasted Market Size (2016-2028F)
6.6.3 Key Market Trends, Growth Factors and Opportunities
6.6.4 Others: Grographic Segmentation
Chapter 7: Company Profiles and Competitive Analysis
7.1 Competitive Landscape
7.1.1 Competitive Positioning
7.1.2 Smart Labels Sales and Market Share By Players
7.1.3 Industry BCG Matrix
7.1.4 Ansoff Matrix
7.1.5 Smart Labels Industry Concentration Ratio (CR5 and HHI)
7.1.6 Top 5 Smart Labels Players Market Share
7.1.7 Mergers and Acquisitions
7.1.8 Business Strategies By Top Players
7.2 AVERY DENNISON CORPORATION
7.2.1 Company Overview
7.2.2 Key Executives
7.2.3 Company Snapshot
7.2.4 Operating Business Segments
7.2.5 Product Portfolio
7.2.6 Business Performance
7.2.7 Key Strategic Moves and Recent Developments
7.2.8 SWOT Analysis
7.3 CCL INDUSTRIES.
7.4 CHECKPOINT SYSTEMS.
7.5 SMARTRAC N.V.
7.6 ZEBRA TECHNOLOGIES CORPORATION
7.7 ALIEN TECHNOLOGY.
7.8 SATO HOLDING CORPORATION
7.9 INTERMEC INC.
7.10 AVERY DENISON CORPORATION
7.11 THIN FILM ELECTRONICS ASA
7.12 CHECKPOINT SYSTEMS INC
7.13 OTHER MAJOR PLAYERS
Chapter 8: Global Smart Labels Market Analysis, Insights and Forecast, 2016-2028
8.1 Market Overview
8.2 Historic and Forecasted Market Size By Type
8.2.1 EAS
8.2.2 RFID
8.2.3 Sensing
8.2.4 ESL
8.2.5 Near Field Communication (NFC) tags
8.3 Historic and Forecasted Market Size By Application
8.3.1 Retail Inventory
8.3.2 Perishable Goods
8.3.3 Electronics & IT Assets
8.3.4 Others
Chapter 9: North America Smart Labels Market Analysis, Insights and Forecast, 2016-2028
9.1 Key Market Trends, Growth Factors and Opportunities
9.2 Impact of Covid-19
9.3 Key Players
9.4 Key Market Trends, Growth Factors and Opportunities
9.4 Historic and Forecasted Market Size By Type
9.4.1 EAS
9.4.2 RFID
9.4.3 Sensing
9.4.4 ESL
9.4.5 Near Field Communication (NFC) tags
9.5 Historic and Forecasted Market Size By Application
9.5.1 Retail Inventory
9.5.2 Perishable Goods
9.5.3 Electronics & IT Assets
9.5.4 Others
9.6 Historic and Forecast Market Size by Country
9.6.1 U.S.
9.6.2 Canada
9.6.3 Mexico
Chapter 10: Europe Smart Labels Market Analysis, Insights and Forecast, 2016-2028
10.1 Key Market Trends, Growth Factors and Opportunities
10.2 Impact of Covid-19
10.3 Key Players
10.4 Key Market Trends, Growth Factors and Opportunities
10.4 Historic and Forecasted Market Size By Type
10.4.1 EAS
10.4.2 RFID
10.4.3 Sensing
10.4.4 ESL
10.4.5 Near Field Communication (NFC) tags
10.5 Historic and Forecasted Market Size By Application
10.5.1 Retail Inventory
10.5.2 Perishable Goods
10.5.3 Electronics & IT Assets
10.5.4 Others
10.6 Historic and Forecast Market Size by Country
10.6.1 Germany
10.6.2 U.K.
10.6.3 France
10.6.4 Italy
10.6.5 Russia
10.6.6 Spain
10.6.7 Rest of Europe
Chapter 11: Asia-Pacific Smart Labels Market Analysis, Insights and Forecast, 2016-2028
11.1 Key Market Trends, Growth Factors and Opportunities
11.2 Impact of Covid-19
11.3 Key Players
11.4 Key Market Trends, Growth Factors and Opportunities
11.4 Historic and Forecasted Market Size By Type
11.4.1 EAS
11.4.2 RFID
11.4.3 Sensing
11.4.4 ESL
11.4.5 Near Field Communication (NFC) tags
11.5 Historic and Forecasted Market Size By Application
11.5.1 Retail Inventory
11.5.2 Perishable Goods
11.5.3 Electronics & IT Assets
11.5.4 Others
11.6 Historic and Forecast Market Size by Country
11.6.1 China
11.6.2 India
11.6.3 Japan
11.6.4 Singapore
11.6.5 Australia
11.6.6 New Zealand
11.6.7 Rest of APAC
Chapter 12: Middle East & Africa Smart Labels Market Analysis, Insights and Forecast, 2016-2028
12.1 Key Market Trends, Growth Factors and Opportunities
12.2 Impact of Covid-19
12.3 Key Players
12.4 Key Market Trends, Growth Factors and Opportunities
12.4 Historic and Forecasted Market Size By Type
12.4.1 EAS
12.4.2 RFID
12.4.3 Sensing
12.4.4 ESL
12.4.5 Near Field Communication (NFC) tags
12.5 Historic and Forecasted Market Size By Application
12.5.1 Retail Inventory
12.5.2 Perishable Goods
12.5.3 Electronics & IT Assets
12.5.4 Others
12.6 Historic and Forecast Market Size by Country
12.6.1 Turkey
12.6.2 Saudi Arabia
12.6.3 Iran
12.6.4 UAE
12.6.5 Africa
12.6.6 Rest of MEA
Chapter 13: South America Smart Labels Market Analysis, Insights and Forecast, 2016-2028
13.1 Key Market Trends, Growth Factors and Opportunities
13.2 Impact of Covid-19
13.3 Key Players
13.4 Key Market Trends, Growth Factors and Opportunities
13.4 Historic and Forecasted Market Size By Type
13.4.1 EAS
13.4.2 RFID
13.4.3 Sensing
13.4.4 ESL
13.4.5 Near Field Communication (NFC) tags
13.5 Historic and Forecasted Market Size By Application
13.5.1 Retail Inventory
13.5.2 Perishable Goods
13.5.3 Electronics & IT Assets
13.5.4 Others
13.6 Historic and Forecast Market Size by Country
13.6.1 Brazil
13.6.2 Argentina
13.6.3 Rest of SA
Chapter 14 Investment Analysis
Chapter 15 Analyst Viewpoint and Conclusion
|
Global Smart Labels Market |
|||
|
Base Year: |
2023 |
Forecast Period: |
2024-2032 |
|
Historical Data : |
2016 to 2020 |
Market Size in 2023 : |
USD 18.01 Bn. |
|
Forecast Period 2022-28 CAGR: |
16.49 % |
Market Size in 2032 : |
USD 71.05 Bn. |
|
Segments Covered: |
By Technology Type |
|
|
|
By Application |
|
||
|
By Region |
|
||
|
Key Market Drivers: |
|
||
|
Key Market Restraints: |
|
||
|
Key Opportunities: |
|
||
|
Companies Covered in the report: |
|
||
Frequently Asked Questions :
The forecast period in the Smart Labels Market research report is 2024-2032.
Avery Dennison Corporation (US), CCL Industries (Canada), Checkpoint Systems (US), Smartrac N.V (Netherlands), Zebra Technologies Corporation (US), and other major players.
The Smart Labels Market is segmented into Technology Type, Application, and region. By Technology Type, the market is categorized into EAS, RFID, Sensing, ESL, and Near Field Communication (NFC) tags. By Application, the market is categorized into Retail Inventory, Perishable Goods, Electronics & IT Assets, and Others. By region, it is analyzed across North America (U.S.; Canada; Mexico), Europe (Germany; U.K.; France; Italy; Russia; Spain, etc.), Asia-Pacific (China; India; Japan; Southeast Asia, etc.), South America (Brazil; Argentina, etc.), Middle East & Africa (Saudi Arabia; South Africa, etc.).
Smart Labels acts as electronic responsive device that is embedded in the body of the product as an identification slip. They are made up of chips, antennae, and bonding wires which help in real-time access and tracking of the devices.
Smart Labels Market Size Was Valued at USD 18.1 Billion in 2023 and is Projected to Reach USD 71.5 Billion by 2032, Growing at a CAGR of 16.49 % From 2024-2032.