


Shrimp Market Synopsis
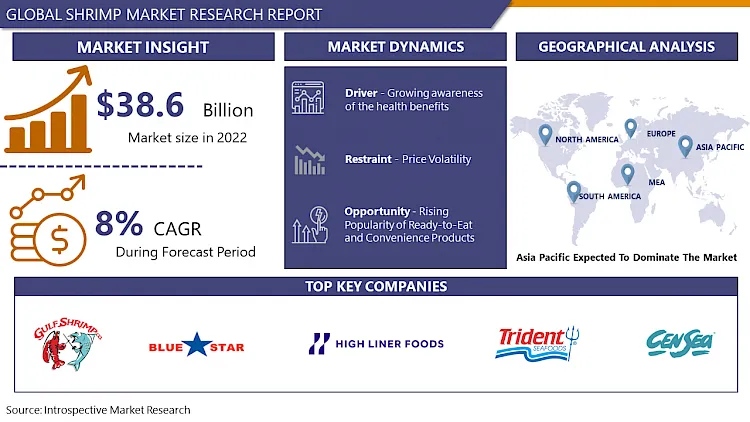
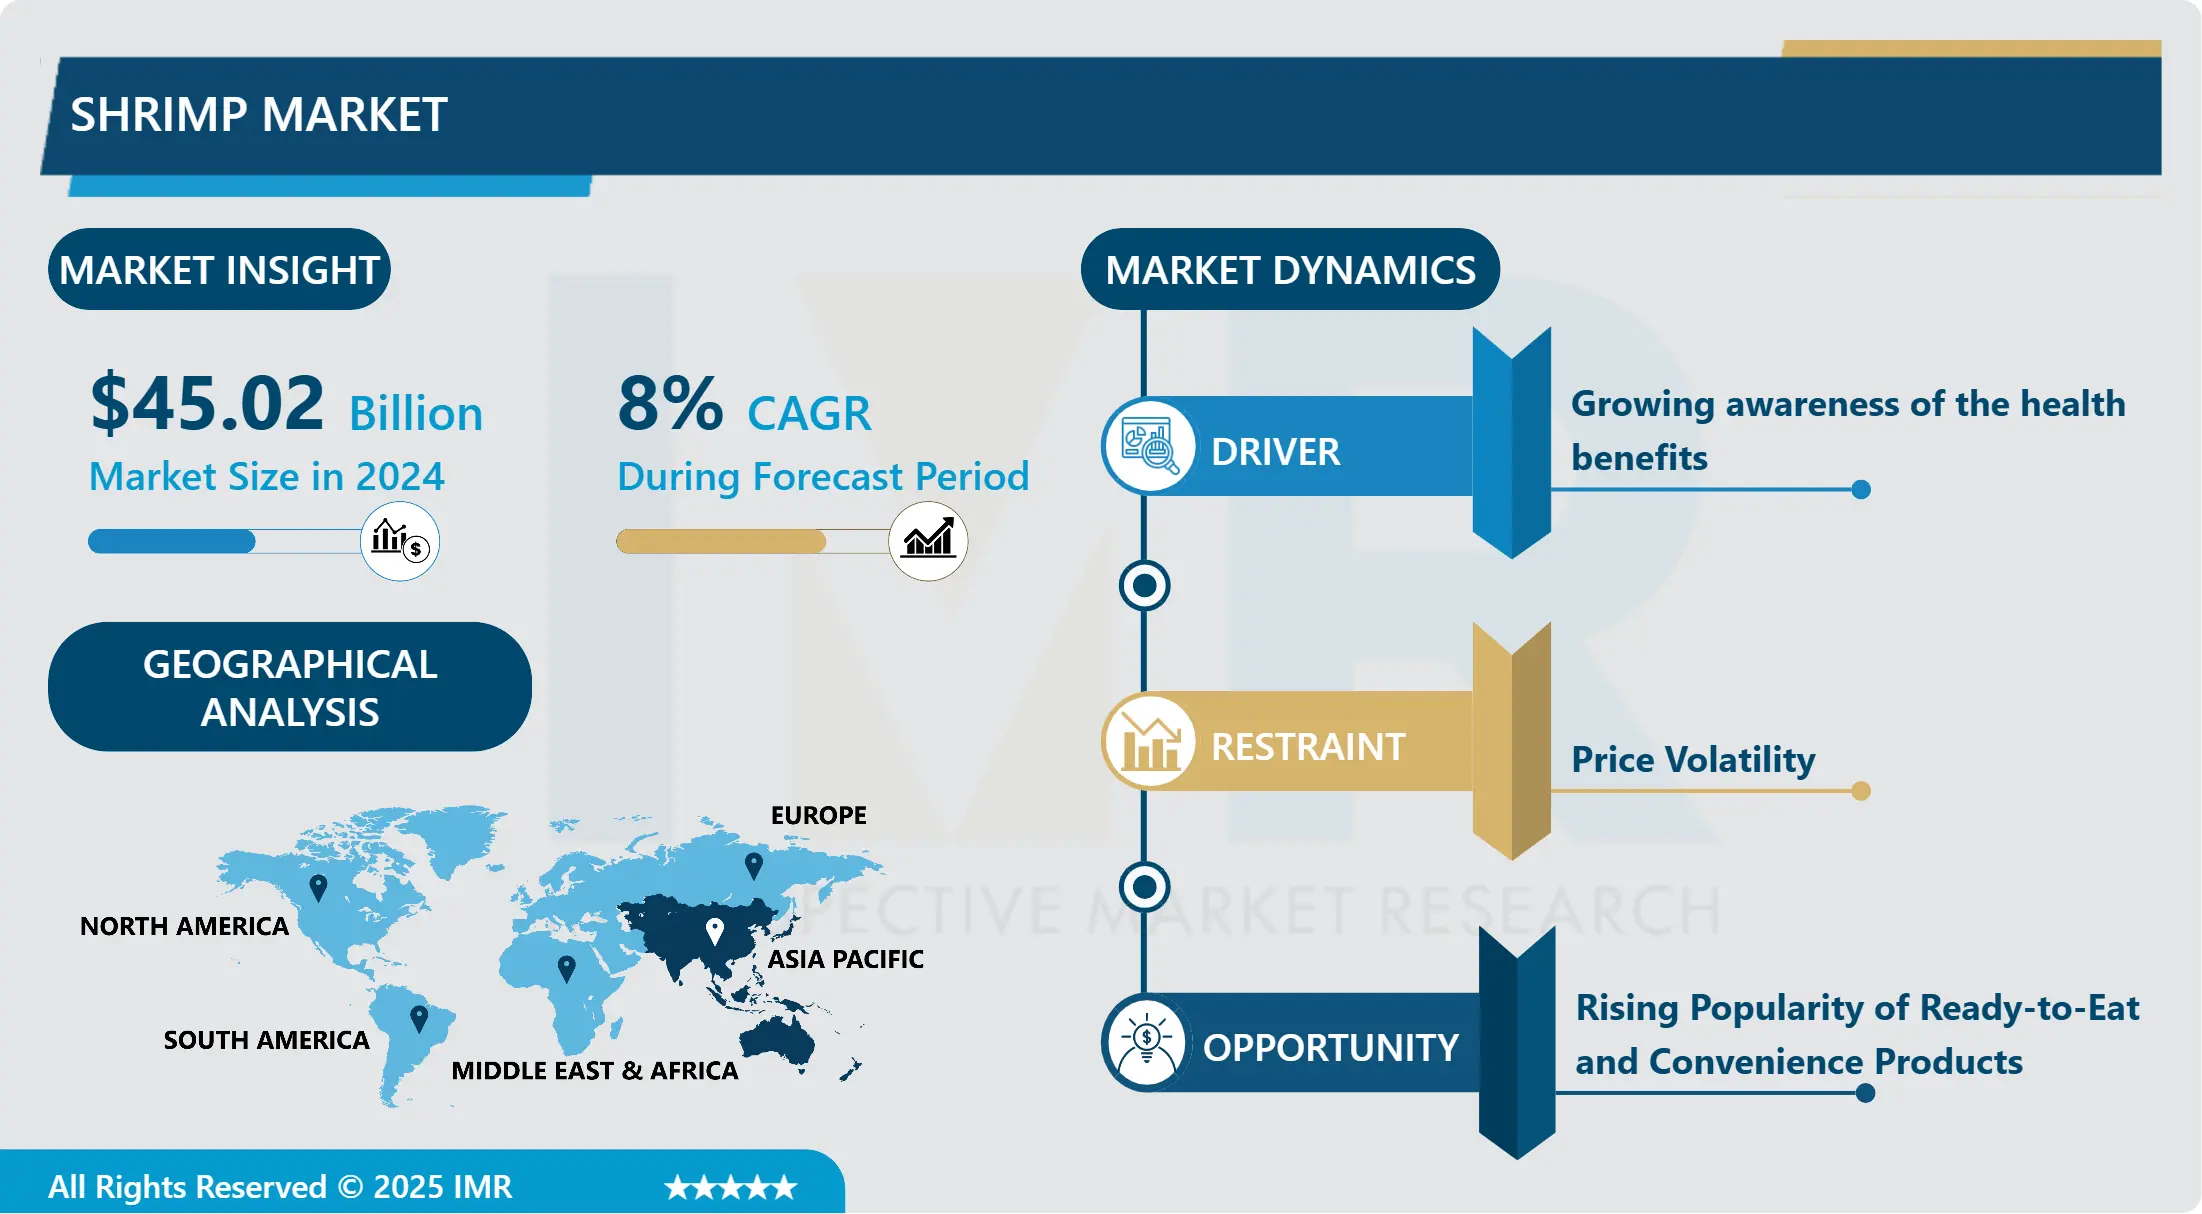
Shrimp Market Size Was Valued at USD 45.02 Billion in 2024, and is Projected to Reach USD 83.33 Billion by 2032, Growing at a CAGR of 8% From 2025-2032.
The shrimp market encompasses the global trade and consumption of decapod crustaceans, primarily falling under the Caridea and Dendrobranchiata classifications. Characterized by diverse species with elongated bodies and a distinctive swimming mode, the market is driven by the demand for larger shrimp species, notably for human consumption.
The global shrimp market is characterized by a diverse range of species falling under the Caridean and Dendrobranchiata classifications. Shrimp are decapod crustaceans with elongated bodies, featuring a distinctive swimming movement. Within these classifications, the Caridea group, encompassing smaller species and marine-exclusive variants, serves as a crucial criterion for differentiation. Shrimps, along with prawns, are integral components of the marine food web, boasting stalk-eyed structures, long muscular tails (abdomens), antennae, and slender legs.
The market dynamics are influenced by the demand for larger shrimp species, particularly in the context of commercial fisheries catering to human consumption. Shrimp farming, a significant aspect of aquaculture in tropical climates, has witnessed growth driven by factors such as increased health awareness regarding the benefits of shrimp consumption, the adoption of environmentally friendly production techniques, the prevalence of contract farming, and adherence to government regulations.
Shrimp Market Trend Analysis
Growing awareness of the health benefits
- Shrimp are recognized for their high nutritional value, serving as a rich source of lean protein, vitamins, and minerals. As consumers increasingly prioritize health-conscious choices, shrimp's profile as a low-calorie, low-fat protein option becomes more appealing. The presence of omega-3 fatty acids in shrimp further enhances their nutritional appeal, contributing to heart health.
- Changing dietary patterns, influenced by a global focus on wellness and healthier lifestyles, contribute to the upward trajectory of the shrimp market. Shrimp's versatility as a lean protein aligns with the preferences of individuals seeking nutritious and balanced dietary options. As wellness trends continue to shape consumer choices, the inclusion of shrimp in diets as a wholesome and flavourful choice gains momentum.
Rising Popularity of Ready-to-Eat and Convenience Products
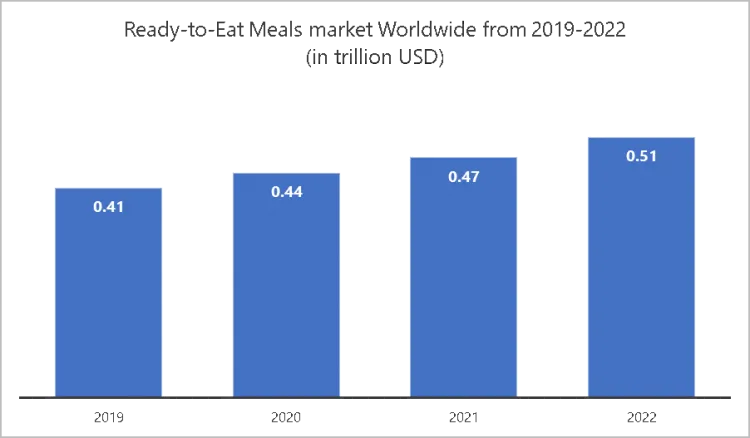
- The shrimp market is witnessing a notable opportunity driven by the rising popularity of ready-to-eat and convenience products. With evolving lifestyles and busy schedules, consumers increasingly seek convenient and time-saving food options. Ready-to-eat shrimp products, including pre-cooked or seasoned varieties, cater to this demand by providing a hassle-free and quick culinary solution.
- The surge in on-the-go consumption trends further amplifies the opportunity in the shrimp market. Ready-to-eat shrimp products align with the modern consumer's desire for portable and easily consumable snacks or meals. This trend is particularly prominent among urban populations, where the demand for convenient, nutritious, and tasty seafood options is on the rise.
- The given graph shows that the increasing popularity of ready-to-eat products signifies a shift in consumer preferences towards convenient and time-saving food options. Shrimp, being a versatile and easily adaptable ingredient, aligns seamlessly with this trend, becoming a favored choice for inclusion in ready-to-eat offerings. The convenience and accessibility of shrimp in various forms, such as pre-cooked or seasoned options, cater to the modern consumer's demand for hassle-free yet high-quality seafood solutions. This synergy between the burgeoning ready-to-eat market and the versatility of shrimp positions the shrimp industry on a growth trajectory, capitalizing on evolving consumer behaviors and preferences.
Shrimp Market Segment Analysis:
Shrimp Market Segmented on the basis of Species, Form, Size, Distribution Channel, Application and Region.
By Species, Farmed White Leg shrimp segment is expected to dominate the market during the forecast period
- The dominance of the Farmed white-leg shrimp segment in the shrimp market can be attributed to its high demand and controlled production. Farmed white-leg shrimp, also known as Litopenaeus vannamei, is favored for its fast growth rate and adaptability to aquaculture conditions. This species has become a cornerstone of the shrimp farming industry due to its ability to thrive in various environments and reach marketable sizes quickly.
- This species is known for its mild flavor, firm texture, and white meat, making it adaptable to various culinary styles and preferences worldwide. Its neutral taste profile makes it an ideal choice for diverse recipes and cuisines, contributing to its popularity in the food industry. Additionally, Farmed White Leg shrimp's widespread availability and consistent quality make it a preferred option for consumers, retailers, and food service providers, enhancing its position as a dominant force in the shrimp market.
By Form, Frozen segment held the largest share in 2024
- The dominance of the frozen segment in the shrimp market can be attributed to the inherent advantages it offers, particularly in terms of prolonged shelf life and enhanced convenience. Frozen shrimp products retain their freshness and quality for an extended period, allowing for efficient storage, distribution, and consumption. This aligns with consumer preferences for seafood that can be easily preserved without compromising taste or texture.
- The global dominance of the frozen shrimp segment is also influenced by its ability to facilitate widespread distribution and ensure year-round availability. Frozen shrimp can be transported over long distances without compromising quality, enabling global trade and meeting the demand in diverse markets. This not only expands the market reach but also allows consumers in regions without direct access to shrimp-producing areas to enjoy a consistent supply.
Shrimp Market Regional Insights:
Asia Pacific is Expected to Dominate the Market Over the Forecast period
- Asia-Pacific's dominance in the shrimp market is rooted in its robust aquaculture practices, with a primary focus on the production of vannamei shrimp. Countries such as China, Vietnam, India, Thailand, Indonesia, and Bangladesh have invested significantly in aquaculture infrastructure and technology, enabling them to efficiently cultivate large quantities of shrimp.
- The dominance of the Asia-Pacific region in both production and consumption of shrimp is closely tied to cultural preferences and high per capita consumption of seafood. In many Asian countries, seafood, including shrimp, holds a central place in culinary traditions. The cultural significance of seafood, combined with the accessibility and affordability of domestically produced shrimp, results in elevated per capita consumption rates.
Shrimp Market Top Key Players:
- High Liner Foods (USA)
- Gulf Shrimp Company (USA)
- CenSea (USA)
- Blue Star Foods Corp (USA)
- Trident Seafoods (USA)
- Austevoll Seafood ASA (Norway)
- Mowi ASA (Norway)
- Iglo Group (United Kingdom)
- Marine Harvest (Norway)
- Lerøy Seafood Group (Norway)
- Thai Union Europe (Thailand)
- Thai Union Group (Thailand)
- Charoen Pokphand Foods (Thailand)
- Vietnam Fisheries Company (Vietnam)
- Avanti Feeds Ltd (India)
- PT. Charoen Pokphand Indonesia (Indonesia)
- Zhanjiang Guolian Aquatic Products (China)
- Grobest Group (Taiwan)
- Nissui Group (Japan)
- High Hope Zhongding Corporation (China)
- Waterbase Ltd (India)
- Maruha Nichiro Corporation (Japan)
- Apex Frozen Foods Ltd (India)
- Amiya Foods (India)
- Fuzhou Yihua Aquatic Products (China)
- Pescanova Asia (Singapore)
- Other Active Players
Key Industry Developments in the Shrimp Market:
- In January 2023 High Liner Foods strategically unveiled a pioneering line of sustainable shrimp products, marked by a commitment to sourcing from farms certified by the prestigious Aquaculture Stewardship Council (ASC). This move underscores the company's dedication to environmentally responsible practices within the aquaculture industry. By introducing this new product line, High Liner Foods not only aligns itself with the principles of the ASC but also responds proactively to the growing consumer demand for ethically sourced and environmentally conscious seafood options.
|
Global Shrimp Market |
||||
|
Base Year: |
2024 |
Forecast Period: |
2025-2032 |
|
|
Historical Data: |
2018 to 2023 |
Market Size in 2024: |
USD 45.02 Bn. |
|
|
CAGR (2025-2032): |
8% |
Market Size in 2032: |
USD 83.33 Bn. |
|
|
Segments Covered: |
By Species |
|
|
|
|
By Form |
|
|
||
|
By Size |
|
|
||
|
By Distribution Channel |
|
|
||
|
By Application |
|
|
||
|
By Region |
|
|
||
|
Key Market Drivers: |
|
|||
|
Key Market Restraints: |
|
|||
|
Key Opportunities: |
|
|||
|
Companies Covered in the Report: |
|
|||
Chapter 1: Introduction
1.1 Scope and Coverage
Chapter 2:Executive Summary
Chapter 3: Market Landscape
3.1 Market Dynamics
3.1.1 Drivers
3.1.2 Restraints
3.1.3 Opportunities
3.1.4 Challenges
3.2 Market Trend Analysis
3.3 PESTLE Analysis
3.4 Porter's Five Forces Analysis
3.5 Industry Value Chain Analysis
3.6 Ecosystem
3.7 Regulatory Landscape
3.8 Price Trend Analysis
3.9 Patent Analysis
3.10 Technology Evolution
3.11 Investment Pockets
3.12 Import-Export Analysis
Chapter 4: Shrimp Market by Species (2018-2032)
4.1 Shrimp Market Snapshot and Growth Engine
4.2 Market Overview
4.3 Gulf Shrimps
4.3.1 Introduction and Market Overview
4.3.2 Historic and Forecasted Market Size in Value USD and Volume Units
4.3.3 Key Market Trends, Growth Factors, and Opportunities
4.3.4 Geographic Segmentation Analysis
4.4 Farmed White Leg Shrimps
4.5 Banded Coral Shrimps
4.6 Royal Red Shrimp
Chapter 5: Shrimp Market by Form (2018-2032)
5.1 Shrimp Market Snapshot and Growth Engine
5.2 Market Overview
5.3 Frozen
5.3.1 Introduction and Market Overview
5.3.2 Historic and Forecasted Market Size in Value USD and Volume Units
5.3.3 Key Market Trends, Growth Factors, and Opportunities
5.3.4 Geographic Segmentation Analysis
5.4 Canned
5.5 Breaded
5.6 Cooked
5.7 Peeled
Chapter 6: Shrimp Market by Size (2018-2032)
6.1 Shrimp Market Snapshot and Growth Engine
6.2 Market Overview
6.3 Extra-large
6.3.1 Introduction and Market Overview
6.3.2 Historic and Forecasted Market Size in Value USD and Volume Units
6.3.3 Key Market Trends, Growth Factors, and Opportunities
6.3.4 Geographic Segmentation Analysis
6.4 Large
6.5 Medium
6.6 Small
Chapter 7: Shrimp Market by Distribution Channel (2018-2032)
7.1 Shrimp Market Snapshot and Growth Engine
7.2 Market Overview
7.3 Online
7.3.1 Introduction and Market Overview
7.3.2 Historic and Forecasted Market Size in Value USD and Volume Units
7.3.3 Key Market Trends, Growth Factors, and Opportunities
7.3.4 Geographic Segmentation Analysis
7.4 Offline
Chapter 8: Shrimp Market by Application (2018-2032)
8.1 Shrimp Market Snapshot and Growth Engine
8.2 Market Overview
8.3 Food
8.3.1 Introduction and Market Overview
8.3.2 Historic and Forecasted Market Size in Value USD and Volume Units
8.3.3 Key Market Trends, Growth Factors, and Opportunities
8.3.4 Geographic Segmentation Analysis
8.4 Pharmaceutical
8.5 Cosmetics
Chapter 9: Company Profiles and Competitive Analysis
9.1 Competitive Landscape
9.1.1 Competitive Benchmarking
9.1.2 Shrimp Market Share by Manufacturer (2024)
9.1.3 Industry BCG Matrix
9.1.4 Heat Map Analysis
9.1.5 Mergers and Acquisitions
9.2 FOR THE SELF ADHESIVE LABELS MARKETAVERY DENNISON
9.2.1 Company Overview
9.2.2 Key Executives
9.2.3 Company Snapshot
9.2.4 Role of the Company in the Market
9.2.5 Sustainability and Social Responsibility
9.2.6 Operating Business Segments
9.2.7 Product Portfolio
9.2.8 Business Performance
9.2.9 Key Strategic Moves and Recent Developments
9.2.10 SWOT Analysis
9.3 CCL INDUSTRIES
9.4 MULTI-COLOR CORPORATION
9.5 UPM-KYMMENE
9.6 COVERIS HOLDINGS S.ATORRASPAPEL ADESTOR (PART OF LECTA GROUP)
9.7 FUJI SEAL INTERNATIONAL
9.8 LINTEC
9.9 AMERICA PACKAGING GROUP
9.10 INLAND LABEL
9.11 AND MARKETING SERVICES
9.12 C S LABELS
9.13 SECURA LABELS
9.14 HANSOL PAPER
9.15 TERRAGENE
9.16 BSP LABELS
9.17 LABEL CRAFT
9.18 ETIQUETTE LABELS
9.19 REFLEX LABELS
9.20 MUROLL
9.21 SVS SPOL. S R.OROYSTON LABELS
9.22 AZTEC LABEL
9.23 ETIS SLOVAKIA
Chapter 10: Global Shrimp Market By Region
10.1 Overview
10.2. North America Shrimp Market
10.2.1 Key Market Trends, Growth Factors and Opportunities
10.2.2 Top Key Companies
10.2.3 Historic and Forecasted Market Size by Segments
10.2.4 Historic and Forecasted Market Size by Species
10.2.4.1 Gulf Shrimps
10.2.4.2 Farmed White Leg Shrimps
10.2.4.3 Banded Coral Shrimps
10.2.4.4 Royal Red Shrimp
10.2.5 Historic and Forecasted Market Size by Form
10.2.5.1 Frozen
10.2.5.2 Canned
10.2.5.3 Breaded
10.2.5.4 Cooked
10.2.5.5 Peeled
10.2.6 Historic and Forecasted Market Size by Size
10.2.6.1 Extra-large
10.2.6.2 Large
10.2.6.3 Medium
10.2.6.4 Small
10.2.7 Historic and Forecasted Market Size by Distribution Channel
10.2.7.1 Online
10.2.7.2 Offline
10.2.8 Historic and Forecasted Market Size by Application
10.2.8.1 Food
10.2.8.2 Pharmaceutical
10.2.8.3 Cosmetics
10.2.9 Historic and Forecast Market Size by Country
10.2.9.1 US
10.2.9.2 Canada
10.2.9.3 Mexico
10.3. Eastern Europe Shrimp Market
10.3.1 Key Market Trends, Growth Factors and Opportunities
10.3.2 Top Key Companies
10.3.3 Historic and Forecasted Market Size by Segments
10.3.4 Historic and Forecasted Market Size by Species
10.3.4.1 Gulf Shrimps
10.3.4.2 Farmed White Leg Shrimps
10.3.4.3 Banded Coral Shrimps
10.3.4.4 Royal Red Shrimp
10.3.5 Historic and Forecasted Market Size by Form
10.3.5.1 Frozen
10.3.5.2 Canned
10.3.5.3 Breaded
10.3.5.4 Cooked
10.3.5.5 Peeled
10.3.6 Historic and Forecasted Market Size by Size
10.3.6.1 Extra-large
10.3.6.2 Large
10.3.6.3 Medium
10.3.6.4 Small
10.3.7 Historic and Forecasted Market Size by Distribution Channel
10.3.7.1 Online
10.3.7.2 Offline
10.3.8 Historic and Forecasted Market Size by Application
10.3.8.1 Food
10.3.8.2 Pharmaceutical
10.3.8.3 Cosmetics
10.3.9 Historic and Forecast Market Size by Country
10.3.9.1 Russia
10.3.9.2 Bulgaria
10.3.9.3 The Czech Republic
10.3.9.4 Hungary
10.3.9.5 Poland
10.3.9.6 Romania
10.3.9.7 Rest of Eastern Europe
10.4. Western Europe Shrimp Market
10.4.1 Key Market Trends, Growth Factors and Opportunities
10.4.2 Top Key Companies
10.4.3 Historic and Forecasted Market Size by Segments
10.4.4 Historic and Forecasted Market Size by Species
10.4.4.1 Gulf Shrimps
10.4.4.2 Farmed White Leg Shrimps
10.4.4.3 Banded Coral Shrimps
10.4.4.4 Royal Red Shrimp
10.4.5 Historic and Forecasted Market Size by Form
10.4.5.1 Frozen
10.4.5.2 Canned
10.4.5.3 Breaded
10.4.5.4 Cooked
10.4.5.5 Peeled
10.4.6 Historic and Forecasted Market Size by Size
10.4.6.1 Extra-large
10.4.6.2 Large
10.4.6.3 Medium
10.4.6.4 Small
10.4.7 Historic and Forecasted Market Size by Distribution Channel
10.4.7.1 Online
10.4.7.2 Offline
10.4.8 Historic and Forecasted Market Size by Application
10.4.8.1 Food
10.4.8.2 Pharmaceutical
10.4.8.3 Cosmetics
10.4.9 Historic and Forecast Market Size by Country
10.4.9.1 Germany
10.4.9.2 UK
10.4.9.3 France
10.4.9.4 The Netherlands
10.4.9.5 Italy
10.4.9.6 Spain
10.4.9.7 Rest of Western Europe
10.5. Asia Pacific Shrimp Market
10.5.1 Key Market Trends, Growth Factors and Opportunities
10.5.2 Top Key Companies
10.5.3 Historic and Forecasted Market Size by Segments
10.5.4 Historic and Forecasted Market Size by Species
10.5.4.1 Gulf Shrimps
10.5.4.2 Farmed White Leg Shrimps
10.5.4.3 Banded Coral Shrimps
10.5.4.4 Royal Red Shrimp
10.5.5 Historic and Forecasted Market Size by Form
10.5.5.1 Frozen
10.5.5.2 Canned
10.5.5.3 Breaded
10.5.5.4 Cooked
10.5.5.5 Peeled
10.5.6 Historic and Forecasted Market Size by Size
10.5.6.1 Extra-large
10.5.6.2 Large
10.5.6.3 Medium
10.5.6.4 Small
10.5.7 Historic and Forecasted Market Size by Distribution Channel
10.5.7.1 Online
10.5.7.2 Offline
10.5.8 Historic and Forecasted Market Size by Application
10.5.8.1 Food
10.5.8.2 Pharmaceutical
10.5.8.3 Cosmetics
10.5.9 Historic and Forecast Market Size by Country
10.5.9.1 China
10.5.9.2 India
10.5.9.3 Japan
10.5.9.4 South Korea
10.5.9.5 Malaysia
10.5.9.6 Thailand
10.5.9.7 Vietnam
10.5.9.8 The Philippines
10.5.9.9 Australia
10.5.9.10 New Zealand
10.5.9.11 Rest of APAC
10.6. Middle East & Africa Shrimp Market
10.6.1 Key Market Trends, Growth Factors and Opportunities
10.6.2 Top Key Companies
10.6.3 Historic and Forecasted Market Size by Segments
10.6.4 Historic and Forecasted Market Size by Species
10.6.4.1 Gulf Shrimps
10.6.4.2 Farmed White Leg Shrimps
10.6.4.3 Banded Coral Shrimps
10.6.4.4 Royal Red Shrimp
10.6.5 Historic and Forecasted Market Size by Form
10.6.5.1 Frozen
10.6.5.2 Canned
10.6.5.3 Breaded
10.6.5.4 Cooked
10.6.5.5 Peeled
10.6.6 Historic and Forecasted Market Size by Size
10.6.6.1 Extra-large
10.6.6.2 Large
10.6.6.3 Medium
10.6.6.4 Small
10.6.7 Historic and Forecasted Market Size by Distribution Channel
10.6.7.1 Online
10.6.7.2 Offline
10.6.8 Historic and Forecasted Market Size by Application
10.6.8.1 Food
10.6.8.2 Pharmaceutical
10.6.8.3 Cosmetics
10.6.9 Historic and Forecast Market Size by Country
10.6.9.1 Turkiye
10.6.9.2 Bahrain
10.6.9.3 Kuwait
10.6.9.4 Saudi Arabia
10.6.9.5 Qatar
10.6.9.6 UAE
10.6.9.7 Israel
10.6.9.8 South Africa
10.7. South America Shrimp Market
10.7.1 Key Market Trends, Growth Factors and Opportunities
10.7.2 Top Key Companies
10.7.3 Historic and Forecasted Market Size by Segments
10.7.4 Historic and Forecasted Market Size by Species
10.7.4.1 Gulf Shrimps
10.7.4.2 Farmed White Leg Shrimps
10.7.4.3 Banded Coral Shrimps
10.7.4.4 Royal Red Shrimp
10.7.5 Historic and Forecasted Market Size by Form
10.7.5.1 Frozen
10.7.5.2 Canned
10.7.5.3 Breaded
10.7.5.4 Cooked
10.7.5.5 Peeled
10.7.6 Historic and Forecasted Market Size by Size
10.7.6.1 Extra-large
10.7.6.2 Large
10.7.6.3 Medium
10.7.6.4 Small
10.7.7 Historic and Forecasted Market Size by Distribution Channel
10.7.7.1 Online
10.7.7.2 Offline
10.7.8 Historic and Forecasted Market Size by Application
10.7.8.1 Food
10.7.8.2 Pharmaceutical
10.7.8.3 Cosmetics
10.7.9 Historic and Forecast Market Size by Country
10.7.9.1 Brazil
10.7.9.2 Argentina
10.7.9.3 Rest of SA
Chapter 11 Analyst Viewpoint and Conclusion
11.1 Recommendations and Concluding Analysis
11.2 Potential Market Strategies
Chapter 12 Research Methodology
12.1 Research Process
12.2 Primary Research
12.3 Secondary Research
|
Global Shrimp Market |
||||
|
Base Year: |
2024 |
Forecast Period: |
2025-2032 |
|
|
Historical Data: |
2018 to 2023 |
Market Size in 2024: |
USD 45.02 Bn. |
|
|
CAGR (2025-2032): |
8% |
Market Size in 2032: |
USD 83.33 Bn. |
|
|
Segments Covered: |
By Species |
|
|
|
|
By Form |
|
|
||
|
By Size |
|
|
||
|
By Distribution Channel |
|
|
||
|
By Application |
|
|
||
|
By Region |
|
|
||
|
Key Market Drivers: |
|
|||
|
Key Market Restraints: |
|
|||
|
Key Opportunities: |
|
|||
|
Companies Covered in the Report: |
|
|||


