


Global Self-checkout System Market Overview
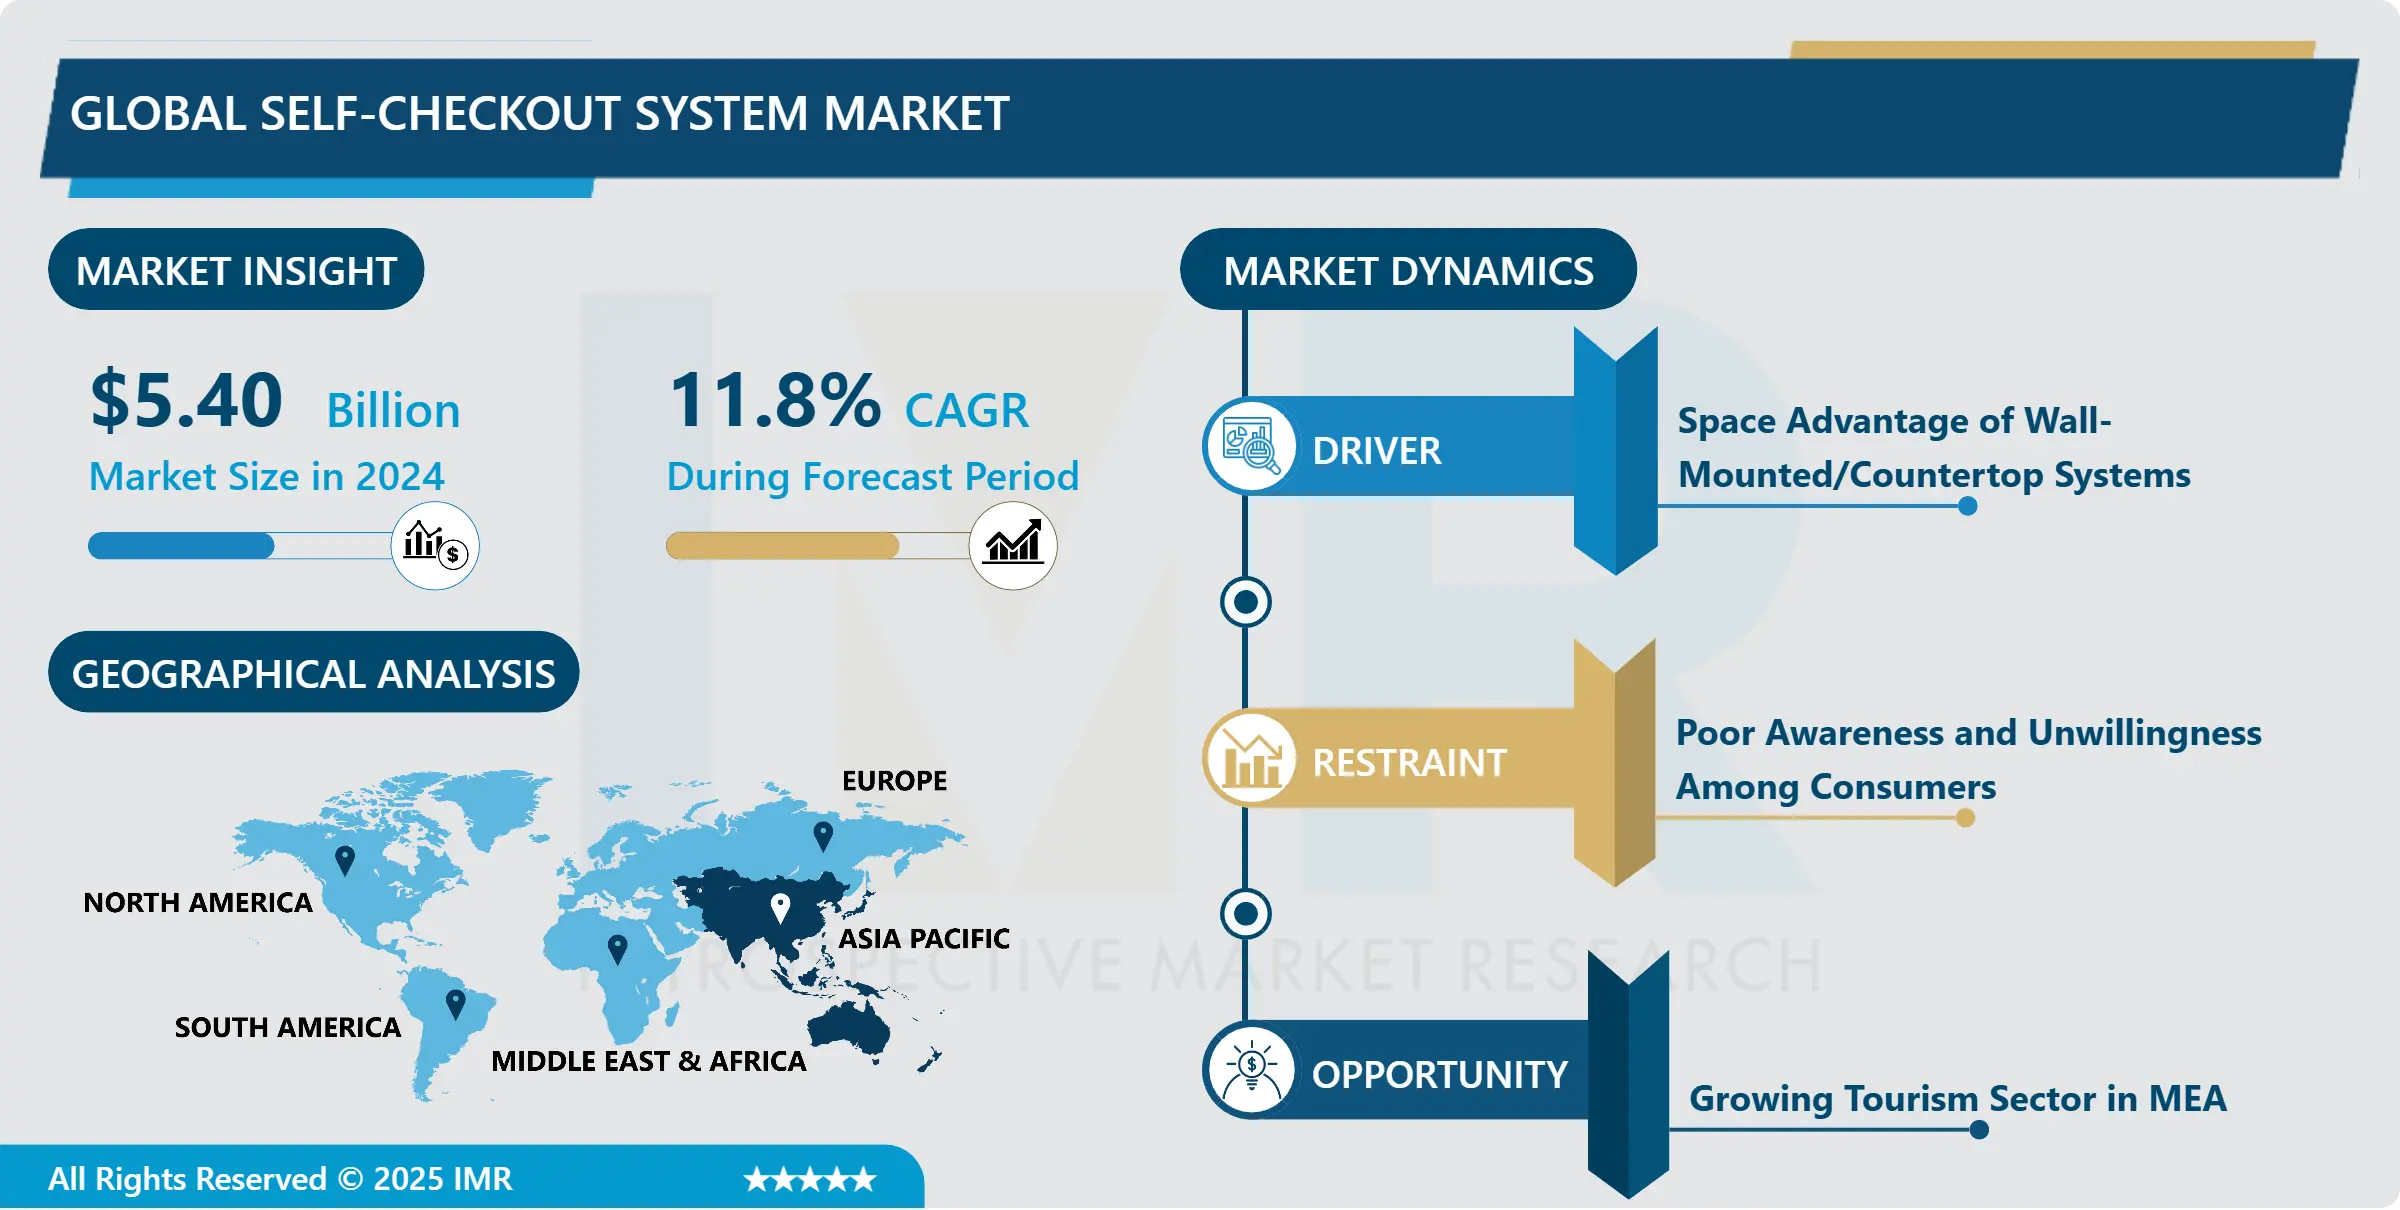
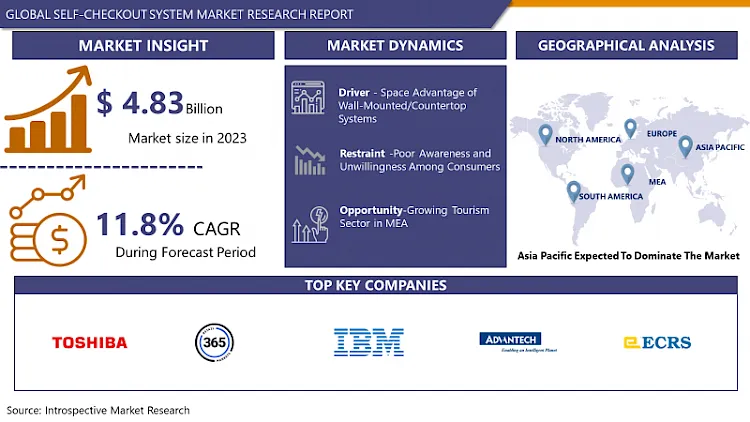
Global Self-Checkout System Market was valued at USD 5.40 Billion in 2024 and is expected to reach USD 13.18 Billion by the year 2032, at a CAGR of 11.8%.
A self-checkout is a checkout where customers scan, pack, and pay for their goods in a store without being served by a sales associate. Self-checkout has reduced waiting times and improved customer flow. Self-checkout systems enable customers to scan, pack, and pay for their items without assistance from a sales associate. These systems have significantly reduced waiting times and improved customer flow in retail environments. One of the key advantages is their efficient use of space; self-checkout terminals are more compact and can serve more customers than traditional cash registers.
The global self-checkout system market is experiencing significant growth, driven by the increasing demand for efficient and contactless shopping experiences. Retailers are investing in these systems to enhance customer satisfaction and streamline operations. Market trends indicate a rising adoption of advanced technologies such as AI and machine learning to improve the functionality and user experience of self-checkout terminals. Additionally, the COVID-19 pandemic has accelerated the shift towards self-service options, as they minimize physical contact and promote social distancing. The market is expected to continue expanding as more retailers recognize the benefits of self-checkout systems in improving customer service and operational efficiency.
Market Dynamics And Factors In Self-Checkout Systems Market
Drivers:
Space Advantage of Wall-Mounted/Countertop Systems
Industry share of wall-mounted/countertop systems is anticipated to increase in the forecasted period. This is attributed to their rising preference by small restaurant owners and medium-sized retailers as they are ideal for places having space limitations. Considering the bursting number of retailers and restaurants preferring automated processes, self-checkout machine producers are coming up with various solutions to provide powerful computational features in compact designs. For instance, Advanced Kiosks launched a self-checkout system comprising amplified speakers and a 17-inch touch screen LCD monitor to provide improved customer comfort.
Increasing Adoption of AI-Based Self-Checkout Systems
Artificial intelligence (AI)-based self-checkout systems are reaching demand from retailers. These systems enable customers to scan the individual product and direct them for the transaction. These systems can potentially overcome frauds that take place in supermarkets. For example, in January 2019, Fujitsu launched a novel self-checkout solution that leverages artificial intelligence to restraint fraud at supermarket self-checkouts.
Restraints:
Many consumers are unwilling to use Self-checkout systems, typically owing to poor awareness. Other people are declining to the utilizations of the self-checkout systems with the misbelief that hampers the jobs of cashiers. Moreover, some consumers have reported that they are not happy with the experience and hence have declined to use it. Hence, these factors are anticipated to hinder the growth of the global Self-checkout system market over the forecast period.
Opportunities:
Growing Tourism Sector in MEA
The Middle East & African self-checkout system industry will reach momentum due to the higher implementation of developed digital technologies. The initiating economic development by retail, mainly in Saudi Arabia and the UAE has made way for a higher count of large malls in the region for enchanting international tourists. The rising willingness for UAE as a shopping hub has helped to higher product penetration to provide developed and hassle-free experiences. The rising number of international tourists and the flourishing hospitality sector are other factors influencing the regional market growth. Moreover, the higher incorporation of digital payment techniques, including mobile wallets and smart cards to limit the requirement for handle cash-based financial transactions, will favor the demand for self-checkout kiosks. There are also enhancing economic conditions over Latin America and the Asia Pacific. The rising application of smartphones for timesaving and supporting customers to scan the items and pay through apps will also anchor the market forecast.
Market Segmentation
Segmentation Analysis of Self-Checkout Systems Market:
Based on the Offering Type, the service segment is expected to dominate the self-checkout systems market over the forecast period. The requirement for effective systems to supply faster processing, flexibility in the store's front end, and easy incorporation of systems and services in the traditional self-checkout, as well as checkout systems, is encouraging the retailers to prefer consulting, execution, and maintenance services.
Based on Transaction Type, the market is bifurcated into Cash Model Type and Cashless Model Type. Cash Model refers to the payment by cash and Cashless Model means payment by digital apps, the Covid has made people to not touch casually and thus aided to spend through online mode. Therefore, Covid and movement towards digitalization is the key reason for the expansion in the gain of Self-Checkout Systems.Covid-19 has made people be inside home and order mostly through online and hence to decrease any kind of human interaction people preferred for online mode of transaction, as they found paper made cash transaction risky.
Based on the Model Type, the mobile segment is anticipated to register the maximum Self-Checkout Systems market share over the forecast period. Mobile self-checkout systems are reaching popularity with the maximum speed increase in the adoption of smartphones during recent years. Consumers can scan items with their smartphones while shopping and can check out at a firmed self-payment counter. Mobile self-checkout systems allow busting the long queues at customer payment counters, in turn, enhancing customer satisfaction.
Based on the End-User, the supermarket type segment is expected to dominate the Self-Checkout Systems market during the forecast period. Supermarket type of market which is the large selves self-buying stores which incorporates household and food items. Departmental stores and those which have maximum product variety and hypermarkets are combinations of the supermarket and departmental store which has everything a customer requires on daily basis. The highest market for this is supermarkets as many big brands are coming up with e-commerce supermarkets and physical supermarkets which made customers buy at one go and therefore pay online. As the departmental stores and hypermarkets are generated in every lane of the city, a town the increment in these retailers' stores has also raised the online mode of payment that is Self-Checkout Systems.
Regional Analysis of Self-Checkout Systems Market:
Asia Pacific's self-checkout system market is expected to dominate the market during the forecast period due to the growing penetration of digitalization over all sectors. There is increasing application of digital wallets and smart cards for payment, motivating retailers to install self-checkout systems. Since the COVID-19 pandemic, various consumers are demanding the application of kiosks that decrease human interaction at stores, hotels, and transportation terminals. The enhancing economic conditions are favoring the installation of developed automated systems. A fully automated self-checkout system ensures fast, seamless, and easy check-out for guests while making sure authentication and security of travel documents/identity cards.
In North, America the region is expected to expand the Self-Checkout Systems market at the highest CAGR during the forecast period. The rising incorporation of self-checkout systems by the supermarkets and hypermarkets in the U.S. and Canada attributes to the regional segment growth during the forecast period.
Europe accounted for the significant growth rate for the Self-Checkout Systems market during the forecast period. The larger retailers, such as grocery chains and discount stores, are augmenting expansion self-checkout lanes. The hypermarket retail chain had already executed the NCR Corporation's self-checkout systems in its 160 stores and expected to continue its plans to hold self-checkout systems in its other stores.
Players Covered in Self-checkout System Market are:
- IBM Corporation
- Toshiba Global Commerce Solutions
- 365 Retail Markets
- Advantech Co.Ltd.
- Bayscan Technologies
- ECR Software (ECRS) Corporation
- Hisense Intelligent Commercial System Co. Ltd.
- Mashgin
- NCR Corporation
- Shelfx Inc.
- Pan-Oston
- Truno Retail Technology Solutions
- Versatile Credit Inc.
- Olea Kiosks Inc.
- Fujitsu Limited
- Elastic Path Software Inc.
- Crane Payment Innovations and ot
- Other Active Players
Key Industry Developments In Self-Checkout Systems Market
- In April 2024, Target added camera-based systems to its self-checkout registers to deter theft. The new technology detected items on scanners, alerted shoppers if an item was not scanned, and helped the company track shoppers if they failed to scan items even after being notified, Bloomberg reported Monday (April 8), citing internal company documents. According to the report, the system was piloted in some stores and slated for rollout to others later that year. The move aimed to reduce instances of theft at self-checkout registers by leveraging advanced detection and tracking capabilities.
- In April 2024, Amazon and Walmart rethought self-checkout to manage costs. As retailers sought the optimal blend of technology and human labor to enhance profit margins, both Amazon and Walmart made changes to their self-checkout approaches. Amazon replaced its Just Walk Out technology at Amazon Fresh stores with the smart shopping cart, the Amazon Dash Cart. Meanwhile, Walmart adjusted its self-checkout strategies to balance efficiency and customer experience. These changes reflected the companies' efforts to integrate advanced technology while ensuring cost-effectiveness and convenience for customers, aiming to maintain profitability in a competitive retail landscape.
|
Global Self-Checkout System Market |
|||
|
Base Year: |
2024 |
Forecast Period: |
2025-2032 |
|
Historical Data: |
2018 to 2023 |
Market Size in 2024: |
USD 5.40 Bn. |
|
Forecast Period 2024-32 CAGR: |
11.8% |
Market Size in 2032: |
USD 13.18 Bn. |
|
Segments Covered: |
By Type |
|
|
|
By Component |
|
||
|
By Application |
|
||
|
By Region |
|
||
|
Key Market Drivers: |
|
||
|
Key Market Restraints: |
|
||
|
Key Opportunities: |
|
||
|
Companies Covered in the report: |
|
||
Chapter 1: Introduction
1.1 Scope and Coverage
Chapter 2:Executive Summary
Chapter 3: Market Landscape
3.1 Market Dynamics
3.1.1 Drivers
3.1.2 Restraints
3.1.3 Opportunities
3.1.4 Challenges
3.2 Market Trend Analysis
3.3 PESTLE Analysis
3.4 Porter's Five Forces Analysis
3.5 Industry Value Chain Analysis
3.6 Ecosystem
3.7 Regulatory Landscape
3.8 Price Trend Analysis
3.9 Patent Analysis
3.10 Technology Evolution
3.11 Investment Pockets
3.12 Import-Export Analysis
Chapter 4: Self-checkout System Market by Type (2018-2032)
4.1 Self-checkout System Market Snapshot and Growth Engine
4.2 Market Overview
4.3 Cash
4.3.1 Introduction and Market Overview
4.3.2 Historic and Forecasted Market Size in Value USD and Volume Units
4.3.3 Key Market Trends, Growth Factors, and Opportunities
4.3.4 Geographic Segmentation Analysis
4.4 Cashless
Chapter 5: Self-checkout System Market by Component (2018-2032)
5.1 Self-checkout System Market Snapshot and Growth Engine
5.2 Market Overview
5.3 Systems
5.3.1 Introduction and Market Overview
5.3.2 Historic and Forecasted Market Size in Value USD and Volume Units
5.3.3 Key Market Trends, Growth Factors, and Opportunities
5.3.4 Geographic Segmentation Analysis
5.4 Services
Chapter 6: Self-checkout System Market by Application (2018-2032)
6.1 Self-checkout System Market Snapshot and Growth Engine
6.2 Market Overview
6.3 Supermarkets & Hypermarkets
6.3.1 Introduction and Market Overview
6.3.2 Historic and Forecasted Market Size in Value USD and Volume Units
6.3.3 Key Market Trends, Growth Factors, and Opportunities
6.3.4 Geographic Segmentation Analysis
6.4 Department Stores
6.5 Convenience Stores
6.6 Others
Chapter 7: Company Profiles and Competitive Analysis
7.1 Competitive Landscape
7.1.1 Competitive Benchmarking
7.1.2 Self-checkout System Market Share by Manufacturer (2024)
7.1.3 Industry BCG Matrix
7.1.4 Heat Map Analysis
7.1.5 Mergers and Acquisitions
7.2 BAYER AG
7.2.1 Company Overview
7.2.2 Key Executives
7.2.3 Company Snapshot
7.2.4 Role of the Company in the Market
7.2.5 Sustainability and Social Responsibility
7.2.6 Operating Business Segments
7.2.7 Product Portfolio
7.2.8 Business Performance
7.2.9 Key Strategic Moves and Recent Developments
7.2.10 SWOT Analysis
7.3 GE HEALTHCARE
7.4 PHILIPS HEALTHCARE
7.5 SIEMENS HEALTHCARE
7.6 FUJIFILM HOLDINGS CORPORATION
7.7 CANON INC.
7.8 PACSHEALTH
7.9 LLC
7.10 SECTRA AB
7.11 BRACCO IMAGING S.P.A.
7.12 QAELUM N.V.
7.13 AGFA HEALTHCARE
7.14 NOVARAD CORPORATION
7.15 MEDIC VISION
7.16 GUERBET
7.17 MEDSQUARE
7.18 INFINITT HEALTHCARE CO. LTD.
7.19 VOLPARA HELATH LIMITED.
7.20 MEDIC VISION
7.21 IMALOGIX
7.22 DEDALUS S.P.A
7.23 NANJING PERLOVE MEDICAL EQUIPMENT COLTD.
7.24 MIRION TECHNOLOGIES INCLANDAUER
7.25 POLIMASTER
7.26 FORTIVE
7.27 OTHER KEY PLAYERS
Chapter 8: Global Self-checkout System Market By Region
8.1 Overview
8.2. North America Self-checkout System Market
8.2.1 Key Market Trends, Growth Factors and Opportunities
8.2.2 Top Key Companies
8.2.3 Historic and Forecasted Market Size by Segments
8.2.4 Historic and Forecasted Market Size by Type
8.2.4.1 Cash
8.2.4.2 Cashless
8.2.5 Historic and Forecasted Market Size by Component
8.2.5.1 Systems
8.2.5.2 Services
8.2.6 Historic and Forecasted Market Size by Application
8.2.6.1 Supermarkets & Hypermarkets
8.2.6.2 Department Stores
8.2.6.3 Convenience Stores
8.2.6.4 Others
8.2.7 Historic and Forecast Market Size by Country
8.2.7.1 US
8.2.7.2 Canada
8.2.7.3 Mexico
8.3. Eastern Europe Self-checkout System Market
8.3.1 Key Market Trends, Growth Factors and Opportunities
8.3.2 Top Key Companies
8.3.3 Historic and Forecasted Market Size by Segments
8.3.4 Historic and Forecasted Market Size by Type
8.3.4.1 Cash
8.3.4.2 Cashless
8.3.5 Historic and Forecasted Market Size by Component
8.3.5.1 Systems
8.3.5.2 Services
8.3.6 Historic and Forecasted Market Size by Application
8.3.6.1 Supermarkets & Hypermarkets
8.3.6.2 Department Stores
8.3.6.3 Convenience Stores
8.3.6.4 Others
8.3.7 Historic and Forecast Market Size by Country
8.3.7.1 Russia
8.3.7.2 Bulgaria
8.3.7.3 The Czech Republic
8.3.7.4 Hungary
8.3.7.5 Poland
8.3.7.6 Romania
8.3.7.7 Rest of Eastern Europe
8.4. Western Europe Self-checkout System Market
8.4.1 Key Market Trends, Growth Factors and Opportunities
8.4.2 Top Key Companies
8.4.3 Historic and Forecasted Market Size by Segments
8.4.4 Historic and Forecasted Market Size by Type
8.4.4.1 Cash
8.4.4.2 Cashless
8.4.5 Historic and Forecasted Market Size by Component
8.4.5.1 Systems
8.4.5.2 Services
8.4.6 Historic and Forecasted Market Size by Application
8.4.6.1 Supermarkets & Hypermarkets
8.4.6.2 Department Stores
8.4.6.3 Convenience Stores
8.4.6.4 Others
8.4.7 Historic and Forecast Market Size by Country
8.4.7.1 Germany
8.4.7.2 UK
8.4.7.3 France
8.4.7.4 The Netherlands
8.4.7.5 Italy
8.4.7.6 Spain
8.4.7.7 Rest of Western Europe
8.5. Asia Pacific Self-checkout System Market
8.5.1 Key Market Trends, Growth Factors and Opportunities
8.5.2 Top Key Companies
8.5.3 Historic and Forecasted Market Size by Segments
8.5.4 Historic and Forecasted Market Size by Type
8.5.4.1 Cash
8.5.4.2 Cashless
8.5.5 Historic and Forecasted Market Size by Component
8.5.5.1 Systems
8.5.5.2 Services
8.5.6 Historic and Forecasted Market Size by Application
8.5.6.1 Supermarkets & Hypermarkets
8.5.6.2 Department Stores
8.5.6.3 Convenience Stores
8.5.6.4 Others
8.5.7 Historic and Forecast Market Size by Country
8.5.7.1 China
8.5.7.2 India
8.5.7.3 Japan
8.5.7.4 South Korea
8.5.7.5 Malaysia
8.5.7.6 Thailand
8.5.7.7 Vietnam
8.5.7.8 The Philippines
8.5.7.9 Australia
8.5.7.10 New Zealand
8.5.7.11 Rest of APAC
8.6. Middle East & Africa Self-checkout System Market
8.6.1 Key Market Trends, Growth Factors and Opportunities
8.6.2 Top Key Companies
8.6.3 Historic and Forecasted Market Size by Segments
8.6.4 Historic and Forecasted Market Size by Type
8.6.4.1 Cash
8.6.4.2 Cashless
8.6.5 Historic and Forecasted Market Size by Component
8.6.5.1 Systems
8.6.5.2 Services
8.6.6 Historic and Forecasted Market Size by Application
8.6.6.1 Supermarkets & Hypermarkets
8.6.6.2 Department Stores
8.6.6.3 Convenience Stores
8.6.6.4 Others
8.6.7 Historic and Forecast Market Size by Country
8.6.7.1 Turkiye
8.6.7.2 Bahrain
8.6.7.3 Kuwait
8.6.7.4 Saudi Arabia
8.6.7.5 Qatar
8.6.7.6 UAE
8.6.7.7 Israel
8.6.7.8 South Africa
8.7. South America Self-checkout System Market
8.7.1 Key Market Trends, Growth Factors and Opportunities
8.7.2 Top Key Companies
8.7.3 Historic and Forecasted Market Size by Segments
8.7.4 Historic and Forecasted Market Size by Type
8.7.4.1 Cash
8.7.4.2 Cashless
8.7.5 Historic and Forecasted Market Size by Component
8.7.5.1 Systems
8.7.5.2 Services
8.7.6 Historic and Forecasted Market Size by Application
8.7.6.1 Supermarkets & Hypermarkets
8.7.6.2 Department Stores
8.7.6.3 Convenience Stores
8.7.6.4 Others
8.7.7 Historic and Forecast Market Size by Country
8.7.7.1 Brazil
8.7.7.2 Argentina
8.7.7.3 Rest of SA
Chapter 9 Analyst Viewpoint and Conclusion
9.1 Recommendations and Concluding Analysis
9.2 Potential Market Strategies
Chapter 10 Research Methodology
10.1 Research Process
10.2 Primary Research
10.3 Secondary Research
|
Global Self-Checkout System Market |
|||
|
Base Year: |
2024 |
Forecast Period: |
2025-2032 |
|
Historical Data: |
2018 to 2023 |
Market Size in 2024: |
USD 5.40 Bn. |
|
Forecast Period 2024-32 CAGR: |
11.8% |
Market Size in 2032: |
USD 13.18 Bn. |
|
Segments Covered: |
By Type |
|
|
|
By Component |
|
||
|
By Application |
|
||
|
By Region |
|
||
|
Key Market Drivers: |
|
||
|
Key Market Restraints: |
|
||
|
Key Opportunities: |
|
||
|
Companies Covered in the report: |
|
||


