


Security as a Service Market Synopsis
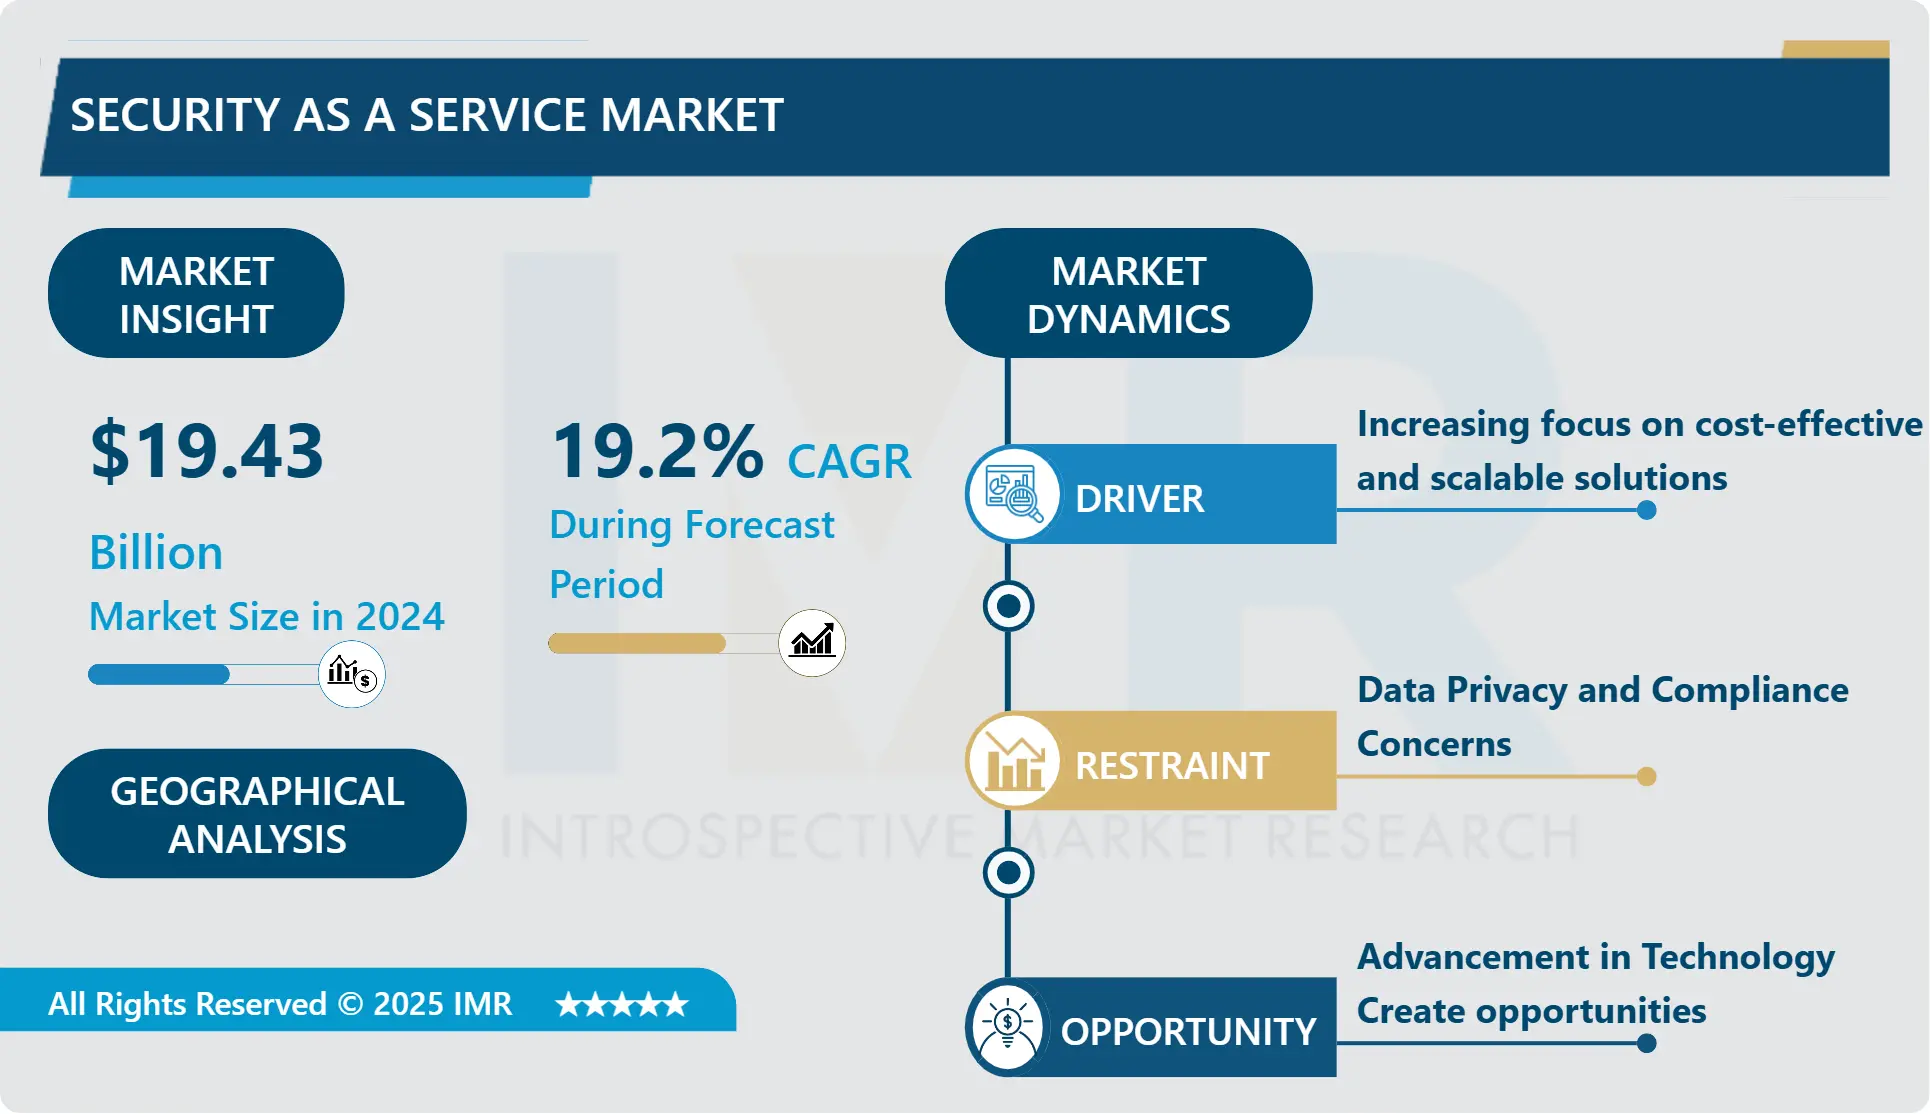
Security as a Service Market Size Was Valued at USD 19.43 Billion in 2024 and is Projected to Reach USD 79.19 Billion by 2032, Growing at a CAGR of 19.2% From 2025-2032.
Security as a Service (SECaaS) is a business model that a service provider implements a security service into a corporate network basis for a subscription wherein it is way cheaper than most people or companies could possibly implement on their own especially if one takes into account the cost recovery of the equipment and/or software required for such implementation. It allows organizations to unload cybersecurity management responsibility onto an unrelated third party. Outsourced information security services include services like data loss prevention service, anti virus administration service and intrusion detection service.
Moreover, SECaaS has been getting a very important solution for the current IT security. The new vulnerabilities rise with growing digital needs in firms. This make occur to require flexible security solutions, in this respect, SECaaS offers. It provides security as a service that creates value adaptively depending on the changes in an organization’s needs and security threats.
The nature of threats and attacks has evolved and this has led to growth of security risks hence encouraging growth of security as a service Market. Cyber-security threats have tremendously risen since more organizations and people are inter-connecting online. This is has caused a high levels of security as a service, where an organization hands over its security measures to a service provider.
In addition, there is increased demand for various solutions to meet emerging and more complex threats, which has contributed to the growth of the SECaaS market. The tactics of fraudsters are often updated with new methods, which are often beyond the protection of system-based security measures, and therefore, firms look for more sophisticated security protocols.
Moreover, it is pointed out that with the rising tendency towards cloud-based services, Saas is the biggest factor driving the security as a service market. On the other hand, the safety of information and data while using outsourcing models remains a significant factor in the expansion of the SECaaS market.
Furthermore it lies in complexities concerning the successful implementation of SECaaS that fuels the existing IT infrastructure hindering the overall growth of the market. Some of the companies that implement these security solutions often face issues with compatibility where the solution may not integrate well with the existing systems of the company thus compromising operational processes. This, on the other hand, is going to trigger the growth of security as a service in the future years due to the increased demand for enhanced threat intelligence and analytics solutions.

Security as a Service Market Trend Analysis
Rise in Cyber Attacks Drive the Market
- The rising trends in cyber-attacks prove to be a bigger challenge to various organizations across the various industries. Hackers are smart and change tactics frequently, engaging in different types of malicious software, ransomware, and phishing attacks that might target the system and the networks. But, with increasing threat levels, SECaaS is increasingly becoming strategic in helping enterprises bolster their security and manage risk levels. As per the 2023 research of Cybersecurity Ventures, The global average ransomware cost to the organization is USD 1. 85 million. This estimate is that, by 2031 there will be a ransomware attack every two seconds. Such trends unambiguously underlined the importance of improving security measures to a higher level.
- Besides, there is still an ever-present threat posed by phishing, whereby impostors send emails with a view to obtaining personal information from people. The application of SECaaS, including email security services is useful especially in combating phishing attacks. According to the study conducted by the Anti-Phishing Working Group (APWG), the global internet users suffered from 1,286,208 phishing attacks in the second quarter of the year 2023. This was the third largest quarterly figure documented by the APWG. To overcome these problems, SECaaS companies tend to employ improved threat intelligence and analysis in real-time. Yet, as noted by the APWG, there was a decline in the incidence of phishing.
Rise in Remote work culture
- The use of SECaaS to meet increasing security demands stemming from the new normal of remote work is expected to drive the growth of the market. Along these lines, there is growing realization about the need for protecting remote endpoints as well as distributed work environments to support the market. In addition, endpoint security threats, unauthorized access and data leak, information theft loom large as the working population expands their connectivity to enterprise networks and data anywhere any time with any device. Additionally, the inherent difficulties described above are managed by SECaaS solutions, allowing for endpoint protection, remote access security, and data encryption. Moreover, organisations can not only augment security for remote locations, but also control access and detect unusual activity regardless of the location or the device used by the employees, if cloud-based services are utilised.
- In addition to this, the solutions provided through SECaaS come with centralized control and visibility benefit that security personnel can easily oversee remote work spaces while adhering to regulations and best practices, which in turn is driving the growth of the market.
Security as a Service Market Segment Analysis:
Security as a Service Market is Segmented based on Component, Application, Organization Size, and Verticals.
By Application, Network Security segment is expected to dominate the market during the forecast period
- The network security segment is expected to show more market dominance in the near future. Network Security is a preventive measures of the network hostile-activity, which involves gathering and analyzing of various kinds of the network security event.
- Network security event is a sum of the data which is received from different network security devices and systems, which watch and protect a network from hostile activity. As the threat increases, there is an increased push of more cloud-based network security solutions to safeguard the network in term of restricting management of devices on the network to terminals.
By Organization Size, SMEs segment held the largest share in 2024
- The largest market share is enjoyed by the SME sector because of the emergence of numerous organizations and their need for cloud services. SMEs specific SECaaS products are intended for giving extensive yet cheap security solutions for the enterprises specifically possessing lesser resources. A survey conducted on Small Businesses by National Federation of Self-Employed & Small Businesses Limited reveals that these businesses are attacked by cyber criminals every day and the figure goes up to 10000. The improved data security and cost, efficiency, and client space and ease of access that cloud services provide over SMEs lead to the market’s expansion.
Security as a Service Market Regional Insights:
North America is Expected to Dominate the Market Over the Forecast period
- North America dominates the global security as a service market and is likely to expand at an 19 % CAGR during the forecast period. While this rate of increase is expected across the forecast period, the compound annual growth rate to be achieved is 3%. North America takes the largest share of the security industry as a service industry bearing basic firms with the likes of McAfee, Zscaler, International Business Machines Corporation and Microsoft Corporation, and others. The region also has a technologically advanced network and more and more users of the cloud services as well Internet users. As indicated in the ‘CISCO Annual Internet Report, 2018’, internet user by 2023 will be at 92% of the total population of the region. Competition and the stringently set security standards by the U. S. government have also compelled the business to grow a better service, which adheres to the set standards by the government, planning to extend the growth of Security as a service as demand is anticipated toincrease.
- Further, in the blog article published on January 6, 2023 by CompTIA the United States is named as the country most targeted out of the global attacks with a statistical percentage of 46%. Blackberry November 2023 research showcased that the US, Canada, Japan, Peru, & India would be amongst the most penetrated countries for generating demands for security service. Additionally, the key managers in the C-Suite and legislators in America buy security software, Infrastructure, and future technology to shield data from escalating threats in the digital realm. Rising adoption of security applications and an emerging interest from domestic security players in security solutions are other factors that are boosting the opportunity for security-as-a-service in the United States.
Active Key Players in the Security as a Service Market
- Alert Logic Inc.
- Barracuda Networks Inc.
- Cisco Systems Inc.
- Dell Technologies Inc.
- Fortinet Inc.
- International Business Machines Corporation
- McAfee LLC
- Microsoft Corporation
- Okta Inc.
- Proofpoint Inc.
- Qualys Inc.
- Radware Ltd.
- Trend Micro Incorporated
- Zscaler Inc.
- Other Active Players
Key Industry Developments in the Security as a Service Market:
- December 2023, Cisco Isovalent multi-clown networking and security- the acquisition art of devise.
- September 2023, Symantec, a division of Broadcom Inc. (NASDAQ: (BZ), partnered with Google Cloud to incorporate gen AI into the Symantec Security platform in stages that will afford customers a vast technological edge in identifying, comprehending, and eradicating complex cyber threats with this techdifferentiation.
|
Global Security as a Service Market |
|||
|
Base Year: |
2023 |
Forecast Period: |
2024-2032 |
|
Historical Data: |
2017 to 2023 |
Market Size in 2023: |
USD 16.3 Bn. |
|
Forecast Period 2024-32 CAGR: |
19.2 % |
Market Size in 2032: |
USD 79.2 Bn. |
|
Segments Covered: |
By Component |
|
|
|
By Application |
|
||
|
By Organization Size |
|
||
|
By Verticals |
|
||
|
By Region |
|
||
|
Key Market Drivers: |
|
||
|
Key Market Restraints: |
|
||
|
Key Opportunities: |
|
||
|
Companies Covered in the report: |
|
||
Chapter 1: Introduction
1.1 Scope and Coverage
Chapter 2:Executive Summary
Chapter 3: Market Landscape
3.1 Market Dynamics
3.1.1 Drivers
3.1.2 Restraints
3.1.3 Opportunities
3.1.4 Challenges
3.2 Market Trend Analysis
3.3 PESTLE Analysis
3.4 Porter's Five Forces Analysis
3.5 Industry Value Chain Analysis
3.6 Ecosystem
3.7 Regulatory Landscape
3.8 Price Trend Analysis
3.9 Patent Analysis
3.10 Technology Evolution
3.11 Investment Pockets
3.12 Import-Export Analysis
Chapter 4: Security as a Service Market by Component (2018-2032)
4.1 Security as a Service Market Snapshot and Growth Engine
4.2 Market Overview
4.3 Software
4.3.1 Introduction and Market Overview
4.3.2 Historic and Forecasted Market Size in Value USD and Volume Units
4.3.3 Key Market Trends, Growth Factors, and Opportunities
4.3.4 Geographic Segmentation Analysis
4.4 Services
Chapter 5: Security as a Service Market by Application (2018-2032)
5.1 Security as a Service Market Snapshot and Growth Engine
5.2 Market Overview
5.3 Network Security
5.3.1 Introduction and Market Overview
5.3.2 Historic and Forecasted Market Size in Value USD and Volume Units
5.3.3 Key Market Trends, Growth Factors, and Opportunities
5.3.4 Geographic Segmentation Analysis
5.4 Endpoint Security
5.5 Application Security
5.6 Cloud Security
5.7 Others (Email Security
5.8 Web Security
5.9 Database Security)
Chapter 6: Security as a Service Market by Organization Size (2018-2032)
6.1 Security as a Service Market Snapshot and Growth Engine
6.2 Market Overview
6.3 SMEs
6.3.1 Introduction and Market Overview
6.3.2 Historic and Forecasted Market Size in Value USD and Volume Units
6.3.3 Key Market Trends, Growth Factors, and Opportunities
6.3.4 Geographic Segmentation Analysis
6.4 Large Enterprises
Chapter 7: Security as a Service Market by Verticals (2018-2032)
7.1 Security as a Service Market Snapshot and Growth Engine
7.2 Market Overview
7.3 Banking
7.3.1 Introduction and Market Overview
7.3.2 Historic and Forecasted Market Size in Value USD and Volume Units
7.3.3 Key Market Trends, Growth Factors, and Opportunities
7.3.4 Geographic Segmentation Analysis
7.4 Financial Services
7.5 Insurance
7.6 Government and Defense
7.7 Retail
7.8 Healthcare
7.9 IT and Telecom
7.10 Energy and Utilities
7.11 Manufacturing
7.12 Others (Travel and Hospitality
7.13 Education
7.14 Media
7.15 and Entertainment)
Chapter 8: Company Profiles and Competitive Analysis
8.1 Competitive Landscape
8.1.1 Competitive Benchmarking
8.1.2 Security as a Service Market Share by Manufacturer (2024)
8.1.3 Industry BCG Matrix
8.1.4 Heat Map Analysis
8.1.5 Mergers and Acquisitions
8.2 SALESFORCE (US)
8.2.1 Company Overview
8.2.2 Key Executives
8.2.3 Company Snapshot
8.2.4 Role of the Company in the Market
8.2.5 Sustainability and Social Responsibility
8.2.6 Operating Business Segments
8.2.7 Product Portfolio
8.2.8 Business Performance
8.2.9 Key Strategic Moves and Recent Developments
8.2.10 SWOT Analysis
8.3 MICROSOFT (US)
8.4 GOOGLE (US)
8.5 ADOBE (US)
8.6 ORACLE (US)
8.7 IBM (US)
8.8 SERVICENOW (US)
8.9 WORKDAY (US)
8.10 SLACK (US)
8.11 ZOOM (US)
8.12 DROPBOX (US)
8.13 BOX (US)
8.14 CISCO (US)
8.15 HUBSPOT (US)
8.16 ZENDESK (US)
8.17 INTUIT (US)
8.18 FRESHWORKS (US)
8.19 SURVEYMONKEY (US)
8.20 DOCUSIGN (US)
8.21 ASANA (US)
8.22 SHOPIFY (CANADA)
8.23 SAP (GERMANY)
8.24 ATLASSIAN (AUSTRALIA)
8.25 ZOHO (INDIA)
8.26
Chapter 9: Global Security as a Service Market By Region
9.1 Overview
9.2. North America Security as a Service Market
9.2.1 Key Market Trends, Growth Factors and Opportunities
9.2.2 Top Key Companies
9.2.3 Historic and Forecasted Market Size by Segments
9.2.4 Historic and Forecasted Market Size by Component
9.2.4.1 Software
9.2.4.2 Services
9.2.5 Historic and Forecasted Market Size by Application
9.2.5.1 Network Security
9.2.5.2 Endpoint Security
9.2.5.3 Application Security
9.2.5.4 Cloud Security
9.2.5.5 Others (Email Security
9.2.5.6 Web Security
9.2.5.7 Database Security)
9.2.6 Historic and Forecasted Market Size by Organization Size
9.2.6.1 SMEs
9.2.6.2 Large Enterprises
9.2.7 Historic and Forecasted Market Size by Verticals
9.2.7.1 Banking
9.2.7.2 Financial Services
9.2.7.3 Insurance
9.2.7.4 Government and Defense
9.2.7.5 Retail
9.2.7.6 Healthcare
9.2.7.7 IT and Telecom
9.2.7.8 Energy and Utilities
9.2.7.9 Manufacturing
9.2.7.10 Others (Travel and Hospitality
9.2.7.11 Education
9.2.7.12 Media
9.2.7.13 and Entertainment)
9.2.8 Historic and Forecast Market Size by Country
9.2.8.1 US
9.2.8.2 Canada
9.2.8.3 Mexico
9.3. Eastern Europe Security as a Service Market
9.3.1 Key Market Trends, Growth Factors and Opportunities
9.3.2 Top Key Companies
9.3.3 Historic and Forecasted Market Size by Segments
9.3.4 Historic and Forecasted Market Size by Component
9.3.4.1 Software
9.3.4.2 Services
9.3.5 Historic and Forecasted Market Size by Application
9.3.5.1 Network Security
9.3.5.2 Endpoint Security
9.3.5.3 Application Security
9.3.5.4 Cloud Security
9.3.5.5 Others (Email Security
9.3.5.6 Web Security
9.3.5.7 Database Security)
9.3.6 Historic and Forecasted Market Size by Organization Size
9.3.6.1 SMEs
9.3.6.2 Large Enterprises
9.3.7 Historic and Forecasted Market Size by Verticals
9.3.7.1 Banking
9.3.7.2 Financial Services
9.3.7.3 Insurance
9.3.7.4 Government and Defense
9.3.7.5 Retail
9.3.7.6 Healthcare
9.3.7.7 IT and Telecom
9.3.7.8 Energy and Utilities
9.3.7.9 Manufacturing
9.3.7.10 Others (Travel and Hospitality
9.3.7.11 Education
9.3.7.12 Media
9.3.7.13 and Entertainment)
9.3.8 Historic and Forecast Market Size by Country
9.3.8.1 Russia
9.3.8.2 Bulgaria
9.3.8.3 The Czech Republic
9.3.8.4 Hungary
9.3.8.5 Poland
9.3.8.6 Romania
9.3.8.7 Rest of Eastern Europe
9.4. Western Europe Security as a Service Market
9.4.1 Key Market Trends, Growth Factors and Opportunities
9.4.2 Top Key Companies
9.4.3 Historic and Forecasted Market Size by Segments
9.4.4 Historic and Forecasted Market Size by Component
9.4.4.1 Software
9.4.4.2 Services
9.4.5 Historic and Forecasted Market Size by Application
9.4.5.1 Network Security
9.4.5.2 Endpoint Security
9.4.5.3 Application Security
9.4.5.4 Cloud Security
9.4.5.5 Others (Email Security
9.4.5.6 Web Security
9.4.5.7 Database Security)
9.4.6 Historic and Forecasted Market Size by Organization Size
9.4.6.1 SMEs
9.4.6.2 Large Enterprises
9.4.7 Historic and Forecasted Market Size by Verticals
9.4.7.1 Banking
9.4.7.2 Financial Services
9.4.7.3 Insurance
9.4.7.4 Government and Defense
9.4.7.5 Retail
9.4.7.6 Healthcare
9.4.7.7 IT and Telecom
9.4.7.8 Energy and Utilities
9.4.7.9 Manufacturing
9.4.7.10 Others (Travel and Hospitality
9.4.7.11 Education
9.4.7.12 Media
9.4.7.13 and Entertainment)
9.4.8 Historic and Forecast Market Size by Country
9.4.8.1 Germany
9.4.8.2 UK
9.4.8.3 France
9.4.8.4 The Netherlands
9.4.8.5 Italy
9.4.8.6 Spain
9.4.8.7 Rest of Western Europe
9.5. Asia Pacific Security as a Service Market
9.5.1 Key Market Trends, Growth Factors and Opportunities
9.5.2 Top Key Companies
9.5.3 Historic and Forecasted Market Size by Segments
9.5.4 Historic and Forecasted Market Size by Component
9.5.4.1 Software
9.5.4.2 Services
9.5.5 Historic and Forecasted Market Size by Application
9.5.5.1 Network Security
9.5.5.2 Endpoint Security
9.5.5.3 Application Security
9.5.5.4 Cloud Security
9.5.5.5 Others (Email Security
9.5.5.6 Web Security
9.5.5.7 Database Security)
9.5.6 Historic and Forecasted Market Size by Organization Size
9.5.6.1 SMEs
9.5.6.2 Large Enterprises
9.5.7 Historic and Forecasted Market Size by Verticals
9.5.7.1 Banking
9.5.7.2 Financial Services
9.5.7.3 Insurance
9.5.7.4 Government and Defense
9.5.7.5 Retail
9.5.7.6 Healthcare
9.5.7.7 IT and Telecom
9.5.7.8 Energy and Utilities
9.5.7.9 Manufacturing
9.5.7.10 Others (Travel and Hospitality
9.5.7.11 Education
9.5.7.12 Media
9.5.7.13 and Entertainment)
9.5.8 Historic and Forecast Market Size by Country
9.5.8.1 China
9.5.8.2 India
9.5.8.3 Japan
9.5.8.4 South Korea
9.5.8.5 Malaysia
9.5.8.6 Thailand
9.5.8.7 Vietnam
9.5.8.8 The Philippines
9.5.8.9 Australia
9.5.8.10 New Zealand
9.5.8.11 Rest of APAC
9.6. Middle East & Africa Security as a Service Market
9.6.1 Key Market Trends, Growth Factors and Opportunities
9.6.2 Top Key Companies
9.6.3 Historic and Forecasted Market Size by Segments
9.6.4 Historic and Forecasted Market Size by Component
9.6.4.1 Software
9.6.4.2 Services
9.6.5 Historic and Forecasted Market Size by Application
9.6.5.1 Network Security
9.6.5.2 Endpoint Security
9.6.5.3 Application Security
9.6.5.4 Cloud Security
9.6.5.5 Others (Email Security
9.6.5.6 Web Security
9.6.5.7 Database Security)
9.6.6 Historic and Forecasted Market Size by Organization Size
9.6.6.1 SMEs
9.6.6.2 Large Enterprises
9.6.7 Historic and Forecasted Market Size by Verticals
9.6.7.1 Banking
9.6.7.2 Financial Services
9.6.7.3 Insurance
9.6.7.4 Government and Defense
9.6.7.5 Retail
9.6.7.6 Healthcare
9.6.7.7 IT and Telecom
9.6.7.8 Energy and Utilities
9.6.7.9 Manufacturing
9.6.7.10 Others (Travel and Hospitality
9.6.7.11 Education
9.6.7.12 Media
9.6.7.13 and Entertainment)
9.6.8 Historic and Forecast Market Size by Country
9.6.8.1 Turkiye
9.6.8.2 Bahrain
9.6.8.3 Kuwait
9.6.8.4 Saudi Arabia
9.6.8.5 Qatar
9.6.8.6 UAE
9.6.8.7 Israel
9.6.8.8 South Africa
9.7. South America Security as a Service Market
9.7.1 Key Market Trends, Growth Factors and Opportunities
9.7.2 Top Key Companies
9.7.3 Historic and Forecasted Market Size by Segments
9.7.4 Historic and Forecasted Market Size by Component
9.7.4.1 Software
9.7.4.2 Services
9.7.5 Historic and Forecasted Market Size by Application
9.7.5.1 Network Security
9.7.5.2 Endpoint Security
9.7.5.3 Application Security
9.7.5.4 Cloud Security
9.7.5.5 Others (Email Security
9.7.5.6 Web Security
9.7.5.7 Database Security)
9.7.6 Historic and Forecasted Market Size by Organization Size
9.7.6.1 SMEs
9.7.6.2 Large Enterprises
9.7.7 Historic and Forecasted Market Size by Verticals
9.7.7.1 Banking
9.7.7.2 Financial Services
9.7.7.3 Insurance
9.7.7.4 Government and Defense
9.7.7.5 Retail
9.7.7.6 Healthcare
9.7.7.7 IT and Telecom
9.7.7.8 Energy and Utilities
9.7.7.9 Manufacturing
9.7.7.10 Others (Travel and Hospitality
9.7.7.11 Education
9.7.7.12 Media
9.7.7.13 and Entertainment)
9.7.8 Historic and Forecast Market Size by Country
9.7.8.1 Brazil
9.7.8.2 Argentina
9.7.8.3 Rest of SA
Chapter 10 Analyst Viewpoint and Conclusion
10.1 Recommendations and Concluding Analysis
10.2 Potential Market Strategies
Chapter 11 Research Methodology
11.1 Research Process
11.2 Primary Research
11.3 Secondary Research
|
Global Security as a Service Market |
|||
|
Base Year: |
2023 |
Forecast Period: |
2024-2032 |
|
Historical Data: |
2017 to 2023 |
Market Size in 2023: |
USD 16.3 Bn. |
|
Forecast Period 2024-32 CAGR: |
19.2 % |
Market Size in 2032: |
USD 79.2 Bn. |
|
Segments Covered: |
By Component |
|
|
|
By Application |
|
||
|
By Organization Size |
|
||
|
By Verticals |
|
||
|
By Region |
|
||
|
Key Market Drivers: |
|
||
|
Key Market Restraints: |
|
||
|
Key Opportunities: |
|
||
|
Companies Covered in the report: |
|
||


