


Organic Energy Bar Market Synopsis
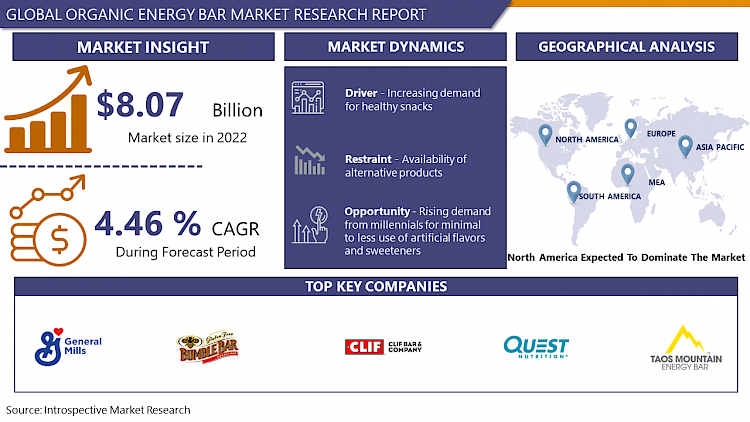
Organic Energy Bar Market Size Was Valued at USD 8.07 Billion in 2022 and is Projected to Reach USD 11.44 Billion by 2030, Growing at a CAGR of 4.46% From 2023-2030.
Organic Energy Bars are emerging as a popular snack option, especially among health-conscious consumers. These bars are typically made from a blend of natural ingredients like cereals, dry fruits, wheat, whey, oats, and nuts. They are designed to provide a quick energy boost while fulfilling the body's requirements for proteins, fats, and carbohydrates. The use of all-organic ingredients makes them highly appealing, particularly to the younger generation who are increasingly conscious about their food choices.
- The market for Organic Energy Bars is experiencing a surge, driven largely by growing global awareness of the harmful effects of unhealthy food ingredients. Consumers are more informed and cautious about what they eat, with a focus on avoiding products that contain non-organic or potentially harmful components. This trend is particularly noticeable among individuals seeking to manage their weight, those dealing with obesity, and people with specific dietary restrictions like wheat allergies. As a result, there's a rising demand for gluten-free options, with gluten commonly found in grains such as wheat, barley, rye, and triticale (a wheat-rye cross).
- To meet this growing demand, numerous food processing companies are expanding their product lines to include gluten-free Organic Energy Bars. These products cater to a wide range of dietary needs and preferences, making them a versatile choice for consumers looking for healthy, convenient snack options. The availability of these bars in various flavors and compositions further broadens their appeal, positioning them as a significant segment in the health food market.
Organic Energy Bar Market Trend Analysis
Increasing Demand For Healthy Snacks
- Consumers are becoming more mindful of what they eat, often seeking out food options that offer both convenience and nutritional value. Organic energy bars fit perfectly into this category as they are perceived as a healthier alternative to traditional snack options. These bars are often made with natural ingredients, free from artificial additives, and are packed with nutrients that cater to various health needs, such as high protein, low sugar, gluten-free, and high fiber. This makes them an appealing choice for health-conscious consumers, including those who are fitness enthusiasts, working professionals seeking quick and nutritious snacks, and individuals with specific dietary requirements.
- Modern lifestyles are increasingly fast-paced and time-constrained, leading to a rise in demand for convenient snack options that can be consumed on the go. Organic energy bars meet this need by offering a quick, portable, and mess-free eating solution that fits into busy schedules. These bars are particularly popular among people who lead active lifestyles, as they provide a quick energy boost and are easy to carry around.
Rising demand from millennials for minimal to less use of artificial flavors and sweeteners.
- Millennials are increasingly health-conscious, preferring products with natural ingredients. This trend opens a lucrative market for organic energy bars made with whole, organic ingredients, free from artificial flavors and sweeteners. These bars cater to the growing demand for healthier snacking options that align with a wellness-oriented lifestyle. Brands can capitalize on this by highlighting the natural benefits and nutritional value of their organic energy bars, which can include enhanced energy levels, better digestion, and no adverse effects from artificial additives.
- This demographic is not only health-conscious but also environmentally aware. They tend to support brands that demonstrate a commitment to sustainability and ethical practices. Organic energy bars, by their organic ingredients, often have a lower environmental footprint and are perceived as more 'eco-friendly'. Marketing these products with an emphasis on their organic, non-GMO, and ethically sourced ingredients can appeal to millennials who are willing to pay a premium for products that align with their values of health, sustainability, and responsible consumption.
Organic Energy Bar Market Segment Analysis:
Organic Energy Bar Market Segmented on the basis of type, Distribution Channel, and end-users.
By Type, Protein Bar segment is expected to dominate the market during the forecast period
- The increasing focus on fitness and a healthy lifestyle among consumers is a key driver for the popularity of protein bars. Protein is essential for muscle repair, growth, and overall health, making protein bars an attractive option for fitness enthusiasts, athletes, and individuals seeking convenient nutrition. The appeal of protein bars in the organic segment is heightened by the clean label - they often contain natural, whole food sources of protein such as nuts, seeds, and organic plant-based proteins. This aligns with the growing consumer preference for transparency in ingredient sourcing and the avoidance of artificial additives.
- Protein bars offer a convenient, on-the-go nutrition solution that fits the busy lifestyles of modern consumers, especially millennials and working professionals. They are often used as meal replacements, snacks, or energy boosts during workouts, making them a versatile dietary option. Organic protein bars, in particular, are seen as a healthier alternative to traditional snack bars, as they are made with organic ingredients and are free of synthetic preservatives and flavors.
By Distribution Channel, Hypermarket/Supermarket segment held the largest share of 38.9% in 2022
- Hypermarkets and supermarkets are traditionally the most accessible and widely used retail channels for a vast majority of consumers. They offer a broad range of products under one roof, including a diverse selection of organic energy bars. This variety appeals to consumers who prefer to physically inspect products before purchase and enjoy the convenience of one-stop shopping for all their grocery needs. The presence of organic energy bars in these retail spaces exposes the product to a large, varied customer base, increasing the likelihood of purchase by those who might not seek them out specifically.
- Hypermarkets and supermarkets are known for their strategic product placements and promotional activities. Organic energy bars are often placed in prominent locations within these stores, such as near the checkout counters or in the health food aisle, making them highly visible and easily accessible to shoppers.
Organic Energy Bar Market Regional Insights:
Asia Pacific is Expected to Dominate the Market Over the Forecast period
- North American consumers are increasingly seeking out healthier, on-the-go snack alternatives that align with their dietary preferences and busy lifestyles. Organic energy bars cater to this demand by offering nutritious, portable, and easy-to-consume options. Additionally, the presence of major players like Clif Bar and KIND in the region contributes significantly. These companies have established strong brand recognition and loyalty, continuously innovating and expanding their product lines to meet diverse consumer needs, thus fueling the market growth in this region.
- North American Organic Energy Bar Market faces challenges that could impact its growth trajectory. A potential economic slowdown can lead to reduced consumer spending power, affecting discretionary purchases like organic energy bars, which are often priced higher than conventional snack options. Furthermore, certain segments of the market are approaching saturation, making it increasingly difficult for new entrants to gain a foothold or for existing players to maintain their market share without significant innovation or diversification.
Organic Energy Bar Market Top Key Players:
- Clif Bar & Company(United States)
- General Mills Inc. (United States)
- Mehret Bar (United States)
- TAOS MOUNTAIN ENERGY FOODS (United States)
- BumbleBar Inc. (United States)
- Atkins Nutritionals, Inc. (United States)
- Quest Nutrition LLC (United States)
- McKee Foods Corporation (United States)
- Kellogg Company (United States)
- Quaker Oats Company (United States)
- Power Bar (United States)
- Abbott Nutrition Manufacturing Inc. (United States)
- Fullwell Mill Ltd (United Kingdom)
- CHIMPANZEE NATURAL NUTRITION (Czech Republic)
- Haco Holding AG (Switzerland)
Key Industry Developments in the Organic Energy Bar Market
- In May 2023, General Mills, renowned for products like Cheerios and Nature Valley, made a significant move in the organic energy bar market by acquiring Clif Bar. This strategic acquisition, which values Clif Bar at approximately $2.5 billion, aims to solidify General Mills' presence in the increasingly popular healthy snack category.
- In January 2023, Bumble Bar, celebrated for its protein-rich, nut-butter-infused bars, unveiled an innovative range of plant-based protein bars. Utilizing pea protein and a variety of plant-derived ingredients, this new line is specifically designed to meet the increasing consumer preference for vegan and allergen-sensitive options.
|
Global Organic Energy Bar Market |
|||
|
Base Year: |
2022 |
Forecast Period: |
2023-2030 |
|
Historical Data: |
2017 to 2022 |
Market Size in 2022: |
USD 8.07 Bn. |
|
Forecast Period 2023-32 CAGR: |
4.46 % |
Market Size in 2032: |
USD 11.44 Bn. |
|
Segments Covered: |
By Type |
|
|
|
By Distribution Channel |
|
||
|
By End-User |
|
||
|
By Region |
|
||
|
Key Market Drivers: |
|
||
|
Key Market Restraints: |
|
||
|
Key Opportunities: |
|
||
|
Companies Covered in the report: |
|
||
- INTRODUCTION
- RESEARCH OBJECTIVES
- RESEARCH METHODOLOGY
- RESEARCH PROCESS
- SCOPE AND COVERAGE
- Market Definition
- Key Questions Answered
- MARKET SEGMENTATION
- EXECUTIVE SUMMARY
- MARKET OVERVIEW
- GROWTH OPPORTUNITIES BY SEGMENT
- MARKET LANDSCAPE
- PORTER’S FIVE FORCES ANALYSIS
- Bargaining Power Of Supplier
- Threat Of New Entrants
- Threat Of Substitutes
- Competitive Rivalry
- Bargaining Power Among Buyers
- INDUSTRY VALUE CHAIN ANALYSIS
- MARKET DYNAMICS
- Drivers
- Restraints
- Opportunities
- Challenges
- MARKET TREND ANALYSIS
- REGULATORY LANDSCAPE
- PESTLE ANALYSIS
- PRICE TREND ANALYSIS
- PATENT ANALYSIS
- TECHNOLOGY EVALUATION
- MARKET IMPACT OF THE RUSSIA-UKRAINE WAR
- Geopolitical Market Disruptions
- Supply Chain Disruptions
- Instability in Emerging Markets
- ECOSYSTEM
- PORTER’S FIVE FORCES ANALYSIS
- ORGANIC ENERGY BAR MARKET BY TYPE (2016-2030)
- ORGANIC ENERGY BAR MARKET SNAPSHOT AND GROWTH ENGINE
- MARKET OVERVIEW
- PROTEIN BAR
- Introduction And Market Overview
- Historic And Forecasted Market Size in Value (2016 – 2030F)
- Historic And Forecasted Market Size in Volume (2016 – 2030F)
- Key Market Trends, Growth Factors And Opportunities
- Geographic Segmentation Analysis
- NUTRITION BAR
- OTHERS
- ORGANIC ENERGY BAR MARKET BY DISTRIBUTION CHANNEL (2016-2030)
- ORGANIC ENERGY BAR MARKET SNAPSHOT AND GROWTH ENGINE
- MARKET OVERVIEW
- HYPERMARKET/SUPERMARKET
- Introduction And Market Overview
- Historic And Forecasted Market Size in Value (2016 – 2030F)
- Historic And Forecasted Market Size in Volume (2016 – 2030F)
- Key Market Trends, Growth Factors And Opportunities
- Geographic Segmentation Analysis
- SPECIALTY STORES
- ONLINE CHANNELS
- ORGANIC ENERGY BAR MARKET BY END-USER (2016-2030)
- ORGANIC ENERGY BAR MARKET SNAPSHOT AND GROWTH ENGINE
- MARKET OVERVIEW
- ADULTS
- Introduction And Market Overview
- Historic And Forecasted Market Size in Value (2016 – 2030F)
- Historic And Forecasted Market Size in Volume (2016 – 2030F)
- Key Market Trends, Growth Factors And Opportunities
- Geographic Segmentation Analysis
- KIDS
- COMPANY PROFILES AND COMPETITIVE ANALYSIS
- COMPETITIVE LANDSCAPE
- Competitive Positioning
- ORGANIC ENERGY BAR Market Share By Manufacturer (2022)
- Industry BCG Matrix
- Heat Map Analysis
- Mergers & Acquisitions
- CLIF BAR & COMPANY (UNITED STATES)
- Company Overview
- Key Executives
- Company Snapshot
- Role of the Company in the Market
- Sustainability and Social Responsibility
- Operating Business Segments
- Product Portfolio
- Business Performance (Production Volume, Sales Volume, Sales Margin, Production Capacity, Capacity Utilization Rate)
- Key Strategic Moves And Recent Developments
- SWOT Analysis
- GENERAL MILLS INC. (UNITED STATES)
- MEHRET BAR (UNITED STATES)
- TAOS MOUNTAIN ENERGY FOODS (UNITED STATES)
- BUMBLEBAR INC. (UNITED STATES)
- ATKINS NUTRITIONALS, INC. (UNITED STATES)
- QUEST NUTRITION LLC (UNITED STATES)
- MCKEE FOODS CORPORATION (UNITED STATES)
- KELLOGG COMPANY (UNITED STATES
- QUAKER OATS COMPANY (UNITED STATES)
- POWER BAR (UNITED STATES)
- ABBOTT NUTRITION MANUFACTURING INC. (UNITED STATES)
- FULLWELL MILL LTD (UNITED KINGDOM)
- CHIMPANZEE NATURAL NUTRITION (CZECH REPUBLIC)
- HACO HOLDING AG (SWITZERLAND)
- COMPETITIVE LANDSCAPE
- GLOBAL ORGANIC ENERGY BAR MARKET BY REGION
- OVERVIEW
- NORTH AMERICA
- Key Market Trends, Growth Factors And Opportunities
- Key Manufacturers
- Historic And Forecasted Market Size By TYPE
- Historic And Forecasted Market Size By DISTRIBUTION CHANNEL
- Historic And Forecasted Market Size By END-USER
- Historic And Forecasted Market Size By Country
- USA
- Canada
- Mexico
- EASTERN EUROPE
- Key Market Trends, Growth Factors And Opportunities
- Key Manufacturers
- Historic And Forecasted Market Size By Segments
- Historic And Forecasted Market Size By Country
- Russia
- Bulgaria
- The Czech Republic
- Hungary
- Poland
- Romania
- Rest Of Eastern Europe
- WESTERN EUROPE
- Key Market Trends, Growth Factors And Opportunities
- Key Manufacturers
- Historic And Forecasted Market Size By Segments
- Historic And Forecasted Market Size By Country
- Germany
- United Kingdom
- France
- The Netherlands
- Italy
- Spain
- Rest Of Western Europe
- ASIA PACIFIC
- Key Market Trends, Growth Factors And Opportunities
- Key Manufacturers
- Historic And Forecasted Market Size By Segments
- Historic And Forecasted Market Size By Country
- China
- India
- Japan
- South Korea
- Malaysia
- Thailand
- Vietnam
- The Philippines
- Australia
- New-Zealand
- Rest Of APAC
- MIDDLE EAST & AFRICA
- Key Market Trends, Growth Factors And Opportunities
- Key Manufacturers
- Historic And Forecasted Market Size By Segments
- Historic And Forecasted Market Size By Country
- Turkey
- Bahrain
- Kuwait
- Saudi Arabia
- Qatar
- UAE
- Israel
- South Africa
- SOUTH AMERICA
- Key Market Trends, Growth Factors And Opportunities
- Key Manufacturers
- Historic And Forecasted Market Size By Segments
- Historic And Forecasted Market Size By Country
- Brazil
- Argentina
- Rest of South America
- INVESTMENT ANALYSIS
- ANALYST VIEWPOINT AND CONCLUSION
- Recommendations and Concluding Analysis
- Potential Market Strategies
|
Global Organic Energy Bar Market |
|||
|
Base Year: |
2022 |
Forecast Period: |
2023-2030 |
|
Historical Data: |
2017 to 2022 |
Market Size in 2022: |
USD 8.07 Bn. |
|
Forecast Period 2023-32 CAGR: |
4.46 % |
Market Size in 2032: |
USD 11.44 Bn. |
|
Segments Covered: |
By Type |
|
|
|
By Distribution Channel |
|
||
|
By End-User |
|
||
|
By Region |
|
||
|
Key Market Drivers: |
|
||
|
Key Market Restraints: |
|
||
|
Key Opportunities: |
|
||
|
Companies Covered in the report: |
|
||
LIST OF TABLES
TABLE 001. EXECUTIVE SUMMARY
TABLE 002. ORGANIC ENERGY BAR MARKET BARGAINING POWER OF SUPPLIERS
TABLE 003. ORGANIC ENERGY BAR MARKET BARGAINING POWER OF CUSTOMERS
TABLE 004. ORGANIC ENERGY BAR MARKET COMPETITIVE RIVALRY
TABLE 005. ORGANIC ENERGY BAR MARKET THREAT OF NEW ENTRANTS
TABLE 006. ORGANIC ENERGY BAR MARKET THREAT OF SUBSTITUTES
TABLE 007. ORGANIC ENERGY BAR MARKET BY TYPE
TABLE 008. PROTEIN BAR MARKET OVERVIEW (2016-2028)
TABLE 009. NUTRITION BAR MARKET OVERVIEW (2016-2028)
TABLE 010. OTHERS MARKET OVERVIEW (2016-2028)
TABLE 011. ORGANIC ENERGY BAR MARKET BY DISTRIBUTION CHANNEL
TABLE 012. HYPERMARKET/SUPERMARKET MARKET OVERVIEW (2016-2028)
TABLE 013. SPECIALTY STORES MARKET OVERVIEW (2016-2028)
TABLE 014. ONLINE CHANNELS MARKET OVERVIEW (2016-2028)
TABLE 015. ORGANIC ENERGY BAR MARKET BY END-USER
TABLE 016. ADULTS MARKET OVERVIEW (2016-2028)
TABLE 017. KIDS MARKET OVERVIEW (2016-2028)
TABLE 018. NORTH AMERICA ORGANIC ENERGY BAR MARKET, BY TYPE (2016-2028)
TABLE 019. NORTH AMERICA ORGANIC ENERGY BAR MARKET, BY DISTRIBUTION CHANNEL (2016-2028)
TABLE 020. NORTH AMERICA ORGANIC ENERGY BAR MARKET, BY END-USER (2016-2028)
TABLE 021. N ORGANIC ENERGY BAR MARKET, BY COUNTRY (2016-2028)
TABLE 022. EUROPE ORGANIC ENERGY BAR MARKET, BY TYPE (2016-2028)
TABLE 023. EUROPE ORGANIC ENERGY BAR MARKET, BY DISTRIBUTION CHANNEL (2016-2028)
TABLE 024. EUROPE ORGANIC ENERGY BAR MARKET, BY END-USER (2016-2028)
TABLE 025. ORGANIC ENERGY BAR MARKET, BY COUNTRY (2016-2028)
TABLE 026. ASIA PACIFIC ORGANIC ENERGY BAR MARKET, BY TYPE (2016-2028)
TABLE 027. ASIA PACIFIC ORGANIC ENERGY BAR MARKET, BY DISTRIBUTION CHANNEL (2016-2028)
TABLE 028. ASIA PACIFIC ORGANIC ENERGY BAR MARKET, BY END-USER (2016-2028)
TABLE 029. ORGANIC ENERGY BAR MARKET, BY COUNTRY (2016-2028)
TABLE 030. MIDDLE EAST & AFRICA ORGANIC ENERGY BAR MARKET, BY TYPE (2016-2028)
TABLE 031. MIDDLE EAST & AFRICA ORGANIC ENERGY BAR MARKET, BY DISTRIBUTION CHANNEL (2016-2028)
TABLE 032. MIDDLE EAST & AFRICA ORGANIC ENERGY BAR MARKET, BY END-USER (2016-2028)
TABLE 033. ORGANIC ENERGY BAR MARKET, BY COUNTRY (2016-2028)
TABLE 034. SOUTH AMERICA ORGANIC ENERGY BAR MARKET, BY TYPE (2016-2028)
TABLE 035. SOUTH AMERICA ORGANIC ENERGY BAR MARKET, BY DISTRIBUTION CHANNEL (2016-2028)
TABLE 036. SOUTH AMERICA ORGANIC ENERGY BAR MARKET, BY END-USER (2016-2028)
TABLE 037. ORGANIC ENERGY BAR MARKET, BY COUNTRY (2016-2028)
TABLE 038. CLIF BAR & COMPANY: SNAPSHOT
TABLE 039. CLIF BAR & COMPANY: BUSINESS PERFORMANCE
TABLE 040. CLIF BAR & COMPANY: PRODUCT PORTFOLIO
TABLE 041. CLIF BAR & COMPANY: KEY STRATEGIC MOVES AND DEVELOPMENTS
TABLE 041. GENERAL MILLS INC.: SNAPSHOT
TABLE 042. GENERAL MILLS INC.: BUSINESS PERFORMANCE
TABLE 043. GENERAL MILLS INC.: PRODUCT PORTFOLIO
TABLE 044. GENERAL MILLS INC.: KEY STRATEGIC MOVES AND DEVELOPMENTS
TABLE 044. MEHRET BAR: SNAPSHOT
TABLE 045. MEHRET BAR: BUSINESS PERFORMANCE
TABLE 046. MEHRET BAR: PRODUCT PORTFOLIO
TABLE 047. MEHRET BAR: KEY STRATEGIC MOVES AND DEVELOPMENTS
TABLE 047. TAOS MOUNTAIN ENERGY FOODS: SNAPSHOT
TABLE 048. TAOS MOUNTAIN ENERGY FOODS: BUSINESS PERFORMANCE
TABLE 049. TAOS MOUNTAIN ENERGY FOODS: PRODUCT PORTFOLIO
TABLE 050. TAOS MOUNTAIN ENERGY FOODS: KEY STRATEGIC MOVES AND DEVELOPMENTS
TABLE 050. BUMBLEBAR INC.: SNAPSHOT
TABLE 051. BUMBLEBAR INC.: BUSINESS PERFORMANCE
TABLE 052. BUMBLEBAR INC.: PRODUCT PORTFOLIO
TABLE 053. BUMBLEBAR INC.: KEY STRATEGIC MOVES AND DEVELOPMENTS
TABLE 053. ATRIUM: SNAPSHOT
TABLE 054. ATRIUM: BUSINESS PERFORMANCE
TABLE 055. ATRIUM: PRODUCT PORTFOLIO
TABLE 056. ATRIUM: KEY STRATEGIC MOVES AND DEVELOPMENTS
TABLE 056. INNOVATIONSINC.: SNAPSHOT
TABLE 057. INNOVATIONSINC.: BUSINESS PERFORMANCE
TABLE 058. INNOVATIONSINC.: PRODUCT PORTFOLIO
TABLE 059. INNOVATIONSINC.: KEY STRATEGIC MOVES AND DEVELOPMENTS
TABLE 059. FULLWELL MILL LTD: SNAPSHOT
TABLE 060. FULLWELL MILL LTD: BUSINESS PERFORMANCE
TABLE 061. FULLWELL MILL LTD: PRODUCT PORTFOLIO
TABLE 062. FULLWELL MILL LTD: KEY STRATEGIC MOVES AND DEVELOPMENTS
TABLE 062. CHIMPANZEE NATURAL NUTRITION: SNAPSHOT
TABLE 063. CHIMPANZEE NATURAL NUTRITION: BUSINESS PERFORMANCE
TABLE 064. CHIMPANZEE NATURAL NUTRITION: PRODUCT PORTFOLIO
TABLE 065. CHIMPANZEE NATURAL NUTRITION: KEY STRATEGIC MOVES AND DEVELOPMENTS
TABLE 065. HACO HOLDING AG: SNAPSHOT
TABLE 066. HACO HOLDING AG: BUSINESS PERFORMANCE
TABLE 067. HACO HOLDING AG: PRODUCT PORTFOLIO
TABLE 068. HACO HOLDING AG: KEY STRATEGIC MOVES AND DEVELOPMENTS
TABLE 068. ATKINS NUTRITIONALS INC.: SNAPSHOT
TABLE 069. ATKINS NUTRITIONALS INC.: BUSINESS PERFORMANCE
TABLE 070. ATKINS NUTRITIONALS INC.: PRODUCT PORTFOLIO
TABLE 071. ATKINS NUTRITIONALS INC.: KEY STRATEGIC MOVES AND DEVELOPMENTS
TABLE 071. QUEST NUTRITION LLC: SNAPSHOT
TABLE 072. QUEST NUTRITION LLC: BUSINESS PERFORMANCE
TABLE 073. QUEST NUTRITION LLC: PRODUCT PORTFOLIO
TABLE 074. QUEST NUTRITION LLC: KEY STRATEGIC MOVES AND DEVELOPMENTS
TABLE 074. MCKEE FOODS CORPORATION: SNAPSHOT
TABLE 075. MCKEE FOODS CORPORATION: BUSINESS PERFORMANCE
TABLE 076. MCKEE FOODS CORPORATION: PRODUCT PORTFOLIO
TABLE 077. MCKEE FOODS CORPORATION: KEY STRATEGIC MOVES AND DEVELOPMENTS
TABLE 077. KELLOGG COMPANY: SNAPSHOT
TABLE 078. KELLOGG COMPANY: BUSINESS PERFORMANCE
TABLE 079. KELLOGG COMPANY: PRODUCT PORTFOLIO
TABLE 080. KELLOGG COMPANY: KEY STRATEGIC MOVES AND DEVELOPMENTS
TABLE 080. QUAKER OATS COMPANY: SNAPSHOT
TABLE 081. QUAKER OATS COMPANY: BUSINESS PERFORMANCE
TABLE 082. QUAKER OATS COMPANY: PRODUCT PORTFOLIO
TABLE 083. QUAKER OATS COMPANY: KEY STRATEGIC MOVES AND DEVELOPMENTS
TABLE 083. POWER BAR: SNAPSHOT
TABLE 084. POWER BAR: BUSINESS PERFORMANCE
TABLE 085. POWER BAR: PRODUCT PORTFOLIO
TABLE 086. POWER BAR: KEY STRATEGIC MOVES AND DEVELOPMENTS
TABLE 086. ABBOTT NUTRITION MANUFACTURING INC: SNAPSHOT
TABLE 087. ABBOTT NUTRITION MANUFACTURING INC: BUSINESS PERFORMANCE
TABLE 088. ABBOTT NUTRITION MANUFACTURING INC: PRODUCT PORTFOLIO
TABLE 089. ABBOTT NUTRITION MANUFACTURING INC: KEY STRATEGIC MOVES AND DEVELOPMENTS
TABLE 089. OTHER MAJOR PLAYERS: SNAPSHOT
TABLE 090. OTHER MAJOR PLAYERS: BUSINESS PERFORMANCE
TABLE 091. OTHER MAJOR PLAYERS: PRODUCT PORTFOLIO
TABLE 092. OTHER MAJOR PLAYERS: KEY STRATEGIC MOVES AND DEVELOPMENTS
LIST OF FIGURES
FIGURE 001. YEARS CONSIDERED FOR ANALYSIS
FIGURE 002. SCOPE OF THE STUDY
FIGURE 003. ORGANIC ENERGY BAR MARKET OVERVIEW BY REGIONS
FIGURE 004. PORTER'S FIVE FORCES ANALYSIS
FIGURE 005. BARGAINING POWER OF SUPPLIERS
FIGURE 006. COMPETITIVE RIVALRYFIGURE 007. THREAT OF NEW ENTRANTS
FIGURE 008. THREAT OF SUBSTITUTES
FIGURE 009. VALUE CHAIN ANALYSIS
FIGURE 010. PESTLE ANALYSIS
FIGURE 011. ORGANIC ENERGY BAR MARKET OVERVIEW BY TYPE
FIGURE 012. PROTEIN BAR MARKET OVERVIEW (2016-2028)
FIGURE 013. NUTRITION BAR MARKET OVERVIEW (2016-2028)
FIGURE 014. OTHERS MARKET OVERVIEW (2016-2028)
FIGURE 015. ORGANIC ENERGY BAR MARKET OVERVIEW BY DISTRIBUTION CHANNEL
FIGURE 016. HYPERMARKET/SUPERMARKET MARKET OVERVIEW (2016-2028)
FIGURE 017. SPECIALTY STORES MARKET OVERVIEW (2016-2028)
FIGURE 018. ONLINE CHANNELS MARKET OVERVIEW (2016-2028)
FIGURE 019. ORGANIC ENERGY BAR MARKET OVERVIEW BY END-USER
FIGURE 020. ADULTS MARKET OVERVIEW (2016-2028)
FIGURE 021. KIDS MARKET OVERVIEW (2016-2028)
FIGURE 022. NORTH AMERICA ORGANIC ENERGY BAR MARKET OVERVIEW BY COUNTRY (2016-2028)
FIGURE 023. EUROPE ORGANIC ENERGY BAR MARKET OVERVIEW BY COUNTRY (2016-2028)
FIGURE 024. ASIA PACIFIC ORGANIC ENERGY BAR MARKET OVERVIEW BY COUNTRY (2016-2028)
FIGURE 025. MIDDLE EAST & AFRICA ORGANIC ENERGY BAR MARKET OVERVIEW BY COUNTRY (2016-2028)
FIGURE 026. SOUTH AMERICA ORGANIC ENERGY BAR MARKET OVERVIEW BY COUNTRY (2016-2028)
Frequently Asked Questions :
The forecast period in the Organic Energy Bar Market research report is 2023-2030.
Clif Bar & Company (United States), General Mills Inc. (United States), Mehret Bar (United States), TAOS MOUNTAIN ENERGY FOODS (United States), BumbleBar Inc. (United States), Atkins Nutritionals, Inc. (United States), Quest Nutrition LLC (United States), McKee Foods Corporation (United States), Kellogg Company (United States), Quaker Oats Company (United States), Power Bar (United States), Abbott Nutrition Manufacturing Inc. (United States), Fullwell Mill Ltd (United Kingdom), CHIMPANZEE NATURAL NUTRITION (Czech Republic), Haco Holding AG (Switzerland), and Other Major Players.
The Organic Energy Bar Market is segmented into Type, Distribution Channel, Demography, and region. By Type, the market is categorized into Canned Protein Bars, Nutrition Bar, and Others. By Distribution Channel, the market is categorized into Supermarkets/ Hypermarkets, Convenience Stores, and Online Retailers. By region, it is analyzed across North America (U.S.; Canada; Mexico), Eastern Europe (Bulgaria; The Czech Republic; Hungary; Poland; Romania; Rest of Eastern Europe), Western Europe (Germany; UK; France; Netherlands; Italy; Russia; Spain; Rest of Western Europe), Asia-Pacific (China; India; Japan; Southeast Asia, etc.), South America (Brazil; Argentina, etc.), Middle East & Africa (Saudi Arabia; South Africa, etc.).
Organic Energy Bars are emerging as a popular snack option, especially among health-conscious consumers. These bars are typically made from a blend of natural ingredients like cereals, dry fruits, wheat, whey, oats, and nuts. They are designed to provide a quick energy boost while fulfilling the body's requirements for proteins, fats, and carbohydrates. The use of all-organic ingredients makes them highly appealing, particularly to the younger generation who are increasingly conscious about their food choices.
Organic Energy Bar Market Size Was Valued at USD 8.07 Billion in 2022 and is Projected to Reach USD 11.44 Billion by 2030, Growing at a CAGR of 4.46% From 2023-2030.


