


Nutritional Lipids Market Overview
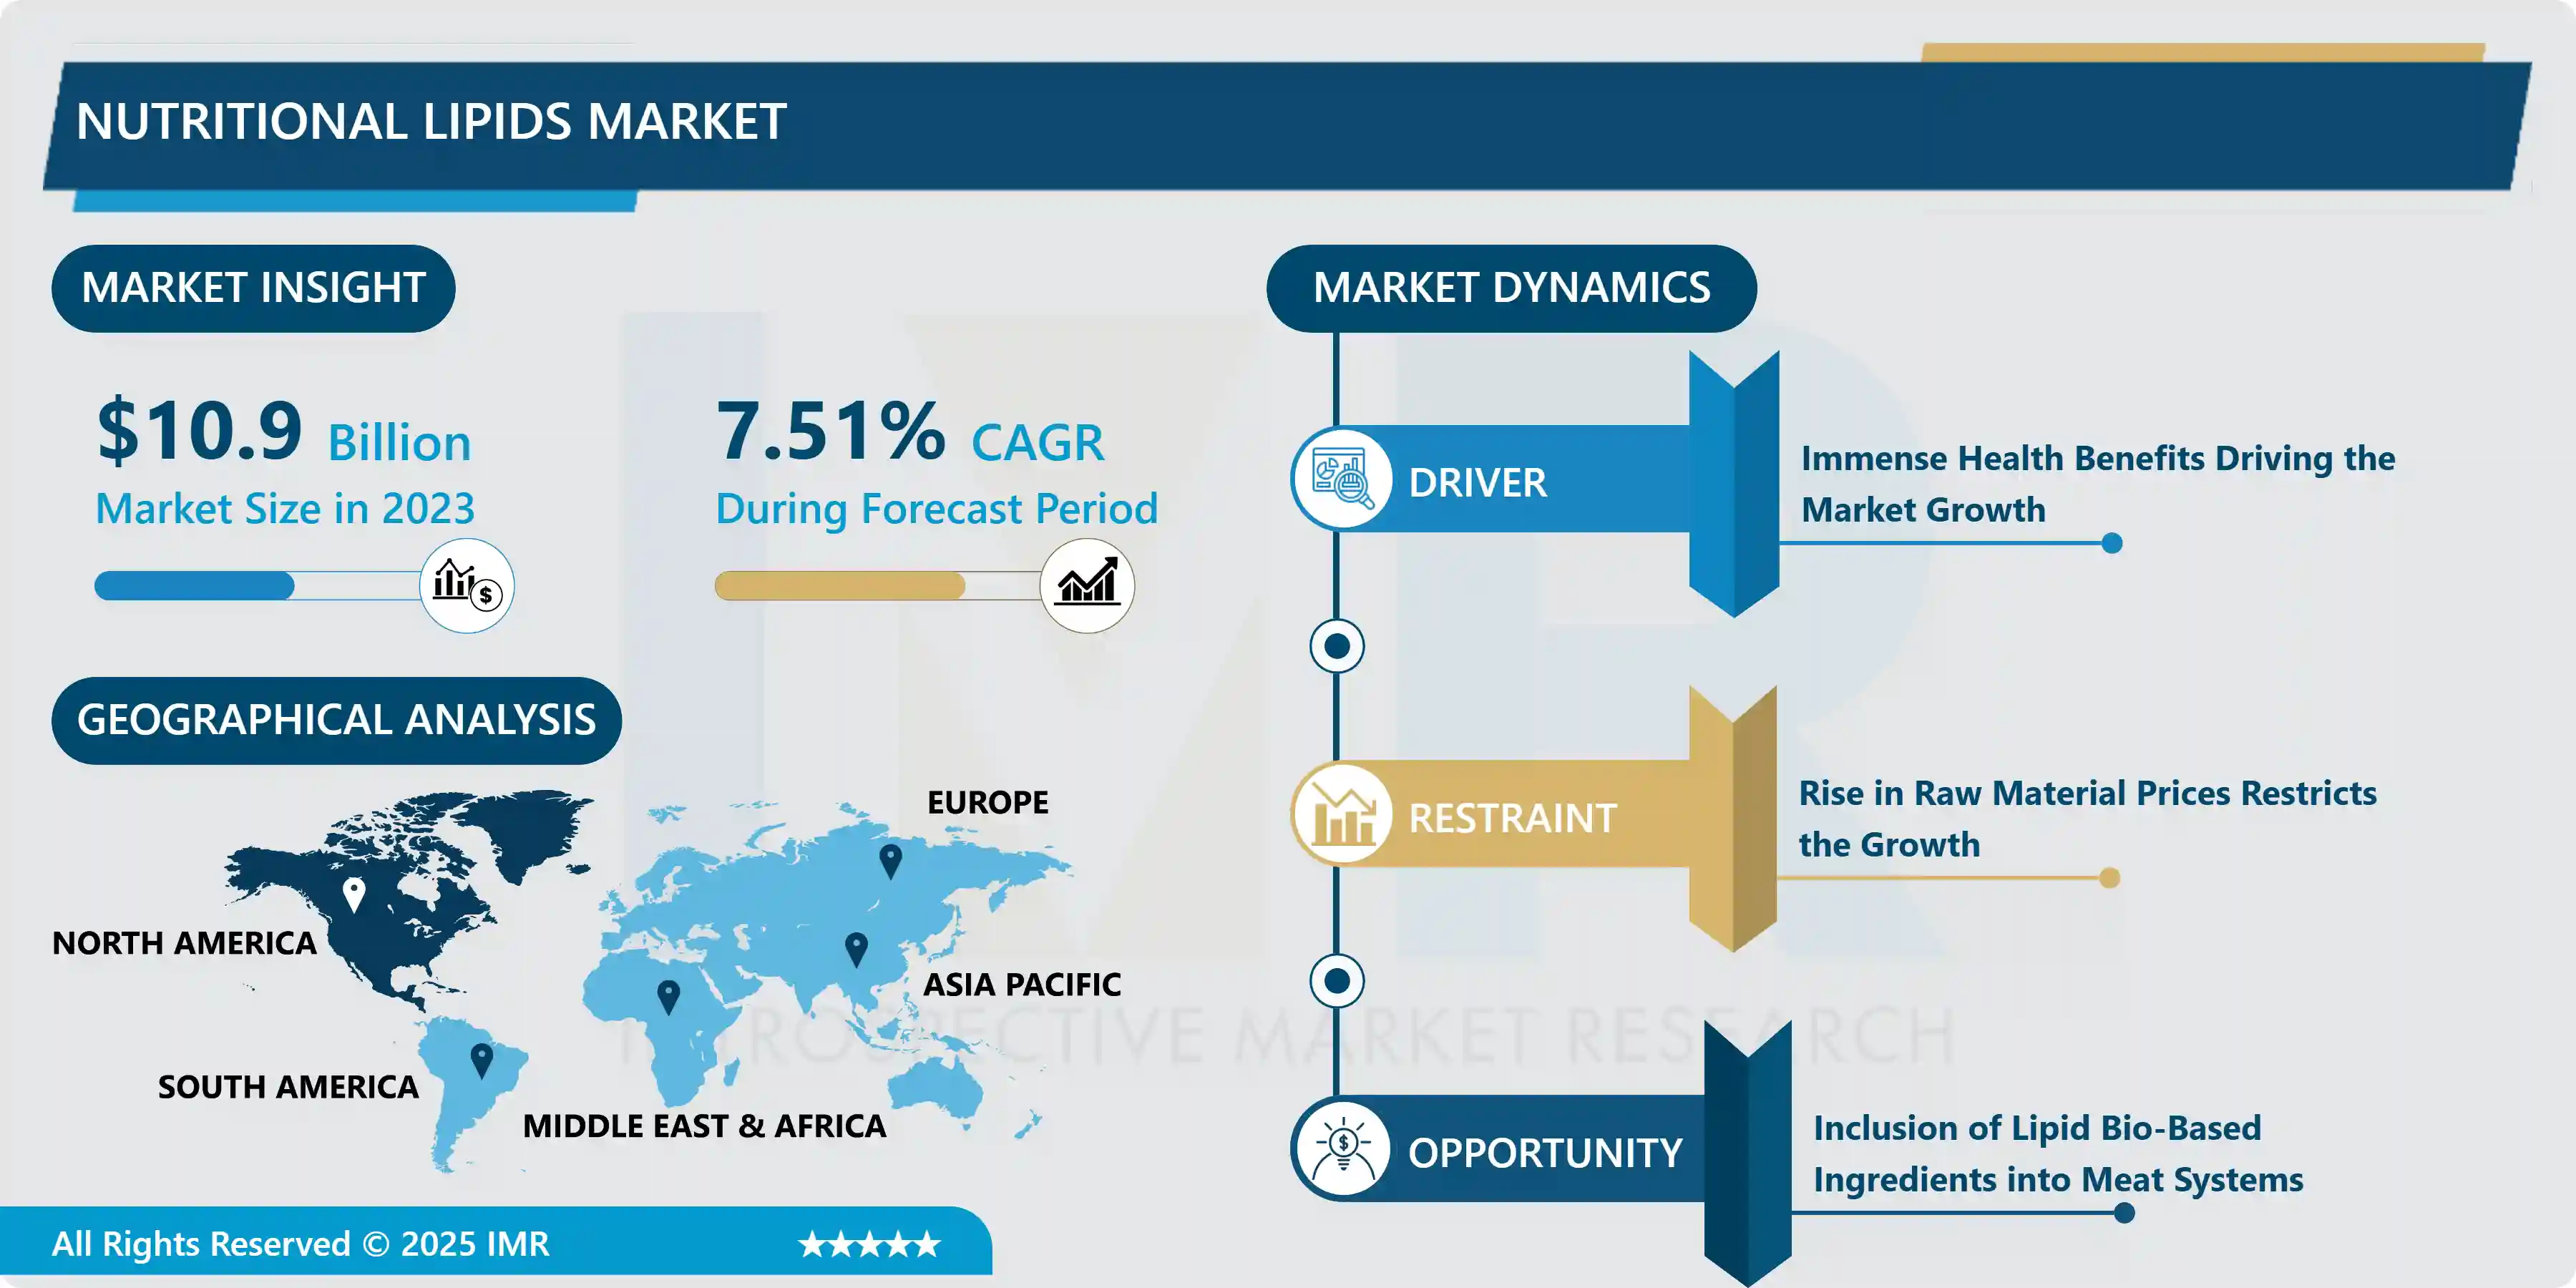
Nutritional Lipids Market was valued at USD 10.9 Billion in 2023 and is expected to reach USD 20.92 Billion by the year 2032, at a CAGR of 7.51 %.
Nutritional lipids, commonly known as healthy fats, are essential nutrients that supply energy-rich calories to the body. These lipids play a critical role in fulfilling the body's nutritional requirements, particularly for aging populations and individuals managing chronic conditions. Omega-3 and omega-6 fatty acids, vital components of nutritional lipids, cannot be synthesized by the human body, making dietary intake crucial. The market for nutritional lipids has seen substantial growth due to their inclusion in infant formulas, dietary supplements, and pharmaceutical products. Their health benefits include reducing inflammation, stabilizing heart rhythms, and lowering low-density lipoprotein levels, driving increased consumer awareness and adoption.
Despite their benefits, several challenges restrain the growth of the nutritional lipids market, including high production costs and limited public awareness about their advantages and proper usage. Nutritional lipids can be derived from plant and animal sources and are available in various types such as omega-3, omega-6, and medium-chain triglycerides (MCT). These lipids also support the absorption of fat-soluble vitamins like A, D, E, and K. As people increasingly prioritize wellness and balanced nutrition, the demand for these healthy fats continues to rise, positioning nutritional lipids as a vital component of modern dietary habits.

Market Dynamics and Factors for Nutritional Lipids Market
Drivers:
- Major factors that are anticipated to improve the growth of the lipid nutrition market in the forecast period are the growth in customer alertness about the health benefits of nutritional lipids and growing attention on the preventive healthcare, natural and safe nature of ingredients, and the growth in the cases of chronic diseases.
- Increasing demand for fortified food additives from infant formulas and dietary supplements owing to an extensive range of health benefits will turn the industry demand. The global food additives industry will generate about USD 55 billion in revenue by 2024. The market will observe a substantial expansion owing to rising demand for food & beverages with high nutritional content coupled with consumer preferences based on the factors such as taste, flavor, and color.
- Dietary supplements and fortified food products are mainly utilized to accomplish nutritional deficiencies and boost the immune system in the human body. After the COVID-19 pandemic, raising awareness as well as the necessity of immunity in the consumers to safeguard themselves from the virus has fueled the sales of such products. Nutritional lipids are also used to cater to the body with certain calories that are highly energy-rich. It also helps to minimize the inflammation and helps to stabilize the heartbeat. Due to this, its utilization on patients while recovering from COVID has also increased. This factor has increased the nutritional lipids demand as it is one of the main ingredients in dietary supplements & nutraceuticals, fortified food products, infant formula, and pharmaceuticals.
Restraints:
- Nutritional lipids market price trend is mainly affected by rising raw material prices including fish oil and flaxseed oil. Diminishing fish oil production owing to fishery sustainability issues may restrain the supply and demand scenario. Strict regulations ruled by the FDA particularly on Antarctic krill & fish oil along with easy accessibility of substitute products are major factors hindering industry demand.
Opportunities:
Inclusion of Lipid Bio-Based Ingredients into Meat Systems
- The inclusion of lipid bio-based ingredients in meat products is difficult to achieve without negatively influencing technological and/or sensory properties. Nevertheless, and despite being a great challenge for the meat industry, it should be the subject of in-depth studies in the future owing to the great importance for (and opportunity to boost) consumer health within the current lifestyle restraints of most consumers. The use of different strategies to enhance the nutritional quality of traditional meat products presents an opportunity (and a challenge) for the meat industry in upcoming years.
Market Segmentation
Global Lipid Nutrition (Nutritional Lipids) Market Research report comprises of Porter's five forces analysis to do the detail study about its each segmentation like Product segmentation, End user/application segment analysis and Major key players analysis mentioned as below;
Segmentation Insights for Nutritional Lipids Market:
- Based on the Product Type, the omega-3 segment accounted for the largest market share during the forecast period. Growing consumer consciousness related to the preventive medical products and health benefits of omega-3 is among key factors turning the lipid nutrition demand. Improving eye and brain health along with prevention from depression and heart diseases are key properties boosting product scope in pharmaceutical and food fortification applications.
- Based on Source, animal source dominates the market over the forecast period. Growing demand for omega-3 and other fish oil-based products owing to high EPA and DHA content has improved the industry demand. According to research analysis, omega-3 content in fish oil registered for 100%, as long as plant sources register for less than 10%. Furthermore, the comparatively enriched absorption rate in humans along with non-GMO properties provide a positive outlook for industry expansion.
- Based on Form, liquid form accounted for the largest market share over the forecast period. Increasing incorporation of soft gels for supplement dosage owing to ease in utilization is among the main factor turning the industry growth. Effective functionality and a high incorporation rate further create lucrative opportunities for product demand.
- Based on Application, dietary supplements segments dominate the market over the forecast period. Switching trend towards healthy lifestyles to avoid healthcare expenses is among the key factor accelerating the industry landscape. Additionally, growing pollution levels have improved the necessity for supplements to extend a healthy life period. Innovations in encapsulation technologies along with the growth of soft gels are the major aiding factors of the product demand.
Regional Analysis Of Nutritional Lipids Market:
- Asia-Pacific nutritional lipids market accounted for the largest share in the market during the forecast period due to rise in pharmaceutical and dietary supplement industry particularly in China and India are among key factors turning the industry demand. Growing nutrition concerns in infants and women have further boosted the regional demand. Favorable socioeconomic factors along with foreign direct investments liberalization will help the business scenario.
- North America region is witnessed a significant growth rate due to the rising prevalence of obesity & diabetes resulting in the necessity for a nutritious diet that will hasten the product demand. Extension in the functional food & beverages industry accompanied by glowing regulations for dietary supplements will turn the regional demand.
Competitive Landscape and Nutritional Lipids Market Share Analysis
Global Lipid Nutrition (Nutritional Lipids) Market Research report comprises of Porter's five forces analysis to do the detail study about its each segmentation like Product segmentation, End user/application segment analysis and Major key players analysis mentioned as below;
Players Covered in Nutritional Lipids Market are:
- Nestle
- BASF SE
- Smit & zoon
- DSM
- Nordic Naturals
- Omega Protein Corporation
- Croda International Plc
- FMC Corporation
- ADM
- Neptune Wellness Solns
- Clover Corporation
- Polaris Nutritional Lipids
- Kerry
- Friesland Campina
- Stepan Company
- SOLUTES
- Polaris Consulting & Services Limited
- Lonza, Cellana Inc.
- Pharma Marine AS
- Others Major Players.
Key Industry Developments
-
In October 2024, KD Pharma Group, a global leader in pharmaceutical and nutritional lipids, successfully finalized the acquisition of dsm-firmenich’s Marine Lipids business. Announced in July, the deal concluded after securing all necessary customer regulatory approvals. The acquisition reinforced KD Pharma's position as a premier CDMO, expanding its expertise and capabilities in the marine lipids sector. dsm-firmenich, renowned for its innovation in nutrition, health, and beauty, transitioned the business to KD Pharma as part of its strategic focus. The successful closure of this transaction marked a significant milestone for both companies in their respective growth trajectories.
-
In June 2023, Nordic Naturals partnered with Walmart to expand the reach of its omega-3 products, making them available in thousands of stores across the U.S. This strategic collaboration aimed to improve consumer access to high-quality nutritional supplements. The partnership featured three flagship products: Omega-3 softgels, Ultimate Omega, and Algae Omega, catering to heart, brain, and immune health needs. The inclusion of Algae Omega provided a sustainable, plant-based option for vegetarian and vegan consumers. By leveraging Walmart’s widespread retail network, Nordic Naturals enhanced its mission of improving global health through increased omega-3 consumption and accessibility.
|
Nutritional Lipids Market |
|||
|
Base Year: |
2023 |
Forecast Period: |
2024-2032 |
|
Historical Data: |
2017 to 2023 |
Market Size in 2023: |
USD 10.9 Bn. |
|
Forecast Period 2024-32 CAGR: |
7.51 % |
Market Size in 2032: |
USD 20.92 Bn. |
|
Segments Covered: |
By Product Type |
|
|
|
By Source |
|
||
|
By Form |
|
||
|
By Application |
|
||
|
By Region |
|
||
|
Key Market Drivers: |
|
||
|
Key Market Restraints: |
|
||
|
Key Opportunities: |
|
||
|
Companies Covered in the report: |
|
||
Chapter 1: Introduction
1.1 Scope and Coverage
Chapter 2:Executive Summary
Chapter 3: Market Landscape
3.1 Market Dynamics
3.1.1 Drivers
3.1.2 Restraints
3.1.3 Opportunities
3.1.4 Challenges
3.2 Market Trend Analysis
3.3 PESTLE Analysis
3.4 Porter's Five Forces Analysis
3.5 Industry Value Chain Analysis
3.6 Ecosystem
3.7 Regulatory Landscape
3.8 Price Trend Analysis
3.9 Patent Analysis
3.10 Technology Evolution
3.11 Investment Pockets
3.12 Import-Export Analysis
Chapter 4: Nutritional Lipids Market by Product Type (2018-2032)
4.1 Nutritional Lipids Market Snapshot and Growth Engine
4.2 Market Overview
4.3 Omega-3
4.3.1 Introduction and Market Overview
4.3.2 Historic and Forecasted Market Size in Value USD and Volume Units
4.3.3 Key Market Trends, Growth Factors, and Opportunities
4.3.4 Geographic Segmentation Analysis
4.4 Medium Chain Triglycerides
4.5 Omega-6
4.6 Others
Chapter 5: Nutritional Lipids Market by Source (2018-2032)
5.1 Nutritional Lipids Market Snapshot and Growth Engine
5.2 Market Overview
5.3 Animal
5.3.1 Introduction and Market Overview
5.3.2 Historic and Forecasted Market Size in Value USD and Volume Units
5.3.3 Key Market Trends, Growth Factors, and Opportunities
5.3.4 Geographic Segmentation Analysis
5.4 Plant
Chapter 6: Nutritional Lipids Market by Form (2018-2032)
6.1 Nutritional Lipids Market Snapshot and Growth Engine
6.2 Market Overview
6.3 Powder
6.3.1 Introduction and Market Overview
6.3.2 Historic and Forecasted Market Size in Value USD and Volume Units
6.3.3 Key Market Trends, Growth Factors, and Opportunities
6.3.4 Geographic Segmentation Analysis
6.4 Liquid
Chapter 7: Nutritional Lipids Market by Application (2018-2032)
7.1 Nutritional Lipids Market Snapshot and Growth Engine
7.2 Market Overview
7.3 Dietary Supplements
7.3.1 Introduction and Market Overview
7.3.2 Historic and Forecasted Market Size in Value USD and Volume Units
7.3.3 Key Market Trends, Growth Factors, and Opportunities
7.3.4 Geographic Segmentation Analysis
7.4 Infant Formula
7.5 Pharmaceuticals
7.6 Food and Beverages
7.7 Animal Feed
7.8 Others
Chapter 8: Company Profiles and Competitive Analysis
8.1 Competitive Landscape
8.1.1 Competitive Benchmarking
8.1.2 Nutritional Lipids Market Share by Manufacturer (2024)
8.1.3 Industry BCG Matrix
8.1.4 Heat Map Analysis
8.1.5 Mergers and Acquisitions
8.2 PFIZER (UNITED STATES)
8.2.1 Company Overview
8.2.2 Key Executives
8.2.3 Company Snapshot
8.2.4 Role of the Company in the Market
8.2.5 Sustainability and Social Responsibility
8.2.6 Operating Business Segments
8.2.7 Product Portfolio
8.2.8 Business Performance
8.2.9 Key Strategic Moves and Recent Developments
8.2.10 SWOT Analysis
8.3 MERCK (UNITED STATES)
8.4 ABBOTT (UNITED STATES)
8.5 DYNAVAX TECHNOLOGIES (UNITED STATES)
8.6 EMERGENT BIOSOLUTIONS INC. (UNITED STATES)
8.7 BHARAT BIOTECH (INDIA)
8.8 ALTIMMUNE INC. (UNITED STATES)
8.9 VALEANT PHARMACEUTICALS (CANADA)
8.10 SANOFI(FRANCE)
8.11 GLAXOSMITHKLINE (UNITED KINGDOM)
8.12 ASTRAZENECA (UNITED KINGDOM)
8.13 JANSSEN PHARMACEUTICALS (BELGIUM)
8.14 ROCHE (SWITZERLAND)
8.15 LUPIN (INDIA)
8.16 MITSUBISHI TANABE PHARMA (JAPAN)
8.17 LG LIFE SCIENCES / LG CHEM LTD. (SOUTH KOREA)
8.18 NOVARTIS AG (SWITZERLAND)
8.19 VALNEVA SE (FRANCE)
8.20 GLYCOVAXYN (SWITZERLAND)
8.21 TAKEDA PHARMACEUTICAL (JAPAN)
8.22 SK CHEMICALS (SOUTH KOREA)
8.23 HUALAN BIOLOGICAL ENGINEERING (CHINA)
8.24 INDIAN IMMUNOLOGICALS (INDIA)
8.25 BEIJING MINHAI BIOTECHNOLOGY (CHINA)
8.26 CSL LTD. (AUSTRALIA)
Chapter 9: Global Nutritional Lipids Market By Region
9.1 Overview
9.2. North America Nutritional Lipids Market
9.2.1 Key Market Trends, Growth Factors and Opportunities
9.2.2 Top Key Companies
9.2.3 Historic and Forecasted Market Size by Segments
9.2.4 Historic and Forecasted Market Size by Product Type
9.2.4.1 Omega-3
9.2.4.2 Medium Chain Triglycerides
9.2.4.3 Omega-6
9.2.4.4 Others
9.2.5 Historic and Forecasted Market Size by Source
9.2.5.1 Animal
9.2.5.2 Plant
9.2.6 Historic and Forecasted Market Size by Form
9.2.6.1 Powder
9.2.6.2 Liquid
9.2.7 Historic and Forecasted Market Size by Application
9.2.7.1 Dietary Supplements
9.2.7.2 Infant Formula
9.2.7.3 Pharmaceuticals
9.2.7.4 Food and Beverages
9.2.7.5 Animal Feed
9.2.7.6 Others
9.2.8 Historic and Forecast Market Size by Country
9.2.8.1 US
9.2.8.2 Canada
9.2.8.3 Mexico
9.3. Eastern Europe Nutritional Lipids Market
9.3.1 Key Market Trends, Growth Factors and Opportunities
9.3.2 Top Key Companies
9.3.3 Historic and Forecasted Market Size by Segments
9.3.4 Historic and Forecasted Market Size by Product Type
9.3.4.1 Omega-3
9.3.4.2 Medium Chain Triglycerides
9.3.4.3 Omega-6
9.3.4.4 Others
9.3.5 Historic and Forecasted Market Size by Source
9.3.5.1 Animal
9.3.5.2 Plant
9.3.6 Historic and Forecasted Market Size by Form
9.3.6.1 Powder
9.3.6.2 Liquid
9.3.7 Historic and Forecasted Market Size by Application
9.3.7.1 Dietary Supplements
9.3.7.2 Infant Formula
9.3.7.3 Pharmaceuticals
9.3.7.4 Food and Beverages
9.3.7.5 Animal Feed
9.3.7.6 Others
9.3.8 Historic and Forecast Market Size by Country
9.3.8.1 Russia
9.3.8.2 Bulgaria
9.3.8.3 The Czech Republic
9.3.8.4 Hungary
9.3.8.5 Poland
9.3.8.6 Romania
9.3.8.7 Rest of Eastern Europe
9.4. Western Europe Nutritional Lipids Market
9.4.1 Key Market Trends, Growth Factors and Opportunities
9.4.2 Top Key Companies
9.4.3 Historic and Forecasted Market Size by Segments
9.4.4 Historic and Forecasted Market Size by Product Type
9.4.4.1 Omega-3
9.4.4.2 Medium Chain Triglycerides
9.4.4.3 Omega-6
9.4.4.4 Others
9.4.5 Historic and Forecasted Market Size by Source
9.4.5.1 Animal
9.4.5.2 Plant
9.4.6 Historic and Forecasted Market Size by Form
9.4.6.1 Powder
9.4.6.2 Liquid
9.4.7 Historic and Forecasted Market Size by Application
9.4.7.1 Dietary Supplements
9.4.7.2 Infant Formula
9.4.7.3 Pharmaceuticals
9.4.7.4 Food and Beverages
9.4.7.5 Animal Feed
9.4.7.6 Others
9.4.8 Historic and Forecast Market Size by Country
9.4.8.1 Germany
9.4.8.2 UK
9.4.8.3 France
9.4.8.4 The Netherlands
9.4.8.5 Italy
9.4.8.6 Spain
9.4.8.7 Rest of Western Europe
9.5. Asia Pacific Nutritional Lipids Market
9.5.1 Key Market Trends, Growth Factors and Opportunities
9.5.2 Top Key Companies
9.5.3 Historic and Forecasted Market Size by Segments
9.5.4 Historic and Forecasted Market Size by Product Type
9.5.4.1 Omega-3
9.5.4.2 Medium Chain Triglycerides
9.5.4.3 Omega-6
9.5.4.4 Others
9.5.5 Historic and Forecasted Market Size by Source
9.5.5.1 Animal
9.5.5.2 Plant
9.5.6 Historic and Forecasted Market Size by Form
9.5.6.1 Powder
9.5.6.2 Liquid
9.5.7 Historic and Forecasted Market Size by Application
9.5.7.1 Dietary Supplements
9.5.7.2 Infant Formula
9.5.7.3 Pharmaceuticals
9.5.7.4 Food and Beverages
9.5.7.5 Animal Feed
9.5.7.6 Others
9.5.8 Historic and Forecast Market Size by Country
9.5.8.1 China
9.5.8.2 India
9.5.8.3 Japan
9.5.8.4 South Korea
9.5.8.5 Malaysia
9.5.8.6 Thailand
9.5.8.7 Vietnam
9.5.8.8 The Philippines
9.5.8.9 Australia
9.5.8.10 New Zealand
9.5.8.11 Rest of APAC
9.6. Middle East & Africa Nutritional Lipids Market
9.6.1 Key Market Trends, Growth Factors and Opportunities
9.6.2 Top Key Companies
9.6.3 Historic and Forecasted Market Size by Segments
9.6.4 Historic and Forecasted Market Size by Product Type
9.6.4.1 Omega-3
9.6.4.2 Medium Chain Triglycerides
9.6.4.3 Omega-6
9.6.4.4 Others
9.6.5 Historic and Forecasted Market Size by Source
9.6.5.1 Animal
9.6.5.2 Plant
9.6.6 Historic and Forecasted Market Size by Form
9.6.6.1 Powder
9.6.6.2 Liquid
9.6.7 Historic and Forecasted Market Size by Application
9.6.7.1 Dietary Supplements
9.6.7.2 Infant Formula
9.6.7.3 Pharmaceuticals
9.6.7.4 Food and Beverages
9.6.7.5 Animal Feed
9.6.7.6 Others
9.6.8 Historic and Forecast Market Size by Country
9.6.8.1 Turkiye
9.6.8.2 Bahrain
9.6.8.3 Kuwait
9.6.8.4 Saudi Arabia
9.6.8.5 Qatar
9.6.8.6 UAE
9.6.8.7 Israel
9.6.8.8 South Africa
9.7. South America Nutritional Lipids Market
9.7.1 Key Market Trends, Growth Factors and Opportunities
9.7.2 Top Key Companies
9.7.3 Historic and Forecasted Market Size by Segments
9.7.4 Historic and Forecasted Market Size by Product Type
9.7.4.1 Omega-3
9.7.4.2 Medium Chain Triglycerides
9.7.4.3 Omega-6
9.7.4.4 Others
9.7.5 Historic and Forecasted Market Size by Source
9.7.5.1 Animal
9.7.5.2 Plant
9.7.6 Historic and Forecasted Market Size by Form
9.7.6.1 Powder
9.7.6.2 Liquid
9.7.7 Historic and Forecasted Market Size by Application
9.7.7.1 Dietary Supplements
9.7.7.2 Infant Formula
9.7.7.3 Pharmaceuticals
9.7.7.4 Food and Beverages
9.7.7.5 Animal Feed
9.7.7.6 Others
9.7.8 Historic and Forecast Market Size by Country
9.7.8.1 Brazil
9.7.8.2 Argentina
9.7.8.3 Rest of SA
Chapter 10 Analyst Viewpoint and Conclusion
10.1 Recommendations and Concluding Analysis
10.2 Potential Market Strategies
Chapter 11 Research Methodology
11.1 Research Process
11.2 Primary Research
11.3 Secondary Research
|
Nutritional Lipids Market |
|||
|
Base Year: |
2023 |
Forecast Period: |
2024-2032 |
|
Historical Data: |
2017 to 2023 |
Market Size in 2023: |
USD 10.9 Bn. |
|
Forecast Period 2024-32 CAGR: |
7.51 % |
Market Size in 2032: |
USD 20.92 Bn. |
|
Segments Covered: |
By Product Type |
|
|
|
By Source |
|
||
|
By Form |
|
||
|
By Application |
|
||
|
By Region |
|
||
|
Key Market Drivers: |
|
||
|
Key Market Restraints: |
|
||
|
Key Opportunities: |
|
||
|
Companies Covered in the report: |
|
||


