


Numerical Analysis Software Market Synopsis
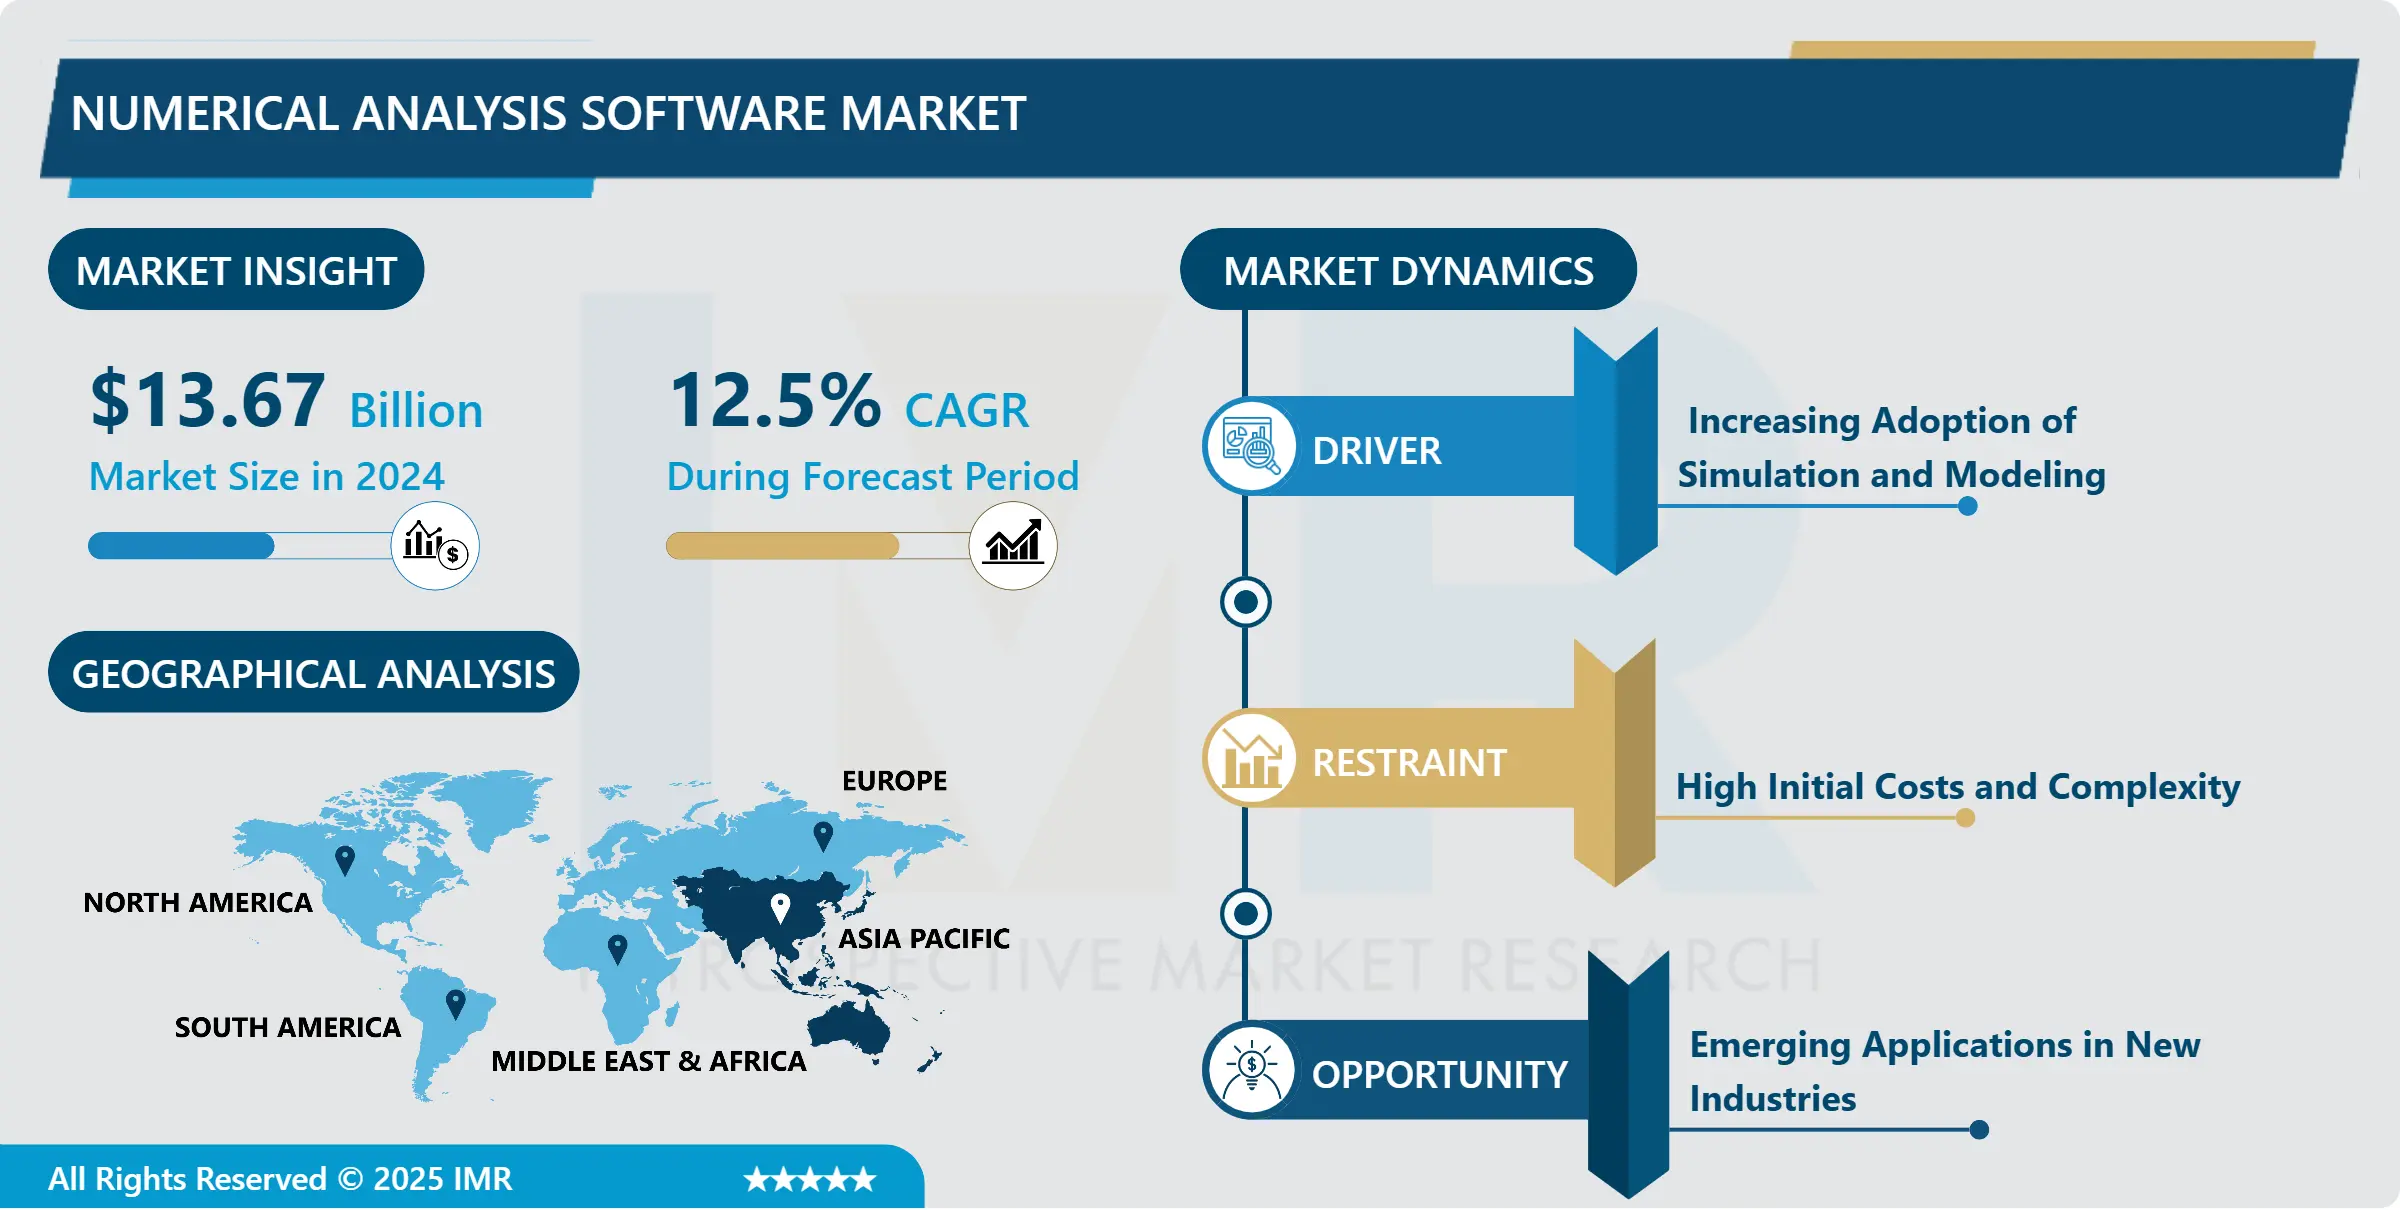
Numerical Analysis Software Market Size Was Valued at USD 13.67 Billion in 2024 and is Projected to Reach USD 35.07 Million by 2032, Growing at a CAGR of 12.5% From 2025-2032.
The Numerical Analysis Software Market refers to the sector encompassing software solutions designed to perform numerical computations and analyses across various fields such as engineering, science, finance, and research. These software tools facilitate complex mathematical modeling, simulations, and data analysis, utilizing algorithms and numerical methods to solve equations, optimize processes, and visualize results. Numerical analysis software often includes functionalities like linear algebra, differential equations solving, statistical analysis, and data visualization, catering to diverse industries and research domains. The market is characterized by a range of offerings from commercial vendors, open-source communities, and specialized niche providers, serving the evolving needs of professionals, researchers, and organizations seeking accurate and efficient numerical solutions for their computational challenges.
The Numerical Analysis Software Market continues to witness robust growth driven by advancements in technology and the increasing demand for efficient computational tools across various industries. With the proliferation of data and the complexity of mathematical models, there's a growing need for sophisticated numerical analysis software to handle large datasets and perform complex calculations with precision and speed.
Key players in the market are focusing on innovation and product development to stay competitive and cater to evolving customer requirements. Additionally, the adoption of cloud-based solutions and the integration of artificial intelligence and machine learning algorithms are reshaping the landscape, offering enhanced functionalities and scalability.
Moreover, the rising emphasis on data-driven decision-making across sectors such as finance, engineering, healthcare, and research further propels the demand for advanced numerical analysis software.
Geographically, North America and Europe dominate the market due to the presence of major players and the early adoption of technology, while Asia Pacific presents significant growth opportunities driven by rapid industrialization and increasing investments in research and development. However, challenges such as data security concerns and the complexity of implementing these solutions hinder market growth to some extent.
Overall, the Numerical Analysis Software Market is poised for steady expansion as organizations seek to leverage advanced computational tools to gain insights, optimize processes, and drive innovation.
Numerical Analysis Software Market Trend Analysis
Transforming Computational Capabilities
- The surge in demand for cloud-based numerical analysis solutions reflects a fundamental shift in how organizations approach computational tasks. With the exponential growth of data and the escalating complexity of simulations and analyses, traditional on-premises infrastructure often falls short in meeting the evolving computational demands. Cloud-based solutions offer a compelling alternative by providing access to virtually unlimited computational resources on a pay-as-you-go basis. This scalability not only alleviates the burden of managing and maintaining costly hardware but also enables organizations to dynamically scale their computational capacity in response to fluctuating workloads. Additionally, cloud-based platforms facilitate seamless collaboration among geographically dispersed teams, allowing researchers and engineers to share data, models, and results in real-time, thereby fostering innovation and accelerating time-to-insight.
- Furthermore, the adoption of cloud-based numerical analysis solutions is driven by the imperative for agility and flexibility in today's fast-paced business environment. With cloud computing, organizations can rapidly deploy and configure computational resources without the constraints of physical infrastructure, enabling them to adapt quickly to changing market dynamics and emerging opportunities. Moreover, cloud-based platforms offer advanced capabilities such as auto-scaling, which automatically adjusts resource allocation based on workload demand, ensuring optimal performance and cost-efficiency. By leveraging cloud-based numerical analysis solutions, companies and research institutions can focus their resources on innovation and problem-solving rather than infrastructure management, thereby gaining a competitive edge in their respective fields while also embracing the scalability and flexibility demanded by modern computational challenges.
Enhancing Numerical Analysis Software Capabilities
- The integration of artificial intelligence (AI) and machine learning (ML) capabilities into numerical analysis software represents a significant advancement that is revolutionizing how data is analyzed and insights are derived. By leveraging AI and ML algorithms, numerical analysis software can unlock deeper insights from complex datasets, enabling more accurate predictive modeling and simulation. These algorithms have the capability to identify patterns, trends, and relationships within numerical data that may not be readily apparent to human analysts. As a result, users can make more informed decisions based on the insights generated by these advanced analytics techniques, leading to enhanced efficiency and effectiveness across a wide range of applications, from engineering design and optimization to financial forecasting and risk management.
- Moreover, the integration of AI and ML into numerical analysis software is driving innovation by automating repetitive tasks and streamlining workflows. Tasks that were once labor-intensive and time-consuming, such as data preprocessing, model parameter tuning, and result interpretation, can now be automated using AI-powered algorithms, freeing up valuable time for researchers and engineers to focus on higher-level analysis and problem-solving. Additionally, AI-driven optimization algorithms can help users identify the most promising design configurations or parameter settings, leading to more efficient and effective solutions. By harnessing the power of AI and ML, numerical analysis software is empowering users to extract actionable insights from their data more efficiently, driving innovation and enabling organizations to stay ahead in today's rapidly evolving competitive landscape.
Numerical Analysis Software Market Segment Analysis:
Numerical Analysis Software Market Segmented based on Type, Applications and Region
By Type, desktop-based software segment is expected to dominate the market during the forecast period
- In the domain of desktop-based software, applications tailored for engineering and scientific research stand out as the dominant share, significantly influencing how professionals in these fields operate. These software packages are meticulously crafted to address the complex and nuanced demands inherent in engineering and scientific endeavors. For engineering professionals, these applications serve as indispensable tools, providing a comprehensive suite of features for tasks ranging from conceptual design to intricate simulations. Whether it's civil engineers designing infrastructure, mechanical engineers optimizing machine components, or electrical engineers developing circuitry, desktop-based software offers specialized functionalities to streamline workflows and ensure precision in every stage of the project lifecycle. Similarly, in scientific research, desktop-based software plays a pivotal role in enabling researchers to analyze vast datasets, visualize complex phenomena, and simulate intricate systems. From molecular modeling in chemistry to computational fluid dynamics in physics, these applications empower scientists to explore hypotheses, validate theories, and push the boundaries of knowledge. The dominance of desktop-based software in these domains is underscored by its ability to deliver offline accessibility, robust features, and unmatched performance, catering to the specialized needs of engineering and scientific professionals with unparalleled efficiency and reliability.
- Moreover, the dominance of desktop-based software in engineering and scientific research is further cemented by its capacity to provide tailored solutions that align closely with the unique requirements of these industries. Unlike web-based alternatives, desktop-based applications offer a level of customization and control that is essential for addressing the diverse and intricate challenges faced by engineering and scientific professionals. Whether it's the need for high-fidelity simulations, seamless integration with specialized hardware, or stringent data privacy and security protocols, desktop-based software excels in meeting these demands with precision and reliability. Furthermore, the extensive feature sets offered by desktop-based applications surpass those of their web-based counterparts, providing users with a comprehensive toolkit to tackle multifaceted tasks effectively. This superiority in functionality and performance solidifies the position of desktop-based software as the dominant choice for engineering and scientific endeavors, serving as indispensable tools that empower professionals to innovate, analyze, and solve complex problems with unparalleled efficiency and accuracy.
By Applications, Financial Analysis segment held the largest share in 2024
- Financial analysis occupies a preeminent position in the contemporary economic landscape, wielding significant influence across diverse sectors. Its pivotal role stems from its capacity to provide invaluable insights into market trends, risks, and opportunities, thereby empowering stakeholders to make informed decisions. In investment banking, financial analysts play a crucial role in evaluating potential mergers and acquisitions, assessing market conditions, and structuring complex financial transactions. Their adeptness in analyzing financial data and leveraging advanced quantitative techniques enables them to mitigate risks and optimize returns for their clients. Similarly, in corporate finance, financial analysis guides strategic decision-making processes, ranging from capital budgeting to resource allocation. By employing sophisticated models and analytical tools, financial analysts facilitate the identification of growth opportunities, cost-saving measures, and optimal capital structures, thereby enhancing the overall efficiency and profitability of businesses. Moreover, in the realm of risk management, financial analysis serves as a linchpin for identifying, assessing, and mitigating various forms of financial risks, including market risk, credit risk, and operational risk. Through the application of statistical methods, scenario analysis, and stress testing, financial analysts help organizations safeguard their financial health and resilience in the face of uncertain market conditions.
- Furthermore, the advent of technology has revolutionized the landscape of financial analysis, ushering in an era of unprecedented innovation and efficiency. The integration of artificial intelligence, machine learning, and big data analytics has enabled financial analysts to extract actionable insights from vast troves of financial data with unprecedented speed and accuracy. Algorithmic trading algorithms, for instance, leverage complex mathematical models and real-time market data to execute trades autonomously, capitalizing on fleeting arbitrage opportunities and market inefficiencies. Similarly, in the realm of investment management, robo-advisors harness the power of data analytics and machine learning algorithms to offer personalized investment recommendations tailored to individual risk profiles and financial goals. Moreover, the proliferation of fintech startups and digital platforms has democratized access to financial analysis tools and services, empowering individuals and organizations alike to make more informed financial decisions. As such, the application of financial analysis continues to expand its footprint, driven by ongoing technological advancements and the growing demand for data-driven insights in an increasingly complex and interconnected global economy.
Numerical Analysis Software Market Regional Insights:
Asia Pacific is Expected to Dominate the Market Over the Forecast period
- Within the Asia Pacific region, countries like China, Japan, and India are not only witnessing exponential growth in key sectors such as automotive, electronics, and construction but are also emerging as leaders in technological innovation and adoption. China, for instance, stands out as a global manufacturing powerhouse, with a rapidly evolving landscape that embraces advanced technologies like numerical analysis software to optimize production processes, improve product quality, and enhance competitiveness in the global market. The country's ambitious initiatives such as "Made in China 2025" underscore its commitment to technological advancement and industrial upgrading, driving significant demand for sophisticated engineering simulation and modeling solutions. Similarly, Japan's reputation for precision engineering and high-tech manufacturing makes it a natural market for numerical analysis software, particularly in industries like automotive, electronics, and robotics. With a strong emphasis on innovation and digital transformation, Japanese companies are increasingly turning to advanced computational tools to stay ahead of the curve and maintain their competitive edge in global markets. Likewise, India's rapidly expanding economy and burgeoning startup ecosystem offer fertile ground for the adoption of numerical analysis software across diverse industries. As the country strives to position itself as a global hub for technology and innovation, there is a growing recognition of the importance of leveraging advanced computational techniques to drive efficiency, productivity, and innovation across sectors ranging from automotive and aerospace to healthcare and infrastructure.
- Moreover, the presence of a large manufacturing base in the Asia Pacific region, coupled with government initiatives aimed at promoting innovation and technology adoption, further reinforces the dominance of numerical analysis software in the market. Governments across the region are increasingly recognizing the strategic importance of digitalization and technology-driven growth, investing heavily in research and development, infrastructure modernization, and skill development initiatives to foster a conducive environment for technological innovation. For instance, initiatives like China's "Internet Plus" and India's "Digital India" program are aimed at leveraging digital technologies to drive economic growth, create jobs, and enhance competitiveness. Additionally, the burgeoning startup ecosystem in countries like Singapore, South Korea, and Taiwan is fueling innovation and entrepreneurship in fields such as artificial intelligence, data analytics, and cloud computing, creating new opportunities for the adoption of numerical analysis software across a wide range of industries. As a result, the Asia Pacific region is poised to maintain its dominant share in the global market for numerical analysis software, driven by rapid industrialization, technological innovation, and proactive government policies aimed at fostering a conducive environment for digital transformation and economic growth.
Active Key Players in the Numerical Analysis Software Market
- Analytica
- Matlab
- GNU Octave
- Plotly
- FlexPro
- Julia
- Scilab
- LAPACK
- ScaLAPACK
- NAG Library
- FreeMat
- Calerga
- LabVIEW
- Other Active Players
|
Global Numerical Analysis Software Market |
|||
|
Base Year: |
2024 |
Forecast Period: |
2025-2032 |
|
Historical Data: |
2018 to 2023 |
Market Size in 2024: |
USD 13.67 Bn. |
|
Forecast Period 2025-32 CAGR: |
12.5% |
Market Size in 2032: |
USD 35.07 Bn. |
|
Segments Covered: |
By Type |
|
|
|
By Applications |
|
||
|
By Region |
|
||
|
Key Market Drivers: |
|
||
|
Key Market Restraints: |
|
||
|
Key Opportunities: |
|
||
|
Companies Covered in the report: |
|
||
Chapter 1: Introduction
1.1 Scope and Coverage
Chapter 2:Executive Summary
Chapter 3: Market Landscape
3.1 Market Dynamics
3.1.1 Drivers
3.1.2 Restraints
3.1.3 Opportunities
3.1.4 Challenges
3.2 Market Trend Analysis
3.3 PESTLE Analysis
3.4 Porter's Five Forces Analysis
3.5 Industry Value Chain Analysis
3.6 Ecosystem
3.7 Regulatory Landscape
3.8 Price Trend Analysis
3.9 Patent Analysis
3.10 Technology Evolution
3.11 Investment Pockets
3.12 Import-Export Analysis
Chapter 4: Numerical Analysis Software Market by Type (2018-2032)
4.1 Numerical Analysis Software Market Snapshot and Growth Engine
4.2 Market Overview
4.3 Desktop-based Software
4.3.1 Introduction and Market Overview
4.3.2 Historic and Forecasted Market Size in Value USD and Volume Units
4.3.3 Key Market Trends, Growth Factors, and Opportunities
4.3.4 Geographic Segmentation Analysis
4.4 Cloud-based Software
4.5 Web-based Software
Chapter 5: Numerical Analysis Software Market by Applications (2018-2032)
5.1 Numerical Analysis Software Market Snapshot and Growth Engine
5.2 Market Overview
5.3 Engineering
5.3.1 Introduction and Market Overview
5.3.2 Historic and Forecasted Market Size in Value USD and Volume Units
5.3.3 Key Market Trends, Growth Factors, and Opportunities
5.3.4 Geographic Segmentation Analysis
5.4 Financial Analysis
5.5 Scientific Research
5.6 Academic Institutions
5.7 Others
Chapter 6: Company Profiles and Competitive Analysis
6.1 Competitive Landscape
6.1.1 Competitive Benchmarking
6.1.2 Numerical Analysis Software Market Share by Manufacturer (2024)
6.1.3 Industry BCG Matrix
6.1.4 Heat Map Analysis
6.1.5 Mergers and Acquisitions
6.2 SOLARWINDS (U.S.)
6.2.1 Company Overview
6.2.2 Key Executives
6.2.3 Company Snapshot
6.2.4 Role of the Company in the Market
6.2.5 Sustainability and Social Responsibility
6.2.6 Operating Business Segments
6.2.7 Product Portfolio
6.2.8 Business Performance
6.2.9 Key Strategic Moves and Recent Developments
6.2.10 SWOT Analysis
6.3 IBM CORPORATION (U.S.)
6.4 CISCO SYSTEMS INC. (U.S.)
6.5 BROADCOM INC. (U.S.)
6.6 NETSCOUT SYSTEMS INC. (U.S.)
6.7 VIAVI SOLUTIONS INC. (U.S.)
6.8 RIVERBED TECHNOLOGY (U.S.)
6.9 MANAGEENGINE (U.S.)
6.10 ACCEDIAN NETWORKS INC. (U.S.)
6.11 INTERNET2 (U.S.)
6.12 PATHSOLUTIONS (U.S.)
6.13 MANAGEENGINE (U.S.)
6.14 FLUKE CORPORATION (U.S.)
6.15 NETGEAR (U.S.)
6.16 LOGICMONITOR (U.S.)
6.17 AUVIK NETWORKS (CANADA)
6.18 PAESSLER AG (GERMANY)
6.19 COLASOFT (CHINA)
6.20
Chapter 7: Global Numerical Analysis Software Market By Region
7.1 Overview
7.2. North America Numerical Analysis Software Market
7.2.1 Key Market Trends, Growth Factors and Opportunities
7.2.2 Top Key Companies
7.2.3 Historic and Forecasted Market Size by Segments
7.2.4 Historic and Forecasted Market Size by Type
7.2.4.1 Desktop-based Software
7.2.4.2 Cloud-based Software
7.2.4.3 Web-based Software
7.2.5 Historic and Forecasted Market Size by Applications
7.2.5.1 Engineering
7.2.5.2 Financial Analysis
7.2.5.3 Scientific Research
7.2.5.4 Academic Institutions
7.2.5.5 Others
7.2.6 Historic and Forecast Market Size by Country
7.2.6.1 US
7.2.6.2 Canada
7.2.6.3 Mexico
7.3. Eastern Europe Numerical Analysis Software Market
7.3.1 Key Market Trends, Growth Factors and Opportunities
7.3.2 Top Key Companies
7.3.3 Historic and Forecasted Market Size by Segments
7.3.4 Historic and Forecasted Market Size by Type
7.3.4.1 Desktop-based Software
7.3.4.2 Cloud-based Software
7.3.4.3 Web-based Software
7.3.5 Historic and Forecasted Market Size by Applications
7.3.5.1 Engineering
7.3.5.2 Financial Analysis
7.3.5.3 Scientific Research
7.3.5.4 Academic Institutions
7.3.5.5 Others
7.3.6 Historic and Forecast Market Size by Country
7.3.6.1 Russia
7.3.6.2 Bulgaria
7.3.6.3 The Czech Republic
7.3.6.4 Hungary
7.3.6.5 Poland
7.3.6.6 Romania
7.3.6.7 Rest of Eastern Europe
7.4. Western Europe Numerical Analysis Software Market
7.4.1 Key Market Trends, Growth Factors and Opportunities
7.4.2 Top Key Companies
7.4.3 Historic and Forecasted Market Size by Segments
7.4.4 Historic and Forecasted Market Size by Type
7.4.4.1 Desktop-based Software
7.4.4.2 Cloud-based Software
7.4.4.3 Web-based Software
7.4.5 Historic and Forecasted Market Size by Applications
7.4.5.1 Engineering
7.4.5.2 Financial Analysis
7.4.5.3 Scientific Research
7.4.5.4 Academic Institutions
7.4.5.5 Others
7.4.6 Historic and Forecast Market Size by Country
7.4.6.1 Germany
7.4.6.2 UK
7.4.6.3 France
7.4.6.4 The Netherlands
7.4.6.5 Italy
7.4.6.6 Spain
7.4.6.7 Rest of Western Europe
7.5. Asia Pacific Numerical Analysis Software Market
7.5.1 Key Market Trends, Growth Factors and Opportunities
7.5.2 Top Key Companies
7.5.3 Historic and Forecasted Market Size by Segments
7.5.4 Historic and Forecasted Market Size by Type
7.5.4.1 Desktop-based Software
7.5.4.2 Cloud-based Software
7.5.4.3 Web-based Software
7.5.5 Historic and Forecasted Market Size by Applications
7.5.5.1 Engineering
7.5.5.2 Financial Analysis
7.5.5.3 Scientific Research
7.5.5.4 Academic Institutions
7.5.5.5 Others
7.5.6 Historic and Forecast Market Size by Country
7.5.6.1 China
7.5.6.2 India
7.5.6.3 Japan
7.5.6.4 South Korea
7.5.6.5 Malaysia
7.5.6.6 Thailand
7.5.6.7 Vietnam
7.5.6.8 The Philippines
7.5.6.9 Australia
7.5.6.10 New Zealand
7.5.6.11 Rest of APAC
7.6. Middle East & Africa Numerical Analysis Software Market
7.6.1 Key Market Trends, Growth Factors and Opportunities
7.6.2 Top Key Companies
7.6.3 Historic and Forecasted Market Size by Segments
7.6.4 Historic and Forecasted Market Size by Type
7.6.4.1 Desktop-based Software
7.6.4.2 Cloud-based Software
7.6.4.3 Web-based Software
7.6.5 Historic and Forecasted Market Size by Applications
7.6.5.1 Engineering
7.6.5.2 Financial Analysis
7.6.5.3 Scientific Research
7.6.5.4 Academic Institutions
7.6.5.5 Others
7.6.6 Historic and Forecast Market Size by Country
7.6.6.1 Turkiye
7.6.6.2 Bahrain
7.6.6.3 Kuwait
7.6.6.4 Saudi Arabia
7.6.6.5 Qatar
7.6.6.6 UAE
7.6.6.7 Israel
7.6.6.8 South Africa
7.7. South America Numerical Analysis Software Market
7.7.1 Key Market Trends, Growth Factors and Opportunities
7.7.2 Top Key Companies
7.7.3 Historic and Forecasted Market Size by Segments
7.7.4 Historic and Forecasted Market Size by Type
7.7.4.1 Desktop-based Software
7.7.4.2 Cloud-based Software
7.7.4.3 Web-based Software
7.7.5 Historic and Forecasted Market Size by Applications
7.7.5.1 Engineering
7.7.5.2 Financial Analysis
7.7.5.3 Scientific Research
7.7.5.4 Academic Institutions
7.7.5.5 Others
7.7.6 Historic and Forecast Market Size by Country
7.7.6.1 Brazil
7.7.6.2 Argentina
7.7.6.3 Rest of SA
Chapter 8 Analyst Viewpoint and Conclusion
8.1 Recommendations and Concluding Analysis
8.2 Potential Market Strategies
Chapter 9 Research Methodology
9.1 Research Process
9.2 Primary Research
9.3 Secondary Research
|
Global Numerical Analysis Software Market |
|||
|
Base Year: |
2024 |
Forecast Period: |
2025-2032 |
|
Historical Data: |
2018 to 2023 |
Market Size in 2024: |
USD 13.67 Bn. |
|
Forecast Period 2025-32 CAGR: |
12.5% |
Market Size in 2032: |
USD 35.07 Bn. |
|
Segments Covered: |
By Type |
|
|
|
By Applications |
|
||
|
By Region |
|
||
|
Key Market Drivers: |
|
||
|
Key Market Restraints: |
|
||
|
Key Opportunities: |
|
||
|
Companies Covered in the report: |
|
||


