


Nitric Acid Market Synopsis
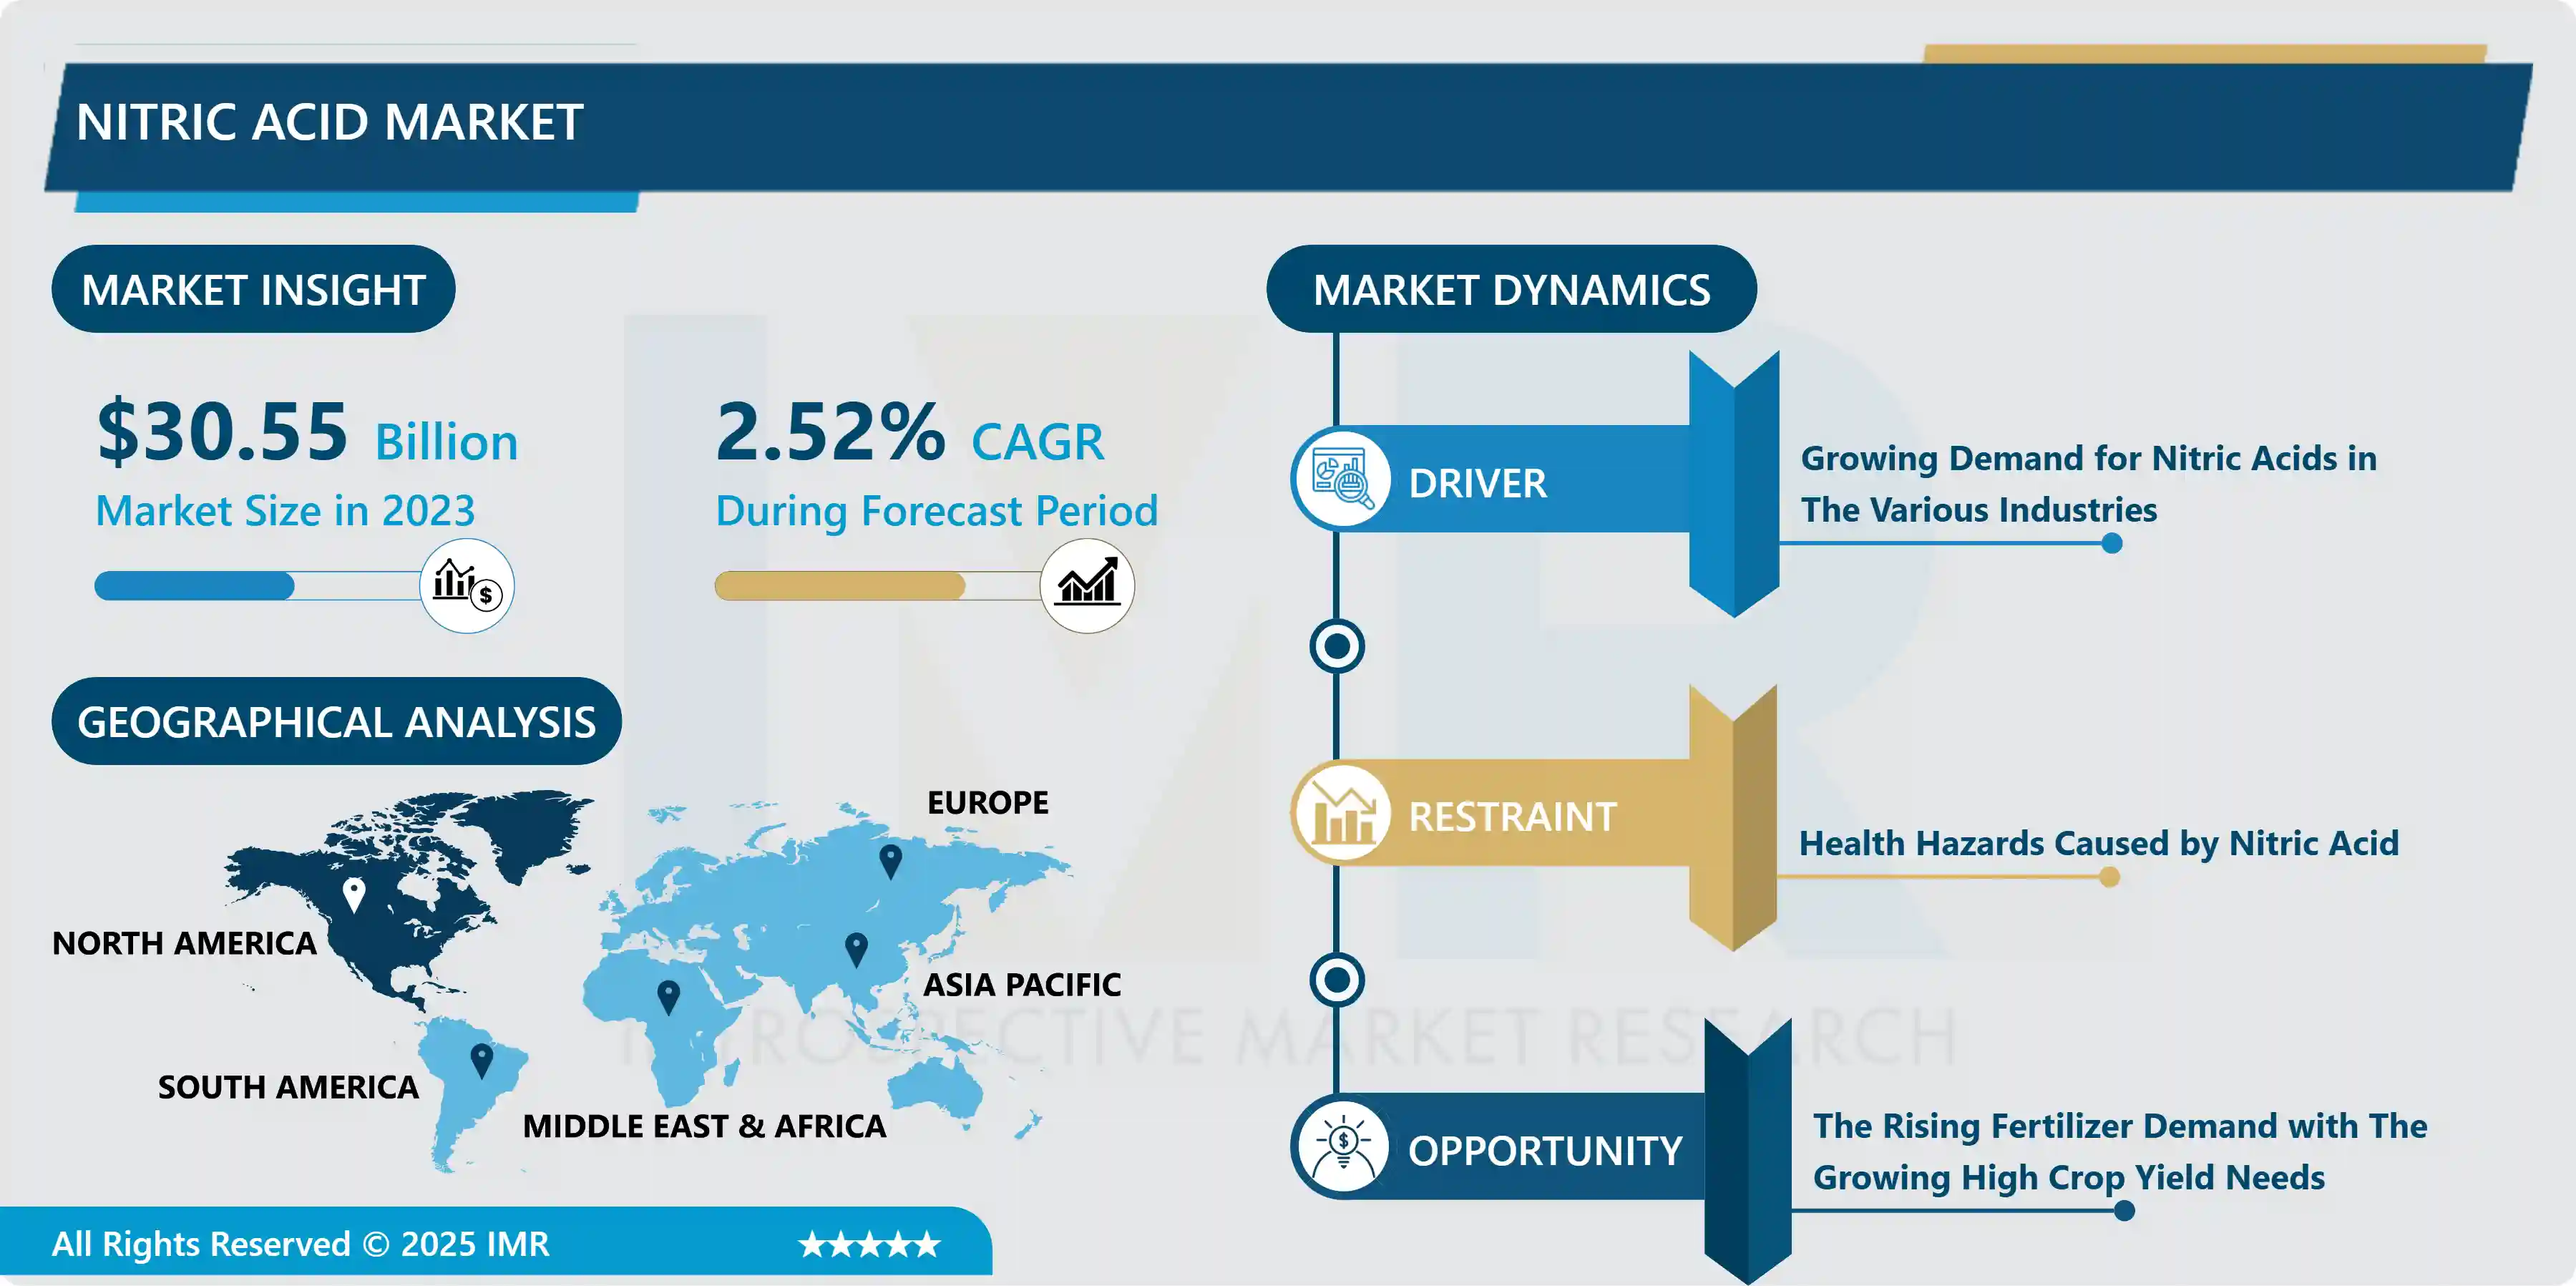
Nitric Acid Market Size Was Valued at USD 30.55 Billion in 2023, and is Projected to Reach USD 38.22 Billion by 2032, Growing at a CAGR of 2.52% From 2024-2032.
An inorganic substance with the formula HNO3 is nitric acid. It is a mineral acid that is very corrosive. The substance is colorless, but samples often take on a yellow tint over time as a result of the compound's breakdown into nitrogen oxides.
Making plastics, producing ammonium nitrate for fertilizers, and creating dyes all involve the use of nitric acid. Additionally, it is used in the production of explosives like TNT and nitroglycerin. Aqua regia is a substance that is created when it is mixed with hydrochloric acid. This reagent has the ability to dissolve platinum and gold. Additionally, it is employed in a colorimetric test to separate morphine from heroin.
Furthermore, increasing demand from fertilizer formulators and rising fertilizer consumption in agrarian economies around the world are anticipated to drive the product's growth. To maximize crop yield, shorten cultivation times, achieve healthy crop growth, and other objectives, various fertilizers and agricultural facilities have been expanded globally in response to rising food demand. One of the essential ingredients in the manufacture of nitrogen fertilizers, which are in high demand in the agricultural sector, is nitric acid.
Nitric Acid Market Trend Analysis
Growing Demand for Nitric Acids in The Various Industries
- The market for nitric acid has seen significant growth in recent years due to rising demand from various industries. Highly adaptable chemical nitric acid finds extensive use in a variety of industries, fueling market expansion. Also, nitric acid is also a key raw material used frequently in the chemical industry to create a range of chemical intermediates. It is used to create substances like nitrobenzene and adipic acid, which are necessary building blocks for the manufacturing of dyes, plastics, and other chemical products.
- Nitric acid is also a key component in the explosives industry because it is used to create explosives like nitroglycerin and trinitrotoluene (TNT). These explosives are used in mining, quarrying, building, and military operations. The demand for explosives is rising along with the expansion of mining operations and infrastructure, which is propelling the market for nitric acid. Furthermore, nitric acid is widely used in the automotive industry. It is employed in the production of fuel cells, airbags, and other auto parts. Nitric acid is expected to be in high demand for the production of automotive components due to the growing automotive industry, which is expected to be fueled by urbanization, rising disposable incomes, and technological advancements.
Rising Fertilizer Demand with The Growing High Crop Yield Needs
- The growing need for high crop yields and the rising demand for fertilizers present a sizable growth opportunity for the nitric acid market. In order to meet the growing demand for food, agricultural productivity increased as the world's population grows. Fertilizers are essential for increasing soil fertility and giving crops the vital nutrients, they need to grow and produce more. The production of ammonium nitrate and calcium ammonium nitrate fertilizers requires the use of nitric acid, which is essential to the agricultural industry.
- These fertilizers are abundant in nitrogen, which is essential for the growth and development of plants. Farmers are increasingly looking for nitrogen-based fertilizers as they try to increase crop yields and agricultural output. The use of nitrogen-based fertilizers is anticipated to rise significantly as a result of the increased emphasis on achieving higher crop yields and the need for sustainable agricultural practices. The demand for nitric acid in the creation of specialized fertilizers is also increased by the trend toward controlled-release fertilizers and precision agriculture.
Segmentation Analysis of The Nitric Acid Market
Nitric Acid market segments cover Type, Application, and End-Use Industry. By Application, the fertilizer segment is Anticipated to Dominate the Market Over the Forecast period.
- Due to its sizeable contribution to the overall market share, the fertilizer segment is excepted to dominate the nitric acid market over the forecast period. There is increasing pressure on the agriculture sector to ensure food security and meet the rising demand for crops as a result of the continued growth of the world's population. Fertilizers are essential for improving soil fertility and giving plants the nutrients, they need, which leads to increased crop yields and agricultural productivity.
- Ammonium nitrate and calcium ammonium nitrate are two nitrogen-based fertilizers that are produced using nitric acid as a key raw material. Because of their capacity to provide plants with nitrogen, a component that is crucial for their growth and development, these fertilizers are highly sought after by farmers and the agricultural industry. The demand for fertilizers based on nitrogen is increasing as the need for efficient and sustainable agricultural methods grows, which is fueling the market's expansion for nitric acid.
Regional Analysis of The Nitric Acid Market
Asia Pacific is Expected to Dominate the Market Over the Forecast Period.
- Over the forecast period, Asia-Pacific is anticipated to hold a commanding position in the nitric acid market due to the region's significant fertilizer production and consumption. In terms of the production and export of nitric acid, the Asia-Pacific region which includes nations like China, India, and South Korea holds a significant position. China, one of the major nations in the Asia-Pacific region, is a key player in the world market for nitric acid.
- China is the second-largest importer of nitric acid, and different end-user industries like fertilizers, inks, pigments, dyes, and chemical manufacturing primarily drive China's demand. China continues to be a significant consumer of nitrogen-based fertilizers due to its strong industrial base and expanding agricultural activities, which drives up the demand for nitric acid. On the other hand, South Korea is the world's biggest exporter of nitric acid. The nation's dominance in nitric acid exports is a result of its robust manufacturing and chemical sectors, which use the acid for a variety of purposes. For instance, according to Statista, South Korea is the world's leading exporter country of nitric and sulphonitric acid. Increasing export valve in South Korea drive growth in the Asia Pacific region.

COVID-19 Impact Analysis on the Nitric Acid Market
- COVID-19 has caused widespread disruption to manufacturing operations and global supply chains. Lockdown measures, social distancing practices, and work restrictions have affected the production and distribution of Nitric acids. Lockdowns and travel restrictions during the early stages of the pandemic caused a slowdown in industrial activities. Nitric acid demand and production were decreased in sectors like manufacturing, construction, and the automotive industry.
- The demand for nitric acid was adversely impacted by this decline in industrial output. The pandemic affected the availability of chemicals and raw materials needed to produce nitric acid by upsetting global supply chains. Production and delivery delays were caused by the supply chain being further complicated by border closures and transportation restrictions.
Top Key Players Covered in The Nitric Acid Market
- DuPont
- CF Industries Holdings Inc. (US)
- The Chemours Company (US)
- LSB Industries, Inc. (US)
- Koch Fertilizer, LLC (US)
- PotashCorp (Canada)
- Nutrien (Canada)
- Yara International ASA (Norway)
- EuroChem Group AG (Switzerland)
- OCI Nitrogen (Netherlands)
- CF Fertilisers UK Ltd. (United Kingdom)
- Group DF (Ukraine)
- Uralchem Jsc (Russia)
- BASF (Germany)
- Sumitomo Chemical Co., Ltd. (Japan)
- Hanwha Corporation (South Korea)
- Fertiberia S.A. (Spain)
- National Chemical Group (China), and Other Major Players
Key Industry Developments in the Nitric Acid Market
In January 2023, Grupa Azoty SA (Tarnów, Poland) launched a new facility for the production of concentrated nitric acid with a design output of 40,000 metric tons per year (m.t./yr), doubling its existing capacity. This is a second production line for above 98 percent concentrated nitric acid now operating in Tarnów. It has brought the Tarnów plant’s total annual capacity for that product to 80,000 tons.
In January 2023, Dorogobuzh launched a new 135-ktpa UKL nitric acid unit at its production facility in the Smolensk region. Acron Engineering Research and Design Centre is the general designer of this project, which cost USD17 million.
|
Global Nitric Acid Market |
|||
|
Base Year: |
2023 |
Forecast Period: |
2024-2032 |
|
Historical Data: |
2016 to 2023 |
Market Size in 2023: |
USD 30.55 Bn. |
|
Forecast Period 2024-32 CAGR: |
2.52% |
Market Size in 2032: |
USD 38.22 Bn. |
|
Segments Covered: |
By Type |
|
|
|
By Application |
|
||
|
By End-Use Industry |
|
||
|
By Region |
|
||
|
Key Market Drivers: |
|
||
|
Key Market Restraints: |
|
||
|
Key Opportunities: |
|
||
|
Companies Covered in the Report: |
|
||
Chapter 1: Introduction
1.1 Scope and Coverage
Chapter 2:Executive Summary
Chapter 3: Market Landscape
3.1 Market Dynamics
3.1.1 Drivers
3.1.2 Restraints
3.1.3 Opportunities
3.1.4 Challenges
3.2 Market Trend Analysis
3.3 PESTLE Analysis
3.4 Porter's Five Forces Analysis
3.5 Industry Value Chain Analysis
3.6 Ecosystem
3.7 Regulatory Landscape
3.8 Price Trend Analysis
3.9 Patent Analysis
3.10 Technology Evolution
3.11 Investment Pockets
3.12 Import-Export Analysis
Chapter 4: Nitric Acid Market by Type (2018-2032)
4.1 Nitric Acid Market Snapshot and Growth Engine
4.2 Market Overview
4.3 Concentrated Nitric Acid
4.3.1 Introduction and Market Overview
4.3.2 Historic and Forecasted Market Size in Value USD and Volume Units
4.3.3 Key Market Trends, Growth Factors, and Opportunities
4.3.4 Geographic Segmentation Analysis
4.4 Dilute Nitric Acid
Chapter 5: Nitric Acid Market by Application (2018-2032)
5.1 Nitric Acid Market Snapshot and Growth Engine
5.2 Market Overview
5.3 Fertilizers
5.3.1 Introduction and Market Overview
5.3.2 Historic and Forecasted Market Size in Value USD and Volume Units
5.3.3 Key Market Trends, Growth Factors, and Opportunities
5.3.4 Geographic Segmentation Analysis
5.4 Nitrobenzene
5.5 Adipic Acid
5.6 Toluene Di-isocyanate
5.7 Nitrochlorobenzene
5.8 Other
Chapter 6: Nitric Acid Market by End-Use Industry (2018-2032)
6.1 Nitric Acid Market Snapshot and Growth Engine
6.2 Market Overview
6.3 Agriculture and Agrochemicals
6.3.1 Introduction and Market Overview
6.3.2 Historic and Forecasted Market Size in Value USD and Volume Units
6.3.3 Key Market Trends, Growth Factors, and Opportunities
6.3.4 Geographic Segmentation Analysis
6.4 Chemicals and Petrochemicals
6.5 Mining and Explosives
6.6 Other
Chapter 7: Company Profiles and Competitive Analysis
7.1 Competitive Landscape
7.1.1 Competitive Benchmarking
7.1.2 Nitric Acid Market Share by Manufacturer (2024)
7.1.3 Industry BCG Matrix
7.1.4 Heat Map Analysis
7.1.5 Mergers and Acquisitions
7.2 VERA WANG(US)
7.2.1 Company Overview
7.2.2 Key Executives
7.2.3 Company Snapshot
7.2.4 Role of the Company in the Market
7.2.5 Sustainability and Social Responsibility
7.2.6 Operating Business Segments
7.2.7 Product Portfolio
7.2.8 Business Performance
7.2.9 Key Strategic Moves and Recent Developments
7.2.10 SWOT Analysis
7.3 MONIQUE LHUILLIER (US)
7.4 MAGGIE SOTTERO DESIGNS (US)
7.5 ALFRED ANGELO (US)
7.6 DAVID'S BRIDAL (US)
7.7 MORI LEE (US)
7.8 AMSALE (US)
7.9 MARCHESA (US)
7.10 REEM ACRA (US)
7.11 GUCCI (ITALY)
7.12 VERSACE (ITALY)
7.13 PRONOVIAS FASHION GROUP (SPAIN)
7.14 SEPTWOLVES (CHINA)
7.15 MOHEY-MANYAVAR (INDIA)
7.16
Chapter 8: Global Nitric Acid Market By Region
8.1 Overview
8.2. North America Nitric Acid Market
8.2.1 Key Market Trends, Growth Factors and Opportunities
8.2.2 Top Key Companies
8.2.3 Historic and Forecasted Market Size by Segments
8.2.4 Historic and Forecasted Market Size by Type
8.2.4.1 Concentrated Nitric Acid
8.2.4.2 Dilute Nitric Acid
8.2.5 Historic and Forecasted Market Size by Application
8.2.5.1 Fertilizers
8.2.5.2 Nitrobenzene
8.2.5.3 Adipic Acid
8.2.5.4 Toluene Di-isocyanate
8.2.5.5 Nitrochlorobenzene
8.2.5.6 Other
8.2.6 Historic and Forecasted Market Size by End-Use Industry
8.2.6.1 Agriculture and Agrochemicals
8.2.6.2 Chemicals and Petrochemicals
8.2.6.3 Mining and Explosives
8.2.6.4 Other
8.2.7 Historic and Forecast Market Size by Country
8.2.7.1 US
8.2.7.2 Canada
8.2.7.3 Mexico
8.3. Eastern Europe Nitric Acid Market
8.3.1 Key Market Trends, Growth Factors and Opportunities
8.3.2 Top Key Companies
8.3.3 Historic and Forecasted Market Size by Segments
8.3.4 Historic and Forecasted Market Size by Type
8.3.4.1 Concentrated Nitric Acid
8.3.4.2 Dilute Nitric Acid
8.3.5 Historic and Forecasted Market Size by Application
8.3.5.1 Fertilizers
8.3.5.2 Nitrobenzene
8.3.5.3 Adipic Acid
8.3.5.4 Toluene Di-isocyanate
8.3.5.5 Nitrochlorobenzene
8.3.5.6 Other
8.3.6 Historic and Forecasted Market Size by End-Use Industry
8.3.6.1 Agriculture and Agrochemicals
8.3.6.2 Chemicals and Petrochemicals
8.3.6.3 Mining and Explosives
8.3.6.4 Other
8.3.7 Historic and Forecast Market Size by Country
8.3.7.1 Russia
8.3.7.2 Bulgaria
8.3.7.3 The Czech Republic
8.3.7.4 Hungary
8.3.7.5 Poland
8.3.7.6 Romania
8.3.7.7 Rest of Eastern Europe
8.4. Western Europe Nitric Acid Market
8.4.1 Key Market Trends, Growth Factors and Opportunities
8.4.2 Top Key Companies
8.4.3 Historic and Forecasted Market Size by Segments
8.4.4 Historic and Forecasted Market Size by Type
8.4.4.1 Concentrated Nitric Acid
8.4.4.2 Dilute Nitric Acid
8.4.5 Historic and Forecasted Market Size by Application
8.4.5.1 Fertilizers
8.4.5.2 Nitrobenzene
8.4.5.3 Adipic Acid
8.4.5.4 Toluene Di-isocyanate
8.4.5.5 Nitrochlorobenzene
8.4.5.6 Other
8.4.6 Historic and Forecasted Market Size by End-Use Industry
8.4.6.1 Agriculture and Agrochemicals
8.4.6.2 Chemicals and Petrochemicals
8.4.6.3 Mining and Explosives
8.4.6.4 Other
8.4.7 Historic and Forecast Market Size by Country
8.4.7.1 Germany
8.4.7.2 UK
8.4.7.3 France
8.4.7.4 The Netherlands
8.4.7.5 Italy
8.4.7.6 Spain
8.4.7.7 Rest of Western Europe
8.5. Asia Pacific Nitric Acid Market
8.5.1 Key Market Trends, Growth Factors and Opportunities
8.5.2 Top Key Companies
8.5.3 Historic and Forecasted Market Size by Segments
8.5.4 Historic and Forecasted Market Size by Type
8.5.4.1 Concentrated Nitric Acid
8.5.4.2 Dilute Nitric Acid
8.5.5 Historic and Forecasted Market Size by Application
8.5.5.1 Fertilizers
8.5.5.2 Nitrobenzene
8.5.5.3 Adipic Acid
8.5.5.4 Toluene Di-isocyanate
8.5.5.5 Nitrochlorobenzene
8.5.5.6 Other
8.5.6 Historic and Forecasted Market Size by End-Use Industry
8.5.6.1 Agriculture and Agrochemicals
8.5.6.2 Chemicals and Petrochemicals
8.5.6.3 Mining and Explosives
8.5.6.4 Other
8.5.7 Historic and Forecast Market Size by Country
8.5.7.1 China
8.5.7.2 India
8.5.7.3 Japan
8.5.7.4 South Korea
8.5.7.5 Malaysia
8.5.7.6 Thailand
8.5.7.7 Vietnam
8.5.7.8 The Philippines
8.5.7.9 Australia
8.5.7.10 New Zealand
8.5.7.11 Rest of APAC
8.6. Middle East & Africa Nitric Acid Market
8.6.1 Key Market Trends, Growth Factors and Opportunities
8.6.2 Top Key Companies
8.6.3 Historic and Forecasted Market Size by Segments
8.6.4 Historic and Forecasted Market Size by Type
8.6.4.1 Concentrated Nitric Acid
8.6.4.2 Dilute Nitric Acid
8.6.5 Historic and Forecasted Market Size by Application
8.6.5.1 Fertilizers
8.6.5.2 Nitrobenzene
8.6.5.3 Adipic Acid
8.6.5.4 Toluene Di-isocyanate
8.6.5.5 Nitrochlorobenzene
8.6.5.6 Other
8.6.6 Historic and Forecasted Market Size by End-Use Industry
8.6.6.1 Agriculture and Agrochemicals
8.6.6.2 Chemicals and Petrochemicals
8.6.6.3 Mining and Explosives
8.6.6.4 Other
8.6.7 Historic and Forecast Market Size by Country
8.6.7.1 Turkiye
8.6.7.2 Bahrain
8.6.7.3 Kuwait
8.6.7.4 Saudi Arabia
8.6.7.5 Qatar
8.6.7.6 UAE
8.6.7.7 Israel
8.6.7.8 South Africa
8.7. South America Nitric Acid Market
8.7.1 Key Market Trends, Growth Factors and Opportunities
8.7.2 Top Key Companies
8.7.3 Historic and Forecasted Market Size by Segments
8.7.4 Historic and Forecasted Market Size by Type
8.7.4.1 Concentrated Nitric Acid
8.7.4.2 Dilute Nitric Acid
8.7.5 Historic and Forecasted Market Size by Application
8.7.5.1 Fertilizers
8.7.5.2 Nitrobenzene
8.7.5.3 Adipic Acid
8.7.5.4 Toluene Di-isocyanate
8.7.5.5 Nitrochlorobenzene
8.7.5.6 Other
8.7.6 Historic and Forecasted Market Size by End-Use Industry
8.7.6.1 Agriculture and Agrochemicals
8.7.6.2 Chemicals and Petrochemicals
8.7.6.3 Mining and Explosives
8.7.6.4 Other
8.7.7 Historic and Forecast Market Size by Country
8.7.7.1 Brazil
8.7.7.2 Argentina
8.7.7.3 Rest of SA
Chapter 9 Analyst Viewpoint and Conclusion
9.1 Recommendations and Concluding Analysis
9.2 Potential Market Strategies
Chapter 10 Research Methodology
10.1 Research Process
10.2 Primary Research
10.3 Secondary Research
|
Global Nitric Acid Market |
|||
|
Base Year: |
2023 |
Forecast Period: |
2024-2032 |
|
Historical Data: |
2016 to 2023 |
Market Size in 2023: |
USD 30.55 Bn. |
|
Forecast Period 2024-32 CAGR: |
2.52% |
Market Size in 2032: |
USD 38.22 Bn. |
|
Segments Covered: |
By Type |
|
|
|
By Application |
|
||
|
By End-Use Industry |
|
||
|
By Region |
|
||
|
Key Market Drivers: |
|
||
|
Key Market Restraints: |
|
||
|
Key Opportunities: |
|
||
|
Companies Covered in the Report: |
|
||


