


Milk Fat Fractions Market Synopsis
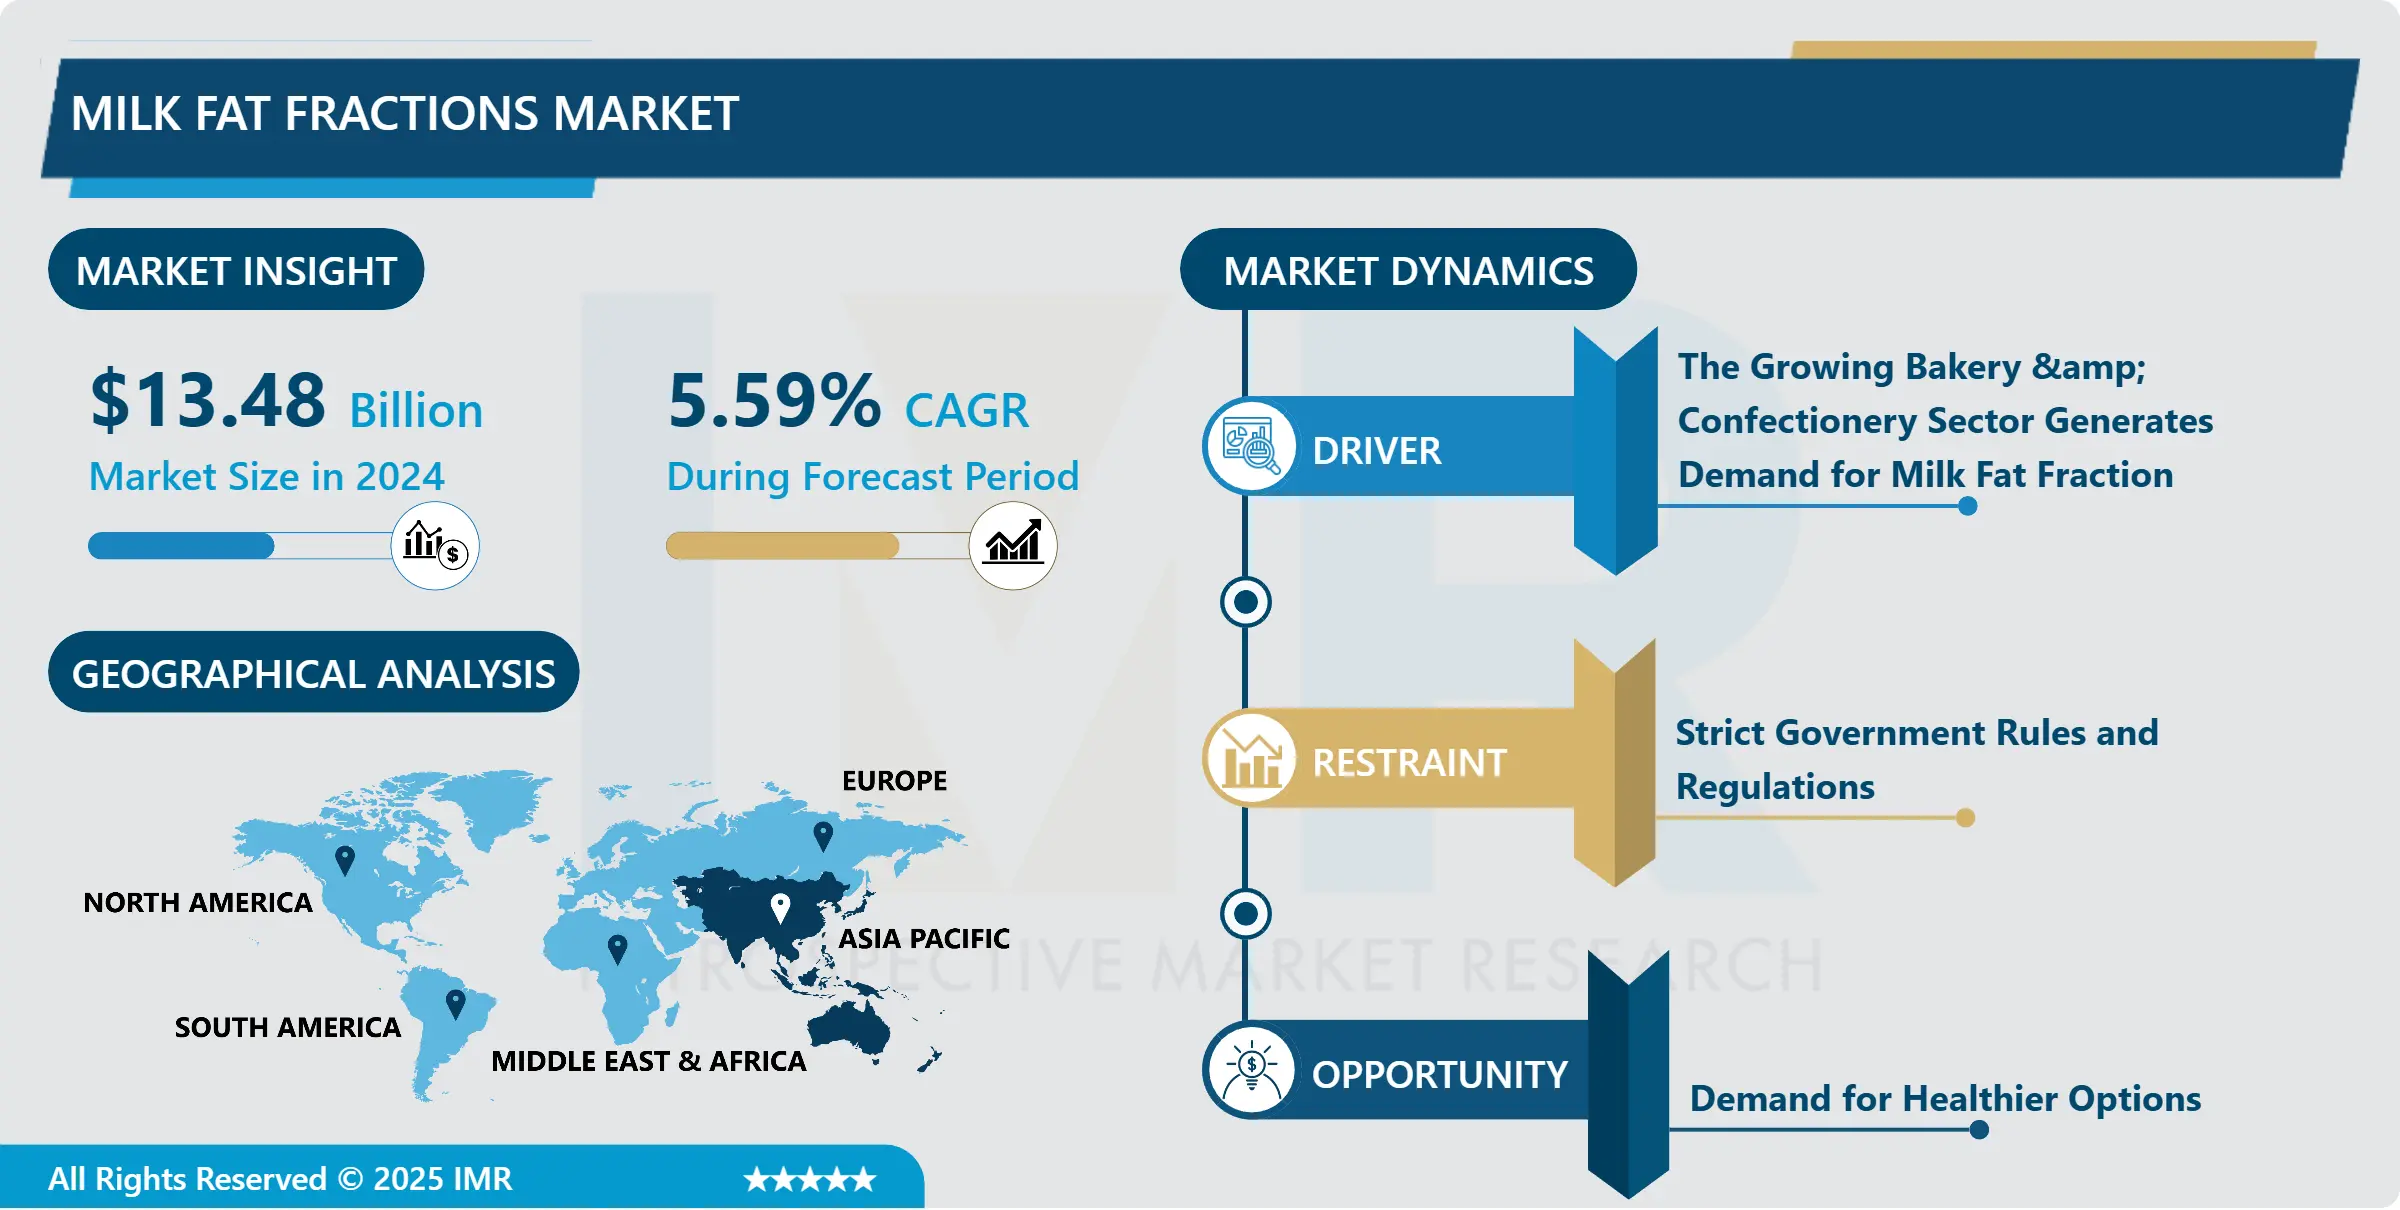
Milk Fat Fractions Market Size Was Valued at USD 13.48 Billion in 2024 and is Projected to Reach USD 20.84 Billion by 2032, Growing at a CAGR of 5.59% From 2025-2032.
Global Milk Fat Fractions refer to the components of milk fat that are separated or fractionated based on their melting points. Milk fat is made up of various triglycerides, which are combinations of fatty acids attached to a glycerol molecule. These triglycerides have different melting points, allowing for the separation of milk fat into fractions.
The process of fractionation involves separating the different triglycerides or lipid components of milk fat based on their melting points. This separation is typically achieved through techniques like crystallization, fractionation, and sometimes through more advanced methods like supercritical fluid extraction. The fractions obtained through this process may include specific fatty acids or triglycerides with different physical and chemical properties. These fractions can be utilized in the food industry to modify the texture, stability, or nutritional profile of food products. They might be used in the production of certain dairy products, confectionery, or as ingredients in specialized nutritional formulations.
Milk fat is composed of different triglycerides having various molecular weights with different physical properties associated with it. Milk fat fractionate owing to the triglyceride content has a different melting point, therefore, depending upon the melting point the milk fat fractionate is classified into three important fractions, each fraction having a characteristic use in the bakery, confectionery, and other uses. Global Milk Fat Fractions have been used to produce nutritious food products such as cheese, butter, and cream. Moreover, vitamin D and omega 3 fatty acid content in milk has been associated with the fat content of the milk, a higher amount of fat means higher nutritional value. Moreover, fat fractions play an important role in the body by absorbing fat-soluble vitamins like A, D, E, and K. Moreover, Omega 3 fatty acid has been linked with the development of the heart and brain furthermore helps in reducing the risk of cancer. Vitamin D is a vital component responsible for bone growth thus, supporting the growth of the Global Milk Fat Fractions market.
Global Milk Fat Fractions Market Trend Analysis
Milk Fat Fractions Market Growth Drivers- The Growing Bakery & Confectionery Sector Generates Demand for Milk Fat Fraction
- The bakery and confectionery sector have been experiencing a significant surge in demand, fueling the growth of the Global Milk Fat Fractions market. As consumer preferences lean towards indulgent and high-quality baked goods and confectioneries, there's an increased reliance on ingredients that enhance taste, texture, and overall product quality. Global Milk Fat Fractions, derived from milk fat through fractionation processes, offer unique functionalities that cater perfectly to the demands of this thriving sector.
- These fractions, comprising specific components like triglycerides, fatty acids, and polar lipids, provide a versatile set of properties. They can improve the mouthfeel, structure, and stability of products like cakes, pastries, chocolates, and more. Additionally, their ability to enhance creaminess, impart richness, and contribute to the overall sensory experience of baked goods and confectioneries makes them highly sought after in this industry.
- The rising inclination towards clean label and natural ingredients in bakery and confectionery products has prompted the utilization of Global Milk Fat Fractions as they align well with these preferences. Manufacturers are increasingly incorporating these fractions to replace or reduce other fats or emulsifiers, ensuring cleaner labels while maintaining the desired product characteristics. This demand surge within the bakery and confectionery sector is propelling the growth trajectory of the Global Milk Fat Fractions market.
Milk Fat Fractions Market Opportunities- Demand for Healthier Options
- The growing demand for healthier dairy options, milk fat fractions have emerged as a transformative solution within the food industry. With an increasing emphasis on health-conscious consumption, consumers are seeking dairy products that offer both nutritional value and specific health benefits. Milk fat fractions, through their unique composition and customizable fatty acid profiles, enable manufacturers to craft products that align precisely with these evolving consumer preferences.
- These fractions offer a nuanced approach to dairy production, allowing for the creation of low-fat or functional dairy alternatives without compromising on taste or texture. By isolating and manipulating specific components of milk fat, such as reducing saturated fats or enhancing beneficial fatty acids like omega-3 or conjugated linoleic acid (CLA), producers can tailor their offerings to address various health concerns. This ability to fine-tune the nutritional content while preserving the sensory appeal of dairy products positions milk fat fractions as a cornerstone of the healthier dairy movement.
Global Milk Fat Fractions Market Segment Analysis:
Global Milk Fat Fractions Market Segmented on the basis of Melting Fractions, application, and Technology.
By Melting Fractions, Medium Melting fractions segment is expected to dominate the market during the forecast period
- Based on the melting fractions, the medium melting fractions segment is expected to register the maximum milk fat fractions market share during the forecast period. Strong outlook in pastries and croissants delivering a crusty & flaky texture has improved the fractionated milk fat demand. Additionally, growing requirements from shortbread, biscuits, and cakes production will help the product penetration. These products are sequentially crystallized utilizing different technologies along with high melting and low melting products.
By Technology, Dry fractionation segment held the largest share in 2024
- Based on the technology, the dry fractionation segment is anticipated to dominate the milk fat fractions market during the forecast period. Dry fractionation accounted for the maximum market share. The simple production process, high efficiency, and cost-effective properties are major factors turning the dry fractionation or melt crystallization technology. Enhanced filtration efficiency utilized to obtain butter plumpness and separation of the solid product from remaining melt offers a positive outlook for the product demand. Growing demand from chemical composition development and crystallization applications will help the milk fat fractions market grow during the projected timeline.
Global Milk Fat Fractions Market Regional Insights:
Asia Pacific is Expected to Dominate the Market Over the Forecast period
- The Asia Pacific is rising rapidly region owing to the demand for concentrated milk fat is high in this region owing to the highest import value in economies such as India and China. Furthermore, a significant rise has been observed in the per capita consumption of dairy products, in the past five years. The growing population with lactose intolerance will accelerate the industry demand as fractionated milk fat provide better lactose-free options, particularly for children and women. Furthermore, the growing influence of western diet culture resulting in higher demand for cookies, pastries, and cakes will hasten regional demand. The region is anticipated to maintain this share thus making it a top market for producers to grow their business. The rising health consciousness and middle-class population in the country are turning the demand for dairy products, thereby enhancing product sales.
Global Milk Fat Fractions Market Top Key Players:
- MCT Dairies INC (US)
- Glanbia plc(US)
- Oleo-Fats Incorporated(US)
- FIT Company (US)
- Saputo Dairy (UK)
- Wilmar International Limited (US)
- Uelzena Milchwerke eGmbH (Germany)
- Glanbia PLC (Ireland)
- Koninklijke VIV Buisman B.V (Netherlands)
- Fonterra Co-operative Group Limited (New Zealand)
- TATUA (New Zealand)
- Oleo Fats (Philippines)
- CORMACO (Europe)
- Flechard S.A (France)
- A.S. Arla Foods (Denmark)
- Kerry Group plc (Ireland)
- FrieslandCampina (Netherlands)
- The Tatua Co-operative Dairy Company Ltd(Netherlands)
- Anand Milk Union Limited (India)
- Shanghai Guangyu Food Co Ltd. (China)
- United Dairy Group Ltd. (Hong Kong)
- Fonterra Japan Ltd. (Japan)
- Lácteos San Marcos S.A.(Argentina)
- Cooperativa Colanta (Colombia)
- Other Active Players
Key Industry Developments in the Global Milk Fat Fractions Market
- In April 2023, Unternehmensgruppe Theo Müller, a Germany-based dairy products manufacturer acquired FrieslandCampina for $326.313 million. This acquisition broadens, diversifies, and enriches Unternehmensgruppe Theo Müller’s dairy products portfolio and strengthens the company’s presence in Germany.
- In September 2022, Fonterra pioneer’s nutrition science and innovation with the launched of Nutiani, a business-to-business brand targeting the multi-billion-dollar medical and everyday well-being nutrition markets. Nutiani, designed to address evolving consumer needs, offers tailored solutions for health and wellbeing customers grappling with innovation challenges.
|
Milk Fat Fractions Market |
|||
|
Base Year: |
2024 |
Forecast Period: |
2025-2032 |
|
Historical Data: |
2018 to 2023 |
Market Size in 2024: |
USD 13.48 Bn. |
|
Forecast Period 2024-32 CAGR: |
5.59% |
Market Size in 2032: |
USD 20.84 Bn. |
|
Segments Covered: |
By Melting Fractions |
|
|
|
By Form |
|
||
|
By Technology |
|
||
|
By Application |
|
||
|
By Region |
|
||
|
Key Market Drivers: |
|
||
|
Key Market Restraints: |
|
||
|
Key Opportunities: |
|
||
|
Companies Covered in the report: |
|
||
Chapter 1: Introduction
1.1 Scope and Coverage
Chapter 2:Executive Summary
Chapter 3: Market Landscape
3.1 Market Dynamics
3.1.1 Drivers
3.1.2 Restraints
3.1.3 Opportunities
3.1.4 Challenges
3.2 Market Trend Analysis
3.3 PESTLE Analysis
3.4 Porter's Five Forces Analysis
3.5 Industry Value Chain Analysis
3.6 Ecosystem
3.7 Regulatory Landscape
3.8 Price Trend Analysis
3.9 Patent Analysis
3.10 Technology Evolution
3.11 Investment Pockets
3.12 Import-Export Analysis
Chapter 4: Milk Fat Fractions Market by Melting Fractions (2018-2032)
4.1 Milk Fat Fractions Market Snapshot and Growth Engine
4.2 Market Overview
4.3 Rigid
4.3.1 Introduction and Market Overview
4.3.2 Historic and Forecasted Market Size in Value USD and Volume Units
4.3.3 Key Market Trends, Growth Factors, and Opportunities
4.3.4 Geographic Segmentation Analysis
4.4 Semi-rigid
4.5 Flexible
Chapter 5: Milk Fat Fractions Market by Form (2018-2032)
5.1 Milk Fat Fractions Market Snapshot and Growth Engine
5.2 Market Overview
5.3 Solid
5.3.1 Introduction and Market Overview
5.3.2 Historic and Forecasted Market Size in Value USD and Volume Units
5.3.3 Key Market Trends, Growth Factors, and Opportunities
5.3.4 Geographic Segmentation Analysis
5.4 Liquid
Chapter 6: Milk Fat Fractions Market by Technology (2018-2032)
6.1 Milk Fat Fractions Market Snapshot and Growth Engine
6.2 Market Overview
6.3 Crystallization from Melted Milk Fat
6.3.1 Introduction and Market Overview
6.3.2 Historic and Forecasted Market Size in Value USD and Volume Units
6.3.3 Key Market Trends, Growth Factors, and Opportunities
6.3.4 Geographic Segmentation Analysis
6.4 Crystallization Using Solvents
6.5 Supercritical Fluid Extraction
6.6 Short Path Distillation
Chapter 7: Milk Fat Fractions Market by Application (2018-2032)
7.1 Milk Fat Fractions Market Snapshot and Growth Engine
7.2 Market Overview
7.3 Bakery & Confectionery
7.3.1 Introduction and Market Overview
7.3.2 Historic and Forecasted Market Size in Value USD and Volume Units
7.3.3 Key Market Trends, Growth Factors, and Opportunities
7.3.4 Geographic Segmentation Analysis
7.4 Cold Spreadable Butter
7.5 Nutraceuticals
7.6 Infant Nutrition
7.7 Cosmetics
Chapter 8: Company Profiles and Competitive Analysis
8.1 Competitive Landscape
8.1.1 Competitive Benchmarking
8.1.2 Milk Fat Fractions Market Share by Manufacturer (2024)
8.1.3 Industry BCG Matrix
8.1.4 Heat Map Analysis
8.1.5 Mergers and Acquisitions
8.2 FRESHCAP MUSHROOMS LTD. (CANADA)
8.2.1 Company Overview
8.2.2 Key Executives
8.2.3 Company Snapshot
8.2.4 Role of the Company in the Market
8.2.5 Sustainability and Social Responsibility
8.2.6 Operating Business Segments
8.2.7 Product Portfolio
8.2.8 Business Performance
8.2.9 Key Strategic Moves and Recent Developments
8.2.10 SWOT Analysis
8.3 BANKEN CHAMPIGNONS B.V. (NETHERLANDS)
8.4 FAR WEST FUNGI (U.S.)
8.5 SWADESHI MUSHROOM (INDIA)
8.6 DXN (MALAYSIA)
8.7 NIKKEI MARKETING LIMITED (CANADA)
8.8 CHAGA MOUNTAIN INC (U.S.)
8.9 ASIA PACIFIC FARM ENTERPRISES (CANADA)
8.10 NC EXOTIC MUSHROOMS (NETHERLANDS)
8.11 BONDUELLE SA (FRANCE)
8.12 NAMMEX (CANADA)
8.13 NATURALIN (CHINA)
8.14 REAL MUSHROOMS (CANADA)
8.15 MITOKU (JAPAN)
8.16 HIRANO MUSHROOM LLC (SERBIA)
8.17 GOURMET MUSHROOMS INC. (U.S.)
8.18 ALOHA MEDICINALS (U.S.)
8.19 BIO BOTANICA INC. (U.S.)
8.20 CONCORD FARMS (U.S.)
8.21 FOUR SIGMATIC FOODS INC. (U.S.)
8.22 NATURE’S WAY PRODUCTS LLC (U.S.)
8.23 ORIVEDA BV (NETHERLANDS)
Chapter 9: Global Milk Fat Fractions Market By Region
9.1 Overview
9.2. North America Milk Fat Fractions Market
9.2.1 Key Market Trends, Growth Factors and Opportunities
9.2.2 Top Key Companies
9.2.3 Historic and Forecasted Market Size by Segments
9.2.4 Historic and Forecasted Market Size by Melting Fractions
9.2.4.1 Rigid
9.2.4.2 Semi-rigid
9.2.4.3 Flexible
9.2.5 Historic and Forecasted Market Size by Form
9.2.5.1 Solid
9.2.5.2 Liquid
9.2.6 Historic and Forecasted Market Size by Technology
9.2.6.1 Crystallization from Melted Milk Fat
9.2.6.2 Crystallization Using Solvents
9.2.6.3 Supercritical Fluid Extraction
9.2.6.4 Short Path Distillation
9.2.7 Historic and Forecasted Market Size by Application
9.2.7.1 Bakery & Confectionery
9.2.7.2 Cold Spreadable Butter
9.2.7.3 Nutraceuticals
9.2.7.4 Infant Nutrition
9.2.7.5 Cosmetics
9.2.8 Historic and Forecast Market Size by Country
9.2.8.1 US
9.2.8.2 Canada
9.2.8.3 Mexico
9.3. Eastern Europe Milk Fat Fractions Market
9.3.1 Key Market Trends, Growth Factors and Opportunities
9.3.2 Top Key Companies
9.3.3 Historic and Forecasted Market Size by Segments
9.3.4 Historic and Forecasted Market Size by Melting Fractions
9.3.4.1 Rigid
9.3.4.2 Semi-rigid
9.3.4.3 Flexible
9.3.5 Historic and Forecasted Market Size by Form
9.3.5.1 Solid
9.3.5.2 Liquid
9.3.6 Historic and Forecasted Market Size by Technology
9.3.6.1 Crystallization from Melted Milk Fat
9.3.6.2 Crystallization Using Solvents
9.3.6.3 Supercritical Fluid Extraction
9.3.6.4 Short Path Distillation
9.3.7 Historic and Forecasted Market Size by Application
9.3.7.1 Bakery & Confectionery
9.3.7.2 Cold Spreadable Butter
9.3.7.3 Nutraceuticals
9.3.7.4 Infant Nutrition
9.3.7.5 Cosmetics
9.3.8 Historic and Forecast Market Size by Country
9.3.8.1 Russia
9.3.8.2 Bulgaria
9.3.8.3 The Czech Republic
9.3.8.4 Hungary
9.3.8.5 Poland
9.3.8.6 Romania
9.3.8.7 Rest of Eastern Europe
9.4. Western Europe Milk Fat Fractions Market
9.4.1 Key Market Trends, Growth Factors and Opportunities
9.4.2 Top Key Companies
9.4.3 Historic and Forecasted Market Size by Segments
9.4.4 Historic and Forecasted Market Size by Melting Fractions
9.4.4.1 Rigid
9.4.4.2 Semi-rigid
9.4.4.3 Flexible
9.4.5 Historic and Forecasted Market Size by Form
9.4.5.1 Solid
9.4.5.2 Liquid
9.4.6 Historic and Forecasted Market Size by Technology
9.4.6.1 Crystallization from Melted Milk Fat
9.4.6.2 Crystallization Using Solvents
9.4.6.3 Supercritical Fluid Extraction
9.4.6.4 Short Path Distillation
9.4.7 Historic and Forecasted Market Size by Application
9.4.7.1 Bakery & Confectionery
9.4.7.2 Cold Spreadable Butter
9.4.7.3 Nutraceuticals
9.4.7.4 Infant Nutrition
9.4.7.5 Cosmetics
9.4.8 Historic and Forecast Market Size by Country
9.4.8.1 Germany
9.4.8.2 UK
9.4.8.3 France
9.4.8.4 The Netherlands
9.4.8.5 Italy
9.4.8.6 Spain
9.4.8.7 Rest of Western Europe
9.5. Asia Pacific Milk Fat Fractions Market
9.5.1 Key Market Trends, Growth Factors and Opportunities
9.5.2 Top Key Companies
9.5.3 Historic and Forecasted Market Size by Segments
9.5.4 Historic and Forecasted Market Size by Melting Fractions
9.5.4.1 Rigid
9.5.4.2 Semi-rigid
9.5.4.3 Flexible
9.5.5 Historic and Forecasted Market Size by Form
9.5.5.1 Solid
9.5.5.2 Liquid
9.5.6 Historic and Forecasted Market Size by Technology
9.5.6.1 Crystallization from Melted Milk Fat
9.5.6.2 Crystallization Using Solvents
9.5.6.3 Supercritical Fluid Extraction
9.5.6.4 Short Path Distillation
9.5.7 Historic and Forecasted Market Size by Application
9.5.7.1 Bakery & Confectionery
9.5.7.2 Cold Spreadable Butter
9.5.7.3 Nutraceuticals
9.5.7.4 Infant Nutrition
9.5.7.5 Cosmetics
9.5.8 Historic and Forecast Market Size by Country
9.5.8.1 China
9.5.8.2 India
9.5.8.3 Japan
9.5.8.4 South Korea
9.5.8.5 Malaysia
9.5.8.6 Thailand
9.5.8.7 Vietnam
9.5.8.8 The Philippines
9.5.8.9 Australia
9.5.8.10 New Zealand
9.5.8.11 Rest of APAC
9.6. Middle East & Africa Milk Fat Fractions Market
9.6.1 Key Market Trends, Growth Factors and Opportunities
9.6.2 Top Key Companies
9.6.3 Historic and Forecasted Market Size by Segments
9.6.4 Historic and Forecasted Market Size by Melting Fractions
9.6.4.1 Rigid
9.6.4.2 Semi-rigid
9.6.4.3 Flexible
9.6.5 Historic and Forecasted Market Size by Form
9.6.5.1 Solid
9.6.5.2 Liquid
9.6.6 Historic and Forecasted Market Size by Technology
9.6.6.1 Crystallization from Melted Milk Fat
9.6.6.2 Crystallization Using Solvents
9.6.6.3 Supercritical Fluid Extraction
9.6.6.4 Short Path Distillation
9.6.7 Historic and Forecasted Market Size by Application
9.6.7.1 Bakery & Confectionery
9.6.7.2 Cold Spreadable Butter
9.6.7.3 Nutraceuticals
9.6.7.4 Infant Nutrition
9.6.7.5 Cosmetics
9.6.8 Historic and Forecast Market Size by Country
9.6.8.1 Turkiye
9.6.8.2 Bahrain
9.6.8.3 Kuwait
9.6.8.4 Saudi Arabia
9.6.8.5 Qatar
9.6.8.6 UAE
9.6.8.7 Israel
9.6.8.8 South Africa
9.7. South America Milk Fat Fractions Market
9.7.1 Key Market Trends, Growth Factors and Opportunities
9.7.2 Top Key Companies
9.7.3 Historic and Forecasted Market Size by Segments
9.7.4 Historic and Forecasted Market Size by Melting Fractions
9.7.4.1 Rigid
9.7.4.2 Semi-rigid
9.7.4.3 Flexible
9.7.5 Historic and Forecasted Market Size by Form
9.7.5.1 Solid
9.7.5.2 Liquid
9.7.6 Historic and Forecasted Market Size by Technology
9.7.6.1 Crystallization from Melted Milk Fat
9.7.6.2 Crystallization Using Solvents
9.7.6.3 Supercritical Fluid Extraction
9.7.6.4 Short Path Distillation
9.7.7 Historic and Forecasted Market Size by Application
9.7.7.1 Bakery & Confectionery
9.7.7.2 Cold Spreadable Butter
9.7.7.3 Nutraceuticals
9.7.7.4 Infant Nutrition
9.7.7.5 Cosmetics
9.7.8 Historic and Forecast Market Size by Country
9.7.8.1 Brazil
9.7.8.2 Argentina
9.7.8.3 Rest of SA
Chapter 10 Analyst Viewpoint and Conclusion
10.1 Recommendations and Concluding Analysis
10.2 Potential Market Strategies
Chapter 11 Research Methodology
11.1 Research Process
11.2 Primary Research
11.3 Secondary Research
|
Milk Fat Fractions Market |
|||
|
Base Year: |
2024 |
Forecast Period: |
2025-2032 |
|
Historical Data: |
2018 to 2023 |
Market Size in 2024: |
USD 13.48 Bn. |
|
Forecast Period 2024-32 CAGR: |
5.59% |
Market Size in 2032: |
USD 20.84 Bn. |
|
Segments Covered: |
By Melting Fractions |
|
|
|
By Form |
|
||
|
By Technology |
|
||
|
By Application |
|
||
|
By Region |
|
||
|
Key Market Drivers: |
|
||
|
Key Market Restraints: |
|
||
|
Key Opportunities: |
|
||
|
Companies Covered in the report: |
|
||


