


Liquid Fertilizer Market Synopsis
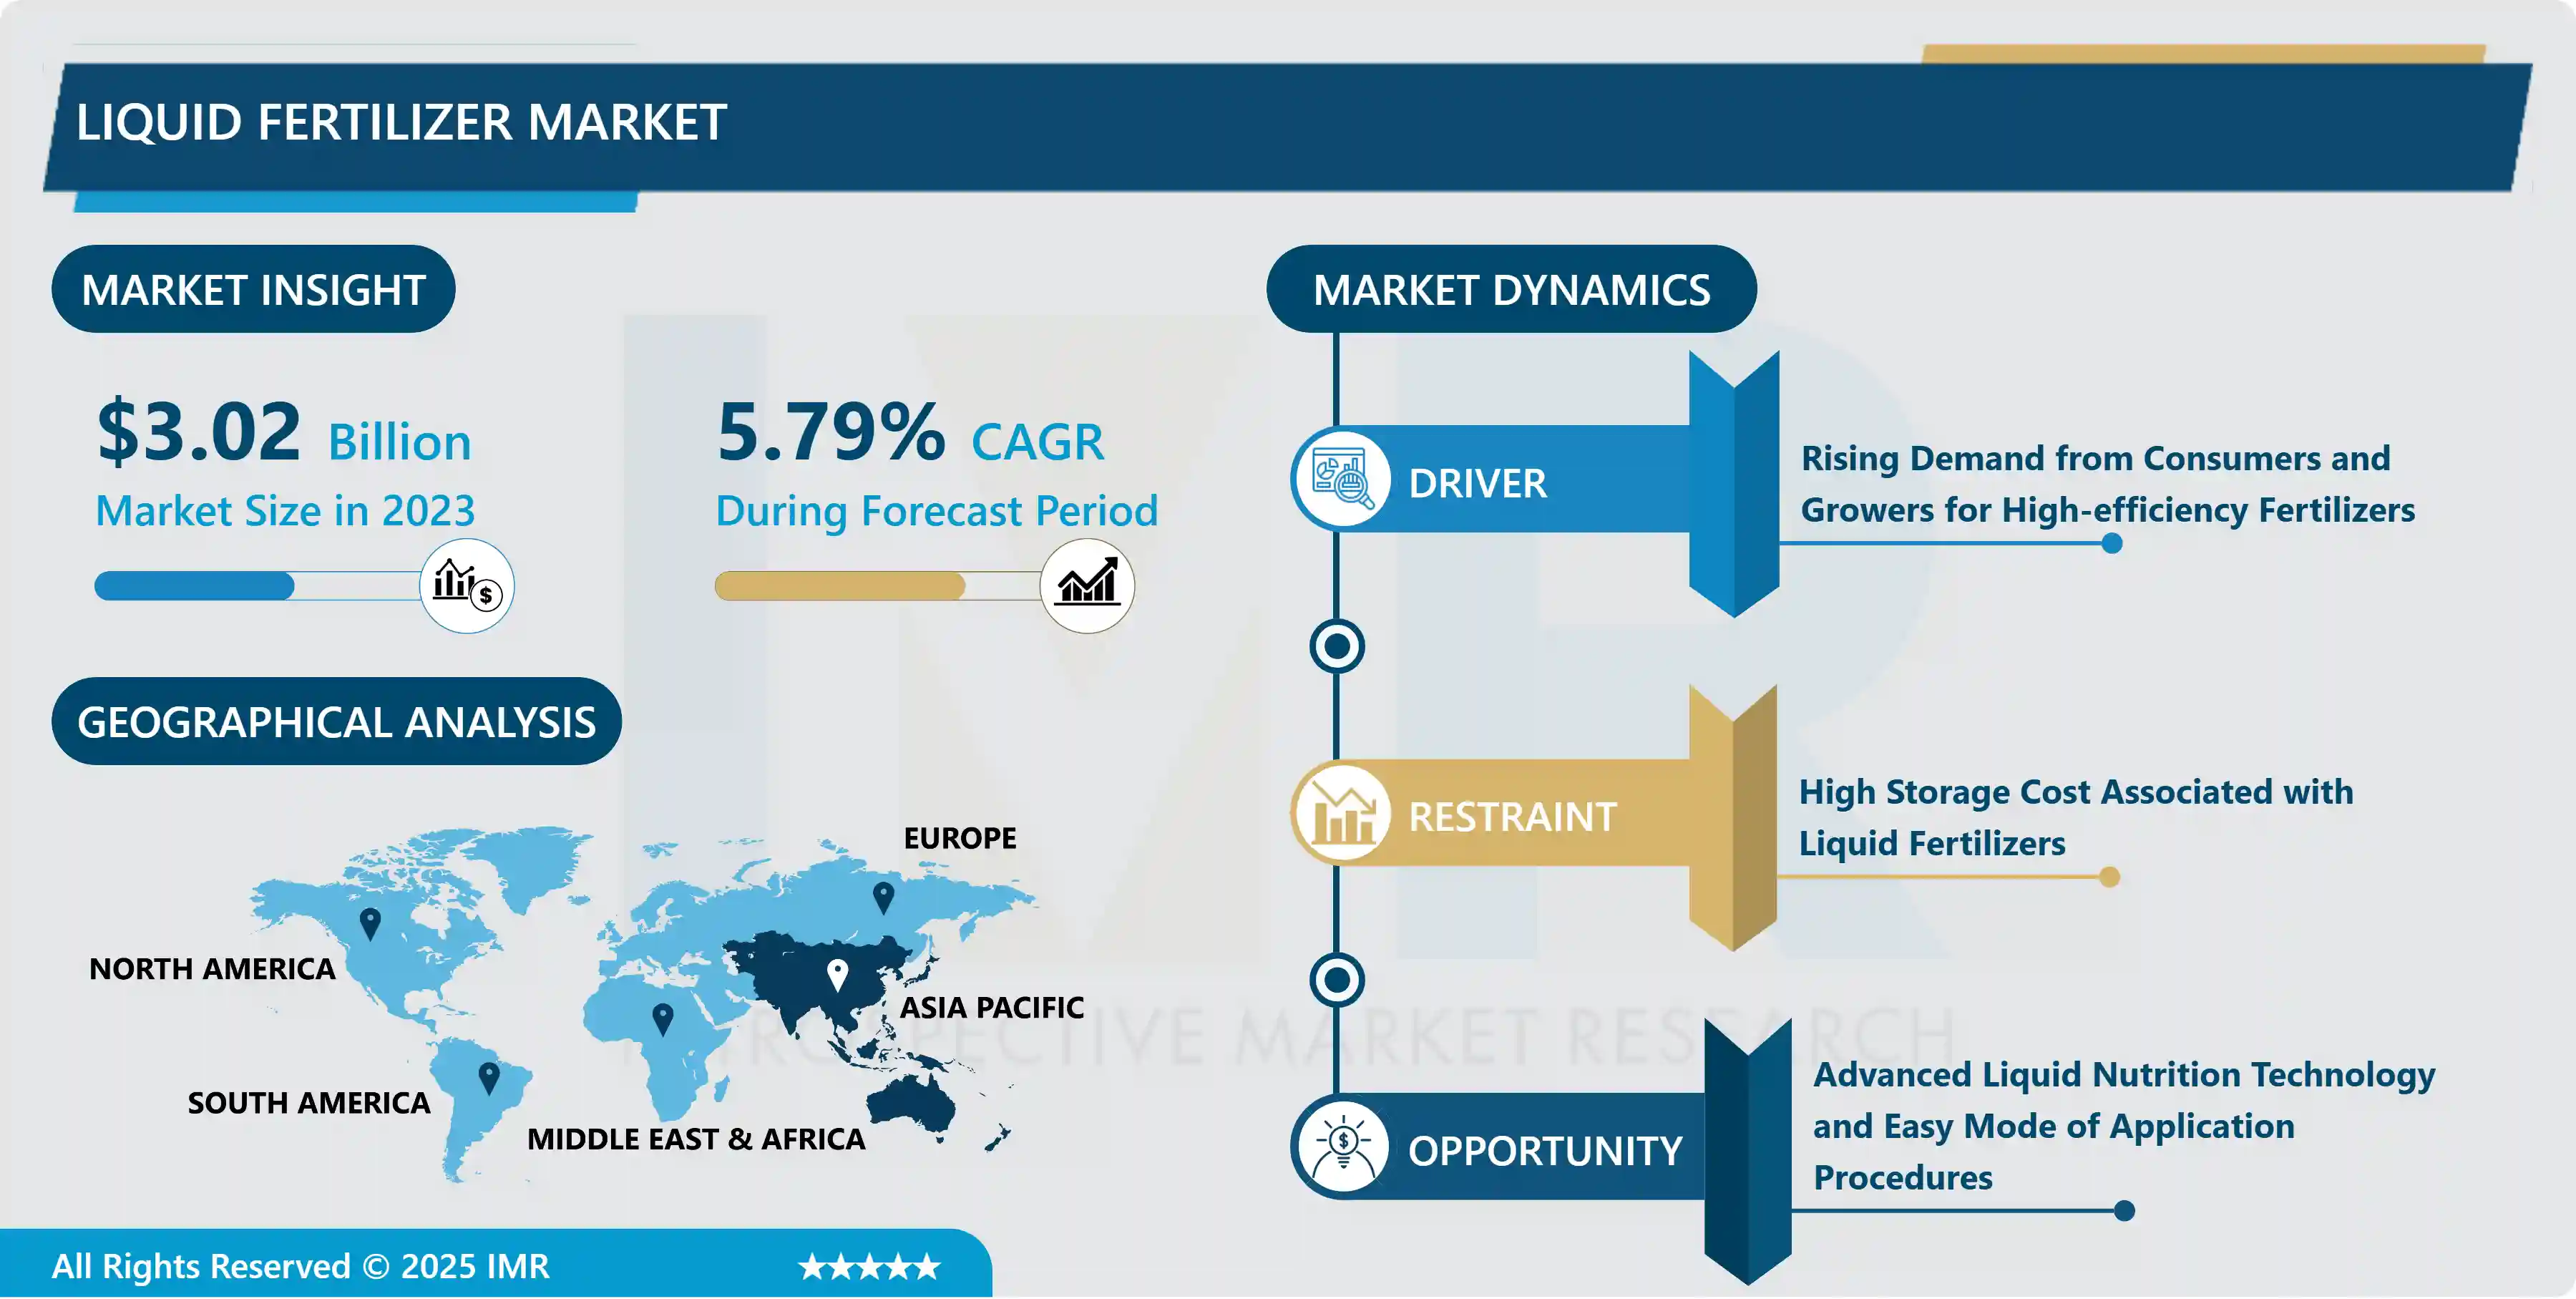
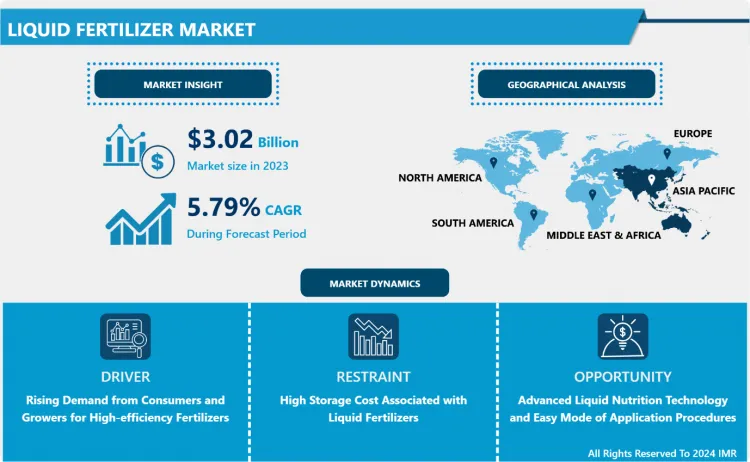
Liquid Fertilizer Market size is expected to grow from USD 3.02 Billion in 2023 to USD 5.01 billion by 2032, at a CAGR of 5.79% during the forecast period (2024-2032).
Liquid fertilizer is a concentrated and nutrient-rich solution designed to enrich plants and improve soil fertility. Formulated with crucial elements such as nitrogen, phosphorus, potassium, and micronutrients, it readily dissolves in water, allowing for application through irrigation or foliar spraying. Liquid fertilizers facilitate rapid absorption by plants, fostering efficient growth and development. Widely utilized in agriculture, horticulture, and gardening, these fertilizers serve to augment soil nutrient content and cater to the distinctive nutritional needs of crops.
Liquid Fertilizers are effective extracts of soluble chemicals and powders that consist of a mixture of potassium, phosphorus, and nitrogen. They also comprise several insecticides, fungicides, weed killers as well as wetting agents, which are designed to boost plant growth. Liquid fertilizers include hydrous liquid ammonia, nitrogenous fertilizers, aqueous ammonia, concentrated solutions of ammonium nitrate and urea, ammoniates, as well as some of the complex fertilizers that are vital for soil nutrition.
The majority of growers all across the world seek high-quality soil and nutrition in their fields during cultivation. Liquid fertilizers help farmers in increasing soil efficiency as well as enhancing overall agricultural produce. Growing demand for enhanced and efficient fertilizers, rapid adoption of sustainable methods of farming, simplicity of use, and ensuring food security are major factors that are projected to boost the market growth of liquid fertilizers over the forecasted timeframe.
 Liquid Fertilizer Market Trend Analysis:
Rising Demand from Consumers and Growers for High-efficiency Fertilizers
- The growing demand from consumers for high-quality food and the development of highly effective liquid fertilizers has led to the expansion of the liquid fertilizer market over the decades. There has been observed an increase in awareness among consumers regarding food safety and security. Moreover, crop nutrition is primarily becoming important in both commercials as well as food crops owing to the vast environmental and economic considerations. As a result, fertilizers with high efficiency such as liquid fertilizers are gaining popularity. High-efficiency fertilizers are effective in saving time and labor costs, and it ensures that the crops receive nutrients in a specified amount at the right place and at the right time, by reducing minimum wastage.
- The demand for such enhanced and high-efficiency fertilizers is also rising substantially in the agriculture industry, especially in the cereals, grains, and industrial crops. This can be attributed to the emergence of low-cost polymer coating technologies as well as new urease inhibitors. Furthermore, the application of liquid fertilizers helps in decreasing the negative impact of nutrients by leaching them into the water reservoirs. Liquid fertilizer offers easy access to nutrients as it soaks directly into the soil when compared with granular forms, thereby driving market growth in the upcoming years.
Advanced Liquid Nutrition Technology and Easy Mode of Application Procedures
- Due to the increase in the global population, there is a rising global need for food, which has significantly increased the use of high-efficiency fertilizers, especially liquid fertilizers, in farming. Liquid fertilizers make a substantial contribution to total production and food security. Over the years, the demand for high-efficiency fertilizers has been significantly impacted by the desire to increase food security in the world. For instance, Greenmaster Liquid and Sportsmaster Liquid fertilizers by ICL, use innovative liquid nutrition technology and contain the company's exclusive TMax nutrient-uptake activator.
- TMax is a combination of surface-active agents (surfactants), nutrient-uptake accelerators, vitamins, and chelating agents that increases the effectiveness of fertilizer uptake. With an equally distributed application, Greenmaster Liquid provides enhanced liquid nutrition intending to maximize nutrient uptake. As a result, unlike other forms of fertilizers, liquid fertilizers are predicted to experience growth as one of the most effective fertilizers that can provide cost-effective yields under a diversity of agro-climatic conditions. The above-mentioned factors are expected to create lucrative opportunities for market players over the analysis period.
Liquid Fertilizer Market Segment Analysis:
Liquid Fertilizer Market is Segmented Based on Nutrient Type, Mode of Application, Major Compound, and Crop Type.
By Nutrient Type, Nitrogen segment is expected to dominate the market during the forecast period
- By Nutrient Type, the nitrogen segment is anticipated to lead the growth of the liquid fertilizers market. Nitrogen is the majorly consumed nutrient among all the micro and macro elements needed for the ultimate plant growth. Nitrogen is also essential in building amino acids, which further produce proteins, and performs almost every biochemical reaction performed in a plant. Inadequate nitrogen (N) availability in the field soil is a major problem that farmers face while crop cultivation. Thus, the application of additional liquid nitrogen fertilization is the ultimate solution to eradicate this problem, which further drives the segment growth.
Liquid Fertilizer Market Regional Insights:
Asia Pacific is Expected to Dominate the Market Over the Forecast period
- The Asia Pacific region is anticipated to dominate the liquid fertilizers market over the forecasted period. The Asia Pacific is undoubtedly the largest market for liquid fertilizer owing to the rising prices of traditional fertilizers and their negative impact on environmental conditions. These have also resulted in the massive growth in the utilization of high-efficiency fertilizers such as liquid potassium fertilizers for crop production. The growing demand from consumers & growers for high-quality food, high crop yield, and advancements in automated systems for irrigation are the primary factors that drive the market growth in the Asia Pacific region. China holds the largest market share whereas Australia is estimated to grow rapidly in the upcoming years. Moreover, the rapid population growth, government initiatives, and international support to boost agricultural production are thereby estimated to generate huge growth opportunities in this region.
- The liquid fertilizers market in the North American region is expected to develop at fastest CAGR over the studied period. The growth in this region can be attributed to the presence of a diverse variety of liquid fertilizer manufacturers in this region, as well as the availability of distribution channels and manufacturing facilities. Moreover, the increasing knowledge and awareness regarding the utilization of organic liquid fertilizers, and the growing demand for high-value goods are estimated to expand the growth of liquid fertilizers in the North American region. Urea is the major liquid nitrogenous fertilizer used in this region. Further, rapid growth is been observed in the liquid micronutrient segment of the North American liquid fertilizer market owing to the growing demand for food grains and increasing soil deficiency.
Top Key Players Covered In Liquid Fertilizer Market
- The Scotts Miracle-Gro Company (US)
- Sigma AgriScience LLC (US)
- The Mosaic Company (US)
- Nutrien Ltd. (Canada)
- ILSA S.p.A. (Italy)
- Italpollina S.p.A. (Italy)
- Yara International ASA (Norway)
- EuroChem Group (Switzerland)
- Israel Chemical Ltd. (Israel)
- Tata Chemicals Ltd (India)
- Ajay Farm-Chem Private Limited (India)
- Balaji Fertilizers Private Limited (India)
- Deepak Fertilizers and Petrochemicals Corporation Limited (India)
- Bharat Fertilizer Industries Limited (India)
- Coromandel Fertilizers Limited (India), and other major players.
Key Industry Development In The Liquid Fertilizer Market:
- In January 2023, Canadian fertilizer giant Nutrien Ltd. acquired Agrochem International, a leading distributor of liquid fertilizers in Brazil, for $480 million. This move strengthens Nutrien's position in the Brazilian market and expands its reach to key agricultural regions.
- In June 2023, US fertilizer producer CF Industries announced plans to build a new $1.5 billion liquid fertilizer plant in Louisiana. This investment is expected to increase CF Industries' production capacity and meet the growing demand for liquid fertilizers in the US market.
- In July 2023, Norwegian fertilizer company Yara International acquired Compass Minerals' Plant Nutrition business for $335 million. This acquisition expands Yara's portfolio of liquid fertilizers and specialty products in North America.
|
Liquid Fertilizer Market |
|||
|
Base Year: |
2023 |
Forecast Period: |
2024-2032 |
|
Historical Data: |
2017 to 2023 |
Market Size in 2023: |
USD 3.02 Bn. |
|
Forecast Period 2024-32 CAGR: |
5.79% |
Market Size in 2032: |
USD 5.01 Bn. |
|
Segments Covered: |
By Nutrient Type |
|
|
|
By Mode of Application |
|
||
|
By Major Compound |
|
||
|
By Crop Type |
|
||
|
By Region |
|
||
|
Key Market Drivers: |
|
||
|
Key Market Restraints: |
|
||
|
Key Opportunities: |
|
||
|
Companies Covered in the report: |
|
||
Chapter 1: Introduction
1.1 Scope and Coverage
Chapter 2:Executive Summary
Chapter 3: Market Landscape
3.1 Market Dynamics
3.1.1 Drivers
3.1.2 Restraints
3.1.3 Opportunities
3.1.4 Challenges
3.2 Market Trend Analysis
3.3 PESTLE Analysis
3.4 Porter's Five Forces Analysis
3.5 Industry Value Chain Analysis
3.6 Ecosystem
3.7 Regulatory Landscape
3.8 Price Trend Analysis
3.9 Patent Analysis
3.10 Technology Evolution
3.11 Investment Pockets
3.12 Import-Export Analysis
Chapter 4: Liquid Fertilizer Market by Nutrient Type (2018-2032)
4.1 Liquid Fertilizer Market Snapshot and Growth Engine
4.2 Market Overview
4.3 Nitrogen
4.3.1 Introduction and Market Overview
4.3.2 Historic and Forecasted Market Size in Value USD and Volume Units
4.3.3 Key Market Trends, Growth Factors, and Opportunities
4.3.4 Geographic Segmentation Analysis
4.4 Phosphorus
4.5 Potassium
4.6 Micronutrients
Chapter 5: Liquid Fertilizer Market by Mode of Application (2018-2032)
5.1 Liquid Fertilizer Market Snapshot and Growth Engine
5.2 Market Overview
5.3 Soil
5.3.1 Introduction and Market Overview
5.3.2 Historic and Forecasted Market Size in Value USD and Volume Units
5.3.3 Key Market Trends, Growth Factors, and Opportunities
5.3.4 Geographic Segmentation Analysis
5.4 Foliar
5.5 Fertigation
Chapter 6: Liquid Fertilizer Market by Major Compound (2018-2032)
6.1 Liquid Fertilizer Market Snapshot and Growth Engine
6.2 Market Overview
6.3 CAN
6.3.1 Introduction and Market Overview
6.3.2 Historic and Forecasted Market Size in Value USD and Volume Units
6.3.3 Key Market Trends, Growth Factors, and Opportunities
6.3.4 Geographic Segmentation Analysis
6.4 UAN
6.5 MAP
6.6 DAP
6.7 Potassium Nitrate
Chapter 7: Liquid Fertilizer Market by Crop Type (2018-2032)
7.1 Liquid Fertilizer Market Snapshot and Growth Engine
7.2 Market Overview
7.3 Grains & Cereals
7.3.1 Introduction and Market Overview
7.3.2 Historic and Forecasted Market Size in Value USD and Volume Units
7.3.3 Key Market Trends, Growth Factors, and Opportunities
7.3.4 Geographic Segmentation Analysis
7.4 Fruits & Vegetables
7.5 Oilseeds & Pulses
7.6 Others
Chapter 8: Company Profiles and Competitive Analysis
8.1 Competitive Landscape
8.1.1 Competitive Benchmarking
8.1.2 Liquid Fertilizer Market Share by Manufacturer (2024)
8.1.3 Industry BCG Matrix
8.1.4 Heat Map Analysis
8.1.5 Mergers and Acquisitions
8.2 BAYER AG
8.2.1 Company Overview
8.2.2 Key Executives
8.2.3 Company Snapshot
8.2.4 Role of the Company in the Market
8.2.5 Sustainability and Social Responsibility
8.2.6 Operating Business Segments
8.2.7 Product Portfolio
8.2.8 Business Performance
8.2.9 Key Strategic Moves and Recent Developments
8.2.10 SWOT Analysis
8.3 CORTEVA AGRISCIENCE
8.4 DLF
8.5 ROYAL BARENBRUG GROUP
8.6 SYNGENTA GROUP
8.7 AMPAC SEED COMPANY
8.8 KWS SAAT SE & CO. KGAA
8.9 LAND O’LAKES INCRAGT GROUP
8.10 S&W SEED COAL DAHRA ACX GLOBAL INCBORDER VALLEY
8.11 STANDLEE HAY COMPANY
8.12 ALFALFA MONEGROS
8.13 ANDERSON HAY AND GRAIN CO. INCHAY USA INCPACIFIC COAST PRODUCERS
8.14 TIMOTHY HAY COMPANY
8.15 THE GAVILON GROUP LLC
8.16 INTERSTATE COMMODITIES INCAND OTHER ACTIVE PLAYER.
Chapter 9: Global Liquid Fertilizer Market By Region
9.1 Overview
9.2. North America Liquid Fertilizer Market
9.2.1 Key Market Trends, Growth Factors and Opportunities
9.2.2 Top Key Companies
9.2.3 Historic and Forecasted Market Size by Segments
9.2.4 Historic and Forecasted Market Size by Nutrient Type
9.2.4.1 Nitrogen
9.2.4.2 Phosphorus
9.2.4.3 Potassium
9.2.4.4 Micronutrients
9.2.5 Historic and Forecasted Market Size by Mode of Application
9.2.5.1 Soil
9.2.5.2 Foliar
9.2.5.3 Fertigation
9.2.6 Historic and Forecasted Market Size by Major Compound
9.2.6.1 CAN
9.2.6.2 UAN
9.2.6.3 MAP
9.2.6.4 DAP
9.2.6.5 Potassium Nitrate
9.2.7 Historic and Forecasted Market Size by Crop Type
9.2.7.1 Grains & Cereals
9.2.7.2 Fruits & Vegetables
9.2.7.3 Oilseeds & Pulses
9.2.7.4 Others
9.2.8 Historic and Forecast Market Size by Country
9.2.8.1 US
9.2.8.2 Canada
9.2.8.3 Mexico
9.3. Eastern Europe Liquid Fertilizer Market
9.3.1 Key Market Trends, Growth Factors and Opportunities
9.3.2 Top Key Companies
9.3.3 Historic and Forecasted Market Size by Segments
9.3.4 Historic and Forecasted Market Size by Nutrient Type
9.3.4.1 Nitrogen
9.3.4.2 Phosphorus
9.3.4.3 Potassium
9.3.4.4 Micronutrients
9.3.5 Historic and Forecasted Market Size by Mode of Application
9.3.5.1 Soil
9.3.5.2 Foliar
9.3.5.3 Fertigation
9.3.6 Historic and Forecasted Market Size by Major Compound
9.3.6.1 CAN
9.3.6.2 UAN
9.3.6.3 MAP
9.3.6.4 DAP
9.3.6.5 Potassium Nitrate
9.3.7 Historic and Forecasted Market Size by Crop Type
9.3.7.1 Grains & Cereals
9.3.7.2 Fruits & Vegetables
9.3.7.3 Oilseeds & Pulses
9.3.7.4 Others
9.3.8 Historic and Forecast Market Size by Country
9.3.8.1 Russia
9.3.8.2 Bulgaria
9.3.8.3 The Czech Republic
9.3.8.4 Hungary
9.3.8.5 Poland
9.3.8.6 Romania
9.3.8.7 Rest of Eastern Europe
9.4. Western Europe Liquid Fertilizer Market
9.4.1 Key Market Trends, Growth Factors and Opportunities
9.4.2 Top Key Companies
9.4.3 Historic and Forecasted Market Size by Segments
9.4.4 Historic and Forecasted Market Size by Nutrient Type
9.4.4.1 Nitrogen
9.4.4.2 Phosphorus
9.4.4.3 Potassium
9.4.4.4 Micronutrients
9.4.5 Historic and Forecasted Market Size by Mode of Application
9.4.5.1 Soil
9.4.5.2 Foliar
9.4.5.3 Fertigation
9.4.6 Historic and Forecasted Market Size by Major Compound
9.4.6.1 CAN
9.4.6.2 UAN
9.4.6.3 MAP
9.4.6.4 DAP
9.4.6.5 Potassium Nitrate
9.4.7 Historic and Forecasted Market Size by Crop Type
9.4.7.1 Grains & Cereals
9.4.7.2 Fruits & Vegetables
9.4.7.3 Oilseeds & Pulses
9.4.7.4 Others
9.4.8 Historic and Forecast Market Size by Country
9.4.8.1 Germany
9.4.8.2 UK
9.4.8.3 France
9.4.8.4 The Netherlands
9.4.8.5 Italy
9.4.8.6 Spain
9.4.8.7 Rest of Western Europe
9.5. Asia Pacific Liquid Fertilizer Market
9.5.1 Key Market Trends, Growth Factors and Opportunities
9.5.2 Top Key Companies
9.5.3 Historic and Forecasted Market Size by Segments
9.5.4 Historic and Forecasted Market Size by Nutrient Type
9.5.4.1 Nitrogen
9.5.4.2 Phosphorus
9.5.4.3 Potassium
9.5.4.4 Micronutrients
9.5.5 Historic and Forecasted Market Size by Mode of Application
9.5.5.1 Soil
9.5.5.2 Foliar
9.5.5.3 Fertigation
9.5.6 Historic and Forecasted Market Size by Major Compound
9.5.6.1 CAN
9.5.6.2 UAN
9.5.6.3 MAP
9.5.6.4 DAP
9.5.6.5 Potassium Nitrate
9.5.7 Historic and Forecasted Market Size by Crop Type
9.5.7.1 Grains & Cereals
9.5.7.2 Fruits & Vegetables
9.5.7.3 Oilseeds & Pulses
9.5.7.4 Others
9.5.8 Historic and Forecast Market Size by Country
9.5.8.1 China
9.5.8.2 India
9.5.8.3 Japan
9.5.8.4 South Korea
9.5.8.5 Malaysia
9.5.8.6 Thailand
9.5.8.7 Vietnam
9.5.8.8 The Philippines
9.5.8.9 Australia
9.5.8.10 New Zealand
9.5.8.11 Rest of APAC
9.6. Middle East & Africa Liquid Fertilizer Market
9.6.1 Key Market Trends, Growth Factors and Opportunities
9.6.2 Top Key Companies
9.6.3 Historic and Forecasted Market Size by Segments
9.6.4 Historic and Forecasted Market Size by Nutrient Type
9.6.4.1 Nitrogen
9.6.4.2 Phosphorus
9.6.4.3 Potassium
9.6.4.4 Micronutrients
9.6.5 Historic and Forecasted Market Size by Mode of Application
9.6.5.1 Soil
9.6.5.2 Foliar
9.6.5.3 Fertigation
9.6.6 Historic and Forecasted Market Size by Major Compound
9.6.6.1 CAN
9.6.6.2 UAN
9.6.6.3 MAP
9.6.6.4 DAP
9.6.6.5 Potassium Nitrate
9.6.7 Historic and Forecasted Market Size by Crop Type
9.6.7.1 Grains & Cereals
9.6.7.2 Fruits & Vegetables
9.6.7.3 Oilseeds & Pulses
9.6.7.4 Others
9.6.8 Historic and Forecast Market Size by Country
9.6.8.1 Turkiye
9.6.8.2 Bahrain
9.6.8.3 Kuwait
9.6.8.4 Saudi Arabia
9.6.8.5 Qatar
9.6.8.6 UAE
9.6.8.7 Israel
9.6.8.8 South Africa
9.7. South America Liquid Fertilizer Market
9.7.1 Key Market Trends, Growth Factors and Opportunities
9.7.2 Top Key Companies
9.7.3 Historic and Forecasted Market Size by Segments
9.7.4 Historic and Forecasted Market Size by Nutrient Type
9.7.4.1 Nitrogen
9.7.4.2 Phosphorus
9.7.4.3 Potassium
9.7.4.4 Micronutrients
9.7.5 Historic and Forecasted Market Size by Mode of Application
9.7.5.1 Soil
9.7.5.2 Foliar
9.7.5.3 Fertigation
9.7.6 Historic and Forecasted Market Size by Major Compound
9.7.6.1 CAN
9.7.6.2 UAN
9.7.6.3 MAP
9.7.6.4 DAP
9.7.6.5 Potassium Nitrate
9.7.7 Historic and Forecasted Market Size by Crop Type
9.7.7.1 Grains & Cereals
9.7.7.2 Fruits & Vegetables
9.7.7.3 Oilseeds & Pulses
9.7.7.4 Others
9.7.8 Historic and Forecast Market Size by Country
9.7.8.1 Brazil
9.7.8.2 Argentina
9.7.8.3 Rest of SA
Chapter 10 Analyst Viewpoint and Conclusion
10.1 Recommendations and Concluding Analysis
10.2 Potential Market Strategies
Chapter 11 Research Methodology
11.1 Research Process
11.2 Primary Research
11.3 Secondary Research
|
Liquid Fertilizer Market |
|||
|
Base Year: |
2023 |
Forecast Period: |
2024-2032 |
|
Historical Data: |
2017 to 2023 |
Market Size in 2023: |
USD 3.02 Bn. |
|
Forecast Period 2024-32 CAGR: |
5.79% |
Market Size in 2032: |
USD 5.01 Bn. |
|
Segments Covered: |
By Nutrient Type |
|
|
|
By Mode of Application |
|
||
|
By Major Compound |
|
||
|
By Crop Type |
|
||
|
By Region |
|
||
|
Key Market Drivers: |
|
||
|
Key Market Restraints: |
|
||
|
Key Opportunities: |
|
||
|
Companies Covered in the report: |
|
||


