


Leather Goods Market Overview
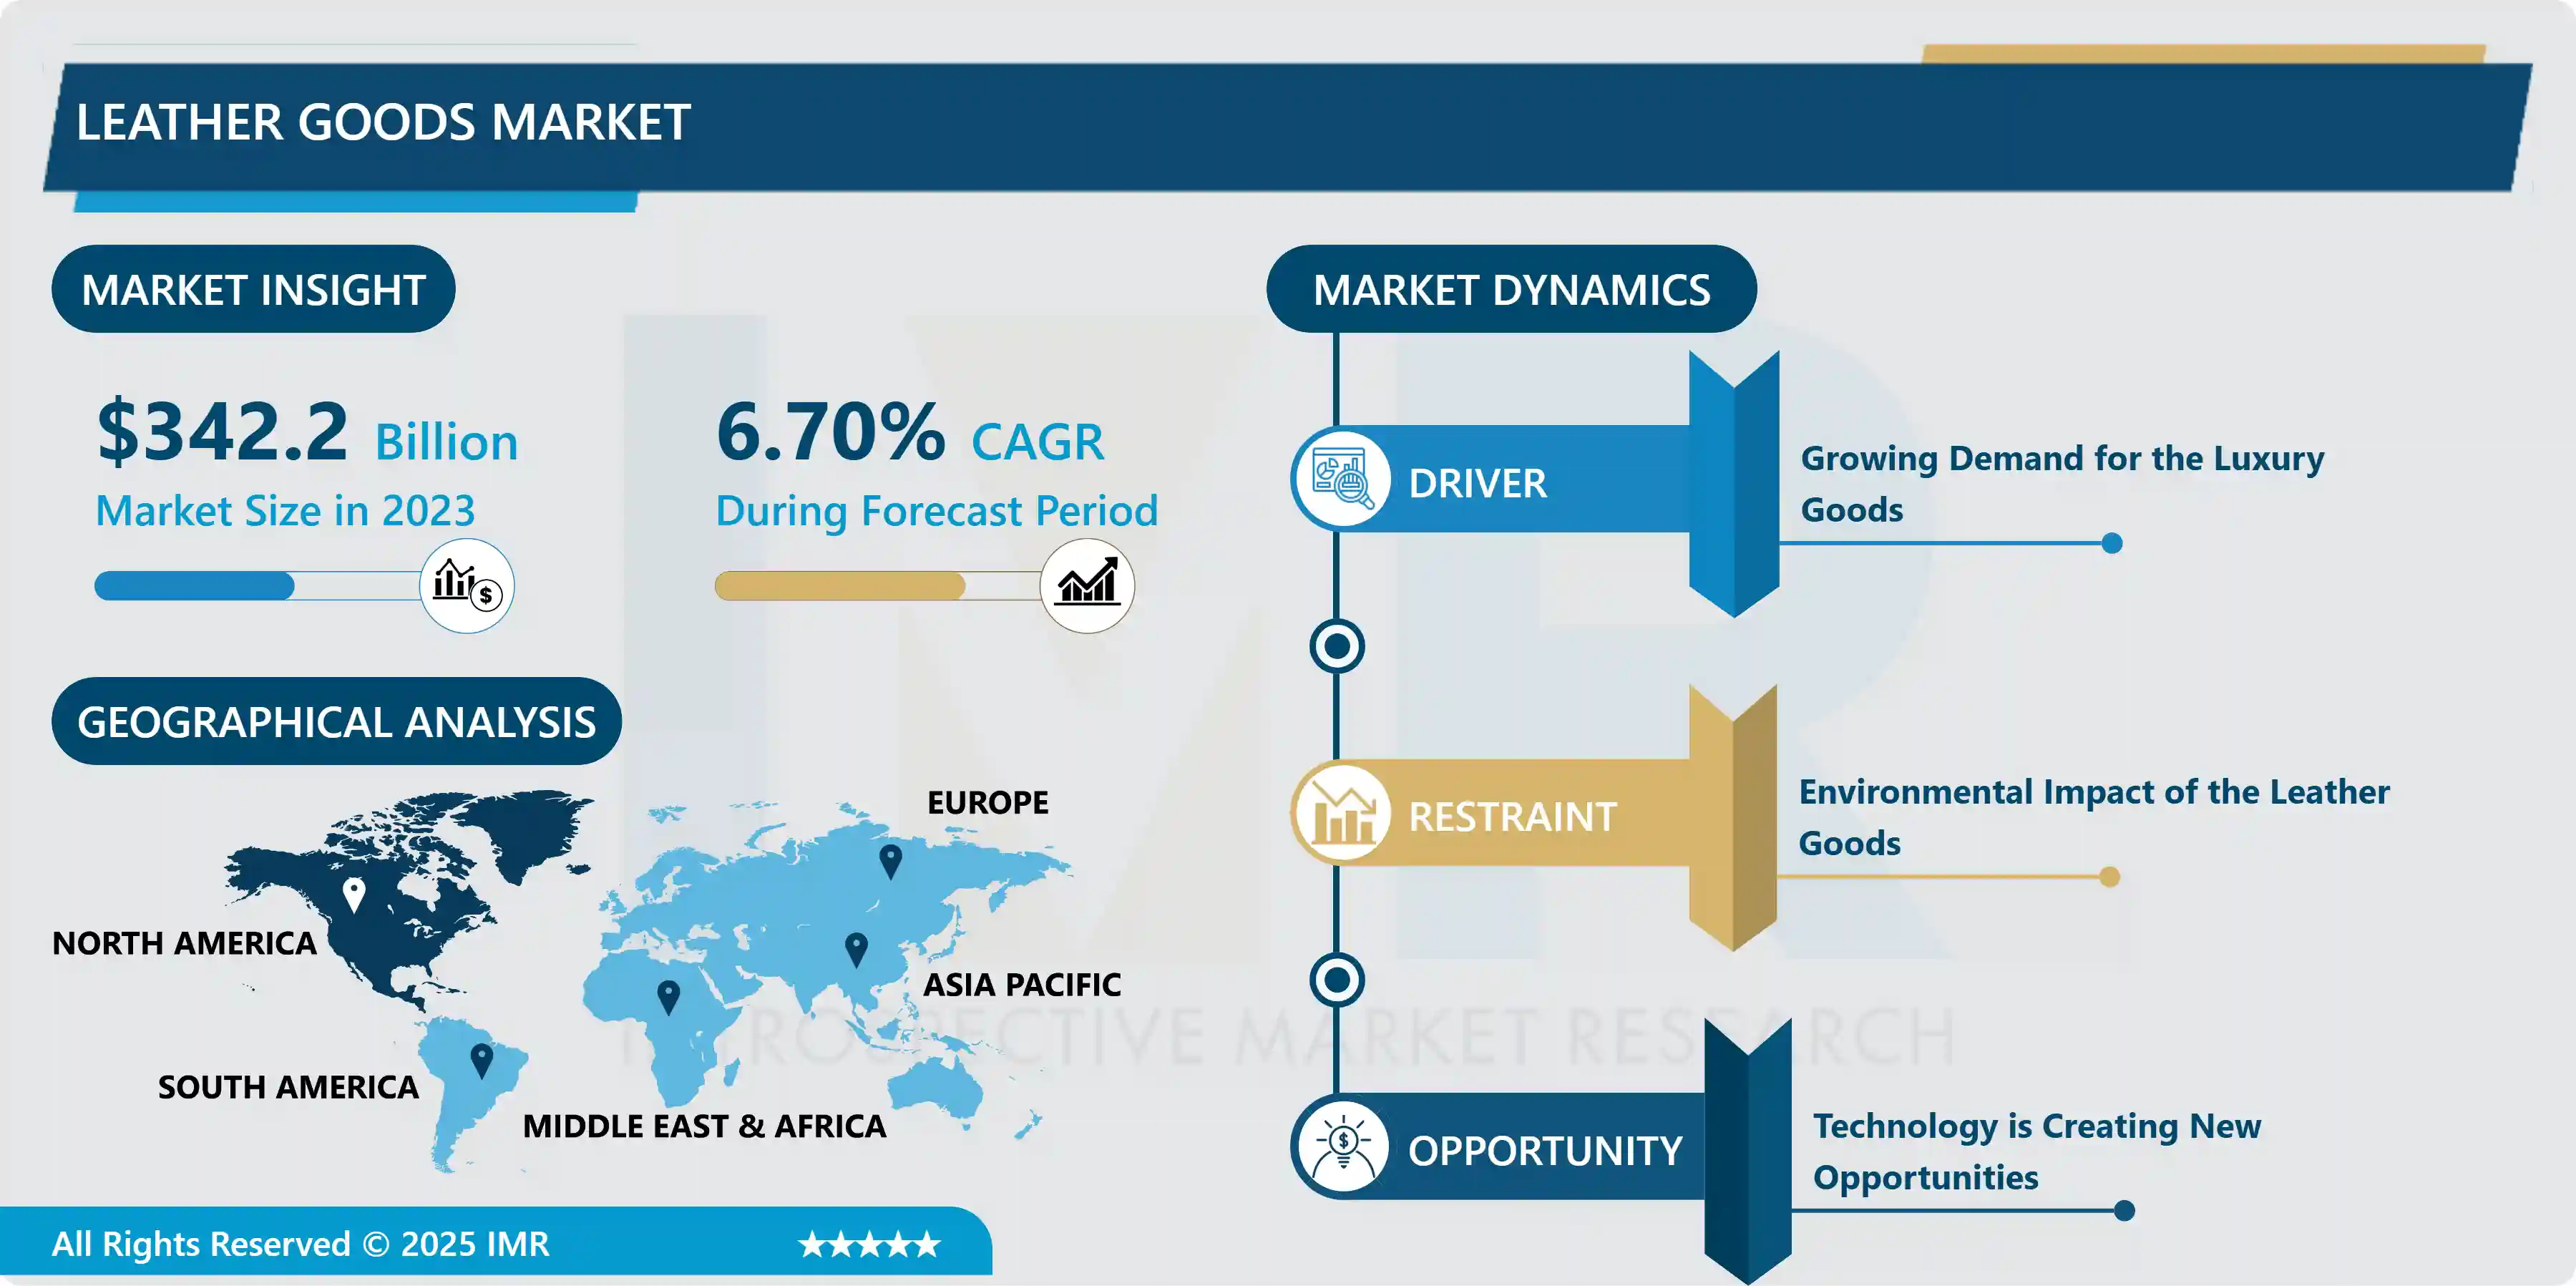
Leather Goods Market Size Was Valued at USD 342.2 Billion in 2023, and is Projected to Reach 613.42 USD Billion by 2032, Growing at a CAGR of 6.7% From 2024-2032.
Leather is a tough, flexible, and long-lasting material made by chemically treating animal skins and hides to prevent decomposition. Cattle, sheep, goats, equestrian animals, buffalo, pigs and hogs, and aquatic creatures like seals and alligators are the most prevalent sources of leather. Leather is durable and may be used to produce a wide range of goods, including clothes, footwear, and purses, furniture, tools, and sports equipment. Leather has been made for over 7,000 years, and China and India are the world's biggest manufacturers of the material today. One of the primary elements driving up demand for leather items around the world is the growing population, which is combined with rising individual income levels. Furthermore, because these items are functional, pleasant, and cost-effective, they are gaining popularity around the world. Furthermore, to suit the need of affluent consumers, major manufacturers are creating innovative and stylish items. To provide variety and customized possibilities, they are incorporating new technology into their manufacturing process, such as the automated cutting process. The expanding automobile industry additionally provides attractive prospects for market players to broaden their customer base. Leather has a rich and illustrious history extending back hundreds of years. It's a $100 billion industry that manufactures leather hides and commodities all around the world. Cow, sheep, goat, and pig hides are the most common. Shoes, clothing, and upholstery are the most popular items.

Market Dynamics And Factors For Leather Goods Market
Drivers:
Growing Demand for the Luxury Goods
- The world's leading countries for leather goods manufacturing include China, India, Brazil, Vietnam, and Italy; some are more important for value-adding and luxury goods and others for sheer volume. The production of leather goods in Europe specifically is in a steady decline, but the countries that export the largest share are Italy, France, Belgium, and Spain. With the increase in disposable income of individuals, the demand for luxury goods has also increased. These goods often symbolize a sense of accomplishment within individuals, giving them higher self-esteem. Europeans and North Americans are known to spend most on luxury goods, owing to higher household income. An upward thrust can be seen in this matter in Asian regions as well. Leather goods form a major part of luxury goods. The luxury leather products include exclusive handbags, accessories, and shoes, which appeal to affluent individuals. In the case of the personal luxury segment, leather goods are the fastest-growing segment that attracts extravagant customers. In addition, A global shortage of leather is affecting all levels of the supply chain. Manufacturing costs are rising and margins are shrinking. As supply struggles to meet demand, costs are being passed on to consumers. One example is the luxury handbags segment, in which prices are extremely high. Many manufacturers are looking for lower-cost suppliers in developing countries. There is a growing interest among male consumers in leather fashion accessories such as 'man bags', bracelets, watch straps, and belts. The trend is most popular in the United Kingdom. A result of these factors is responsible for the growth of the market over the forecast period.
Restraints:
Environmental Impact of the Leather Goods
- According to a case study published in Energy Procedia, the carbon footprint of bovine leather ranges between 65 to 150 kg CO2 per square meter. Considering that there are more than 2 billion square meters of leather produced each year, which is a devastatingly huge economic footprint. The leather industry is one of the most polluting industries. Leather processing is responsible for an unfavorable impact on the environment. The global production of leather is about 24bn m2 which presents a substantial challenge to the leather industry. The tannery effluent produces a high amount of dissolved and suspended organic and inorganic solids that are giving rise to high oxygen requirements. The unbearable smell generated from waste material and the presence of sulfide, ammonia, and other volatile compounds are associated with leather processing activities. Solid waste produced in the leather industry includes animal skin trims, animal hairs, flesh wastes, buffing dust, and keratin wastes. All of these wastes contain protein as their main component. If this protein is not utilized properly, it will responsible for dangerous pollution problems to the environment.
Opportunities:
Technology is Creating New Opportunities
- Leather manufacturers are investing in advanced automated machinery and operation systems to streamline the production process and to make it faster and cheaper. Advanced processing techniques in leather manufacturing, such as digital cutting, more complex designs, or blending with textile fabrics (e.g. silk leather) are increasing the popularity and the versatility of leather consumer goods. These technologies are paving the way for new and more complex designs, more fashionable colors, and finer quality. Improved durability, softness, lightness, and smoothness have made leather garments suitable for all seasons.
Market Segmentation
Segmentation Analysis of Leather Goods Market:
- By Type, the footwear segment is anticipated to register the maximum leather goods market growth rate over the forecast period. Nike, New Balance, Adidas, Puma, Reebok, Allbirds, and Converse are among the major athletic footwear brands that have ventured into leather athletic manufacturing in response to rising consumer demand for leather sports footwear. In 2017, Nike, Inc. introduced fly leather sneakers, a new material created by blending discarded leather scraps from tanneries with a polyester blend.
- By Distribution Channel, the online sales channel segment is anticipated to grow with a significant growth rate over the forecast period. Due to the growing popularity of e-commerce sites, the online sales platform, which now holds a modest part of the market, is predicted to rise significantly throughout the analysis period.
Regional Analysis of Leather Goods Market:
- In the worldwide leather trade, Europe is a major player. The European leather and associated goods business employs around 36,000 people and generates €48 billion in revenue. In the worldwide marketplace, the EU tanning sector is the world's largest provider of leather. In terms of leather and raw material, the EU produces some of the most valuable calfskins. According to the ministry of foreign affairs, Europe is a significant market for leather fashion accessories, with a total import value of €8.6 billion and a 5-year average growth of 7.5 percent. Carrying products are the most popular product category, followed by belts. Handbags and wallets are the most popular items in the carrying products category, with travel bags growing at the quickest rate of 15.5 percent per year. The most specialized import markets with the highest unit pricing are France and Italy. Germany, the United Kingdom, the Netherlands, and Spain are all major European leather accessory markets.
- Due to increased technical innovation and promotion of the fashion industry, Asia Pacific is expected to be the second most dominant and fastest developing region. As technology advances, more people are using high-speed internet and smartphones, resulting in increased consumption of online advertisements, which in turn drives up demand for leather goods made in this region. The Indian leather industry produces around 12.93 percent of the world's hides and skins. India's leather industry has transformed from a mere provider of raw materials to a value-added product exporter. In 2019-20, India's total leather and leather products exports totaled $5.07 billion. Increased promotion of fashion events such as fashion weeks, Asia Fashion Fair, Bridal Asia, and others are also helping to boost the business in this region.
- The market in North America is likely to develop at a substantial rate due to rising product popularity coupled with increasing online purchases, a growing number of athletes, and health and fitness-conscious individuals, all of which are expected to fuel market expansion throughout the forecast period. According to Statista, about half of consumers in North America made numerous purchases of luxury leather products (e.g. handbags, wallets, briefcases) in the third quarter of 2021, based on the results of a recent survey conducted among wealthy and high net worth individuals. In the same quarter, another 30.3 percent of shoppers made a single purchase of premium leather products. In North America, the percentage of luxury buyers who made numerous purchases of luxury leather products declined somewhat between the fourth quarter of 2020 and the third quarter of 2021.
- During the projection period, the leather goods market in the Middle East and Africa grew steadily. Vamp leather is used by enterprises in Saudi Arabia, such as Saudi Leather Industries Company, which specializes in all leather product categories and offers a large choice of leather footwear and other safety shoes. Because of their great spending capacity and long-term need for these products that reflect their social position, consumers in the region prefer luxury goods to normal ones.
- Brazil and Argentina are home to the world's greatest cow herds. Because of the nature of the raw ingredients, Latin American leathers are more roughhewn. Year after year, the luxury market in Latin America grows, frequently despite the shaky economics of some of the continent's countries, underlining the continent's importance to luxury. Despite a large number of prospective buyers, Latin countries have not made significant efforts to become luxury goods producers until recently. The numbers of local brands are now rising, presenting products with a Latin essence efficient of competing with luxury giants worldwide.
Players Covered In Leather Goods Market are:
- Adidas AG
- Nike Inc.
- Puma SE
- Fila Inc.
- New Balance Athletics Inc.
- Knoll Inc.
- Samsonite International S.A.
- VIP Industries Ltd.
- Timberland LLC
- Johnston & Murphy
- Woodland Worldwide
- Hermès International S.A.
- Louis Vuitton Malletier
- VF Corp.
- COLLAR Company
- LUCRIN Geneva
- Nappa Dori
- Saddles India Pvt. Ltd.
- Lear Corp and other major players.
Key Industry Developments In Leather Goods Market
- In June 2023, a famous luxury leather fashion manufacturer called GARRTEN launched a stunning assortment of stylish leather accessories designed for men and women. Leather backpacks of 4 different types Signature, Rolltop, Slim, and Travel and leather accessories of two kinds Dopp Wallets and Kits are a part of the recently released line. All items are made of saffiano leather or full grain. These goods are available in a dazzling selection of colors.
- In February 2023, Patina, a sister brand of Portland Leather Goods known for selling high-quality leather bags at competitive prices, has just been launched to provide clients with leather footwear and accessories. With the launch of the new brand Patina, consumers can buy leather footwear and other items from the parent firm, which has established a reputation for making excellent leather accessories at competitive prices. With the same values of artistry and affordability, our partnership with Patina will allow Portland Leather Goods consumers to purchase stylish, premium leather footwear at a cost they can feel good about.
|
Leather Goods Market |
|||
|
Base Year: |
2023 |
Forecast Period: |
2024-2032 |
|
Historical Data: |
2017 to 2023 |
Market Size in 2023: |
USD 342.2 Bn. |
|
Forecast Period 2024-32 CAGR: |
6.7 % |
Market Size in 2032: |
USD 613.42 Bn. |
|
Segments Covered: |
By Type |
|
|
|
By Distribution Channel |
|
||
|
By Region |
|
||
|
Key Market Drivers: |
|
||
|
Key Market Restraints: |
|
||
|
Key Opportunities: |
|
||
|
Companies Covered in the report: |
|
||
Chapter 1: Introduction
1.1 Scope and Coverage
Chapter 2:Executive Summary
Chapter 3: Market Landscape
3.1 Market Dynamics
3.1.1 Drivers
3.1.2 Restraints
3.1.3 Opportunities
3.1.4 Challenges
3.2 Market Trend Analysis
3.3 PESTLE Analysis
3.4 Porter's Five Forces Analysis
3.5 Industry Value Chain Analysis
3.6 Ecosystem
3.7 Regulatory Landscape
3.8 Price Trend Analysis
3.9 Patent Analysis
3.10 Technology Evolution
3.11 Investment Pockets
3.12 Import-Export Analysis
Chapter 4: Leather Goods Market by Type (2018-2032)
4.1 Leather Goods Market Snapshot and Growth Engine
4.2 Market Overview
4.3 Footwear
4.3.1 Introduction and Market Overview
4.3.2 Historic and Forecasted Market Size in Value USD and Volume Units
4.3.3 Key Market Trends, Growth Factors, and Opportunities
4.3.4 Geographic Segmentation Analysis
4.4 Luggage
4.5 Accessories
Chapter 5: Leather Goods Market by Distribution Channel (2018-2032)
5.1 Leather Goods Market Snapshot and Growth Engine
5.2 Market Overview
5.3 Offline
5.3.1 Introduction and Market Overview
5.3.2 Historic and Forecasted Market Size in Value USD and Volume Units
5.3.3 Key Market Trends, Growth Factors, and Opportunities
5.3.4 Geographic Segmentation Analysis
5.4 Online
Chapter 6: Company Profiles and Competitive Analysis
6.1 Competitive Landscape
6.1.1 Competitive Benchmarking
6.1.2 Leather Goods Market Share by Manufacturer (2024)
6.1.3 Industry BCG Matrix
6.1.4 Heat Map Analysis
6.1.5 Mergers and Acquisitions
6.2 COHERENT INC. (U.S.)
6.2.1 Company Overview
6.2.2 Key Executives
6.2.3 Company Snapshot
6.2.4 Role of the Company in the Market
6.2.5 Sustainability and Social Responsibility
6.2.6 Operating Business Segments
6.2.7 Product Portfolio
6.2.8 Business Performance
6.2.9 Key Strategic Moves and Recent Developments
6.2.10 SWOT Analysis
6.3 IPG PHOTONICS CORPORATION (U.S.)
6.4 TROTEC LASER GMBH (AUSTRIA)
6.5 GRAVOTECH GROUP (FRANCE)
6.6 VIDEOJET TECHNOLOGIES INC. (U.S.)
6.7 ROFIN-SINAR TECHNOLOGIES INC. (U.S.)
6.8 EPILOG LASER (U.S.)
6.9 UNIVERSAL LASER SYSTEMS INC. (U.S.)
6.10 TYKMA ELECTROX (U.S.)
6.11 MECCO PARTNERS LLC (U.S.)
6.12 HAN'S LASER TECHNOLOGY INDUSTRY GROUP COLTD. (CHINA)
6.13 KEYENCE CORPORATION (JAPAN)
6.14 MATTHEWS INTERNATIONAL CORPORATION (U.S.)
6.15 PANASONIC CORPORATION (JAPAN)
6.16 CONTROL MICRO SYSTEMS INC. (U.S.)
6.17 JINAN STYLE MACHINERY COLTD. (CHINA)
6.18 NEEDHAM LASER TECHNOLOGIES LTD. (U.K.)
6.19 LASERSTAR TECHNOLOGIES CORPORATION (U.S.)
Chapter 7: Global Leather Goods Market By Region
7.1 Overview
7.2. North America Leather Goods Market
7.2.1 Key Market Trends, Growth Factors and Opportunities
7.2.2 Top Key Companies
7.2.3 Historic and Forecasted Market Size by Segments
7.2.4 Historic and Forecasted Market Size by Type
7.2.4.1 Footwear
7.2.4.2 Luggage
7.2.4.3 Accessories
7.2.5 Historic and Forecasted Market Size by Distribution Channel
7.2.5.1 Offline
7.2.5.2 Online
7.2.6 Historic and Forecast Market Size by Country
7.2.6.1 US
7.2.6.2 Canada
7.2.6.3 Mexico
7.3. Eastern Europe Leather Goods Market
7.3.1 Key Market Trends, Growth Factors and Opportunities
7.3.2 Top Key Companies
7.3.3 Historic and Forecasted Market Size by Segments
7.3.4 Historic and Forecasted Market Size by Type
7.3.4.1 Footwear
7.3.4.2 Luggage
7.3.4.3 Accessories
7.3.5 Historic and Forecasted Market Size by Distribution Channel
7.3.5.1 Offline
7.3.5.2 Online
7.3.6 Historic and Forecast Market Size by Country
7.3.6.1 Russia
7.3.6.2 Bulgaria
7.3.6.3 The Czech Republic
7.3.6.4 Hungary
7.3.6.5 Poland
7.3.6.6 Romania
7.3.6.7 Rest of Eastern Europe
7.4. Western Europe Leather Goods Market
7.4.1 Key Market Trends, Growth Factors and Opportunities
7.4.2 Top Key Companies
7.4.3 Historic and Forecasted Market Size by Segments
7.4.4 Historic and Forecasted Market Size by Type
7.4.4.1 Footwear
7.4.4.2 Luggage
7.4.4.3 Accessories
7.4.5 Historic and Forecasted Market Size by Distribution Channel
7.4.5.1 Offline
7.4.5.2 Online
7.4.6 Historic and Forecast Market Size by Country
7.4.6.1 Germany
7.4.6.2 UK
7.4.6.3 France
7.4.6.4 The Netherlands
7.4.6.5 Italy
7.4.6.6 Spain
7.4.6.7 Rest of Western Europe
7.5. Asia Pacific Leather Goods Market
7.5.1 Key Market Trends, Growth Factors and Opportunities
7.5.2 Top Key Companies
7.5.3 Historic and Forecasted Market Size by Segments
7.5.4 Historic and Forecasted Market Size by Type
7.5.4.1 Footwear
7.5.4.2 Luggage
7.5.4.3 Accessories
7.5.5 Historic and Forecasted Market Size by Distribution Channel
7.5.5.1 Offline
7.5.5.2 Online
7.5.6 Historic and Forecast Market Size by Country
7.5.6.1 China
7.5.6.2 India
7.5.6.3 Japan
7.5.6.4 South Korea
7.5.6.5 Malaysia
7.5.6.6 Thailand
7.5.6.7 Vietnam
7.5.6.8 The Philippines
7.5.6.9 Australia
7.5.6.10 New Zealand
7.5.6.11 Rest of APAC
7.6. Middle East & Africa Leather Goods Market
7.6.1 Key Market Trends, Growth Factors and Opportunities
7.6.2 Top Key Companies
7.6.3 Historic and Forecasted Market Size by Segments
7.6.4 Historic and Forecasted Market Size by Type
7.6.4.1 Footwear
7.6.4.2 Luggage
7.6.4.3 Accessories
7.6.5 Historic and Forecasted Market Size by Distribution Channel
7.6.5.1 Offline
7.6.5.2 Online
7.6.6 Historic and Forecast Market Size by Country
7.6.6.1 Turkiye
7.6.6.2 Bahrain
7.6.6.3 Kuwait
7.6.6.4 Saudi Arabia
7.6.6.5 Qatar
7.6.6.6 UAE
7.6.6.7 Israel
7.6.6.8 South Africa
7.7. South America Leather Goods Market
7.7.1 Key Market Trends, Growth Factors and Opportunities
7.7.2 Top Key Companies
7.7.3 Historic and Forecasted Market Size by Segments
7.7.4 Historic and Forecasted Market Size by Type
7.7.4.1 Footwear
7.7.4.2 Luggage
7.7.4.3 Accessories
7.7.5 Historic and Forecasted Market Size by Distribution Channel
7.7.5.1 Offline
7.7.5.2 Online
7.7.6 Historic and Forecast Market Size by Country
7.7.6.1 Brazil
7.7.6.2 Argentina
7.7.6.3 Rest of SA
Chapter 8 Analyst Viewpoint and Conclusion
8.1 Recommendations and Concluding Analysis
8.2 Potential Market Strategies
Chapter 9 Research Methodology
9.1 Research Process
9.2 Primary Research
9.3 Secondary Research
|
Leather Goods Market |
|||
|
Base Year: |
2023 |
Forecast Period: |
2024-2032 |
|
Historical Data: |
2017 to 2023 |
Market Size in 2023: |
USD 342.2 Bn. |
|
Forecast Period 2024-32 CAGR: |
6.7 % |
Market Size in 2032: |
USD 613.42 Bn. |
|
Segments Covered: |
By Type |
|
|
|
By Distribution Channel |
|
||
|
By Region |
|
||
|
Key Market Drivers: |
|
||
|
Key Market Restraints: |
|
||
|
Key Opportunities: |
|
||
|
Companies Covered in the report: |
|
||


