


Global Industrial Sensors Market Overview
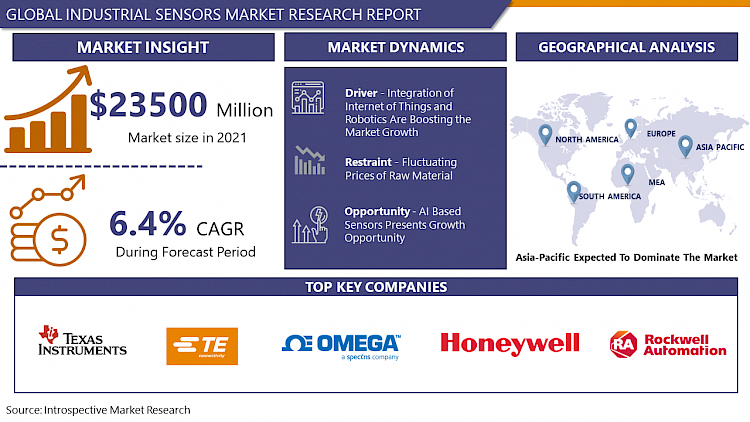
Industrial Sensors Market was valued at USD 23500 million in 2021 and is expected to reach USD 36280 million by the year 2028, at a CAGR of 6.4%.
Industrial sensors are devices that carries the main tasks of detecting events or changes in the environment and then providing the corresponding output. These sensors are used to sense input, such as light, heat, motion, pressure, moisture or any other entity, and respond by an output on a display or transmit the information in electronic form for further Processing of the information.
Industrial sensors are a key part of factory automation. Thoroughly, Industry 4.0. Motion, environmental, and vibration sensors are some of the sensors that are used to monitor the health of equipment, ranging from linear or angular positioning, tilt sensing, leveling, and shock, to fall detection. These Sensors have its major applications in various different areas such as, flood and water level monitoring systems, environmental monitoring, traffic monitoring and controlling, energy saving in artificial lighting, remote system monitoring and equipment fault diagnostics, and precision agriculture.
Industrial robotics adoption is increasing, but energy efficiency has emerged as an increasingly prominent concern, as electronics adoption and environmental consciousness both increases parallelly by today different types of low-power/low-cost sensors in the market allow for the greatly expanded data collection on different devices across the manufacturing processes.
COVID-19 Impact Analysis on Industrial Sensors Market
COVID-19 outbreak is having a very large impact in molding the perception of both consumer and the manufacturer. Manufacturing hubs have been working at low efficiency in order to resist the COVID-19 spread. The primary thing that is being an obstacle for the market growth is the hindrance in the supply chain of the market which leads to shortages of materials, components, and products.
The impact of COVID-19 on the manufacturing industry has affected the global economy, and same goes with Industrial Sensors Market as discontinuity in operations has affected shareholder returns, and revenue, which are expected to create some financial disturbances in the industrial sensors industry. Various electronic components mostly used for industrial application, such as sensors, PCBs, LED chips, ICs, and other semiconductors, are mostly imported from China. And hence, due to temporary lockdown of manufacturing units, the prices of semiconductor components have raised by around 2-3% because of short supplies. In addition, capital budget reduction and delay in pre-planned projects in end-use industries have hampered the industry.
Market Dynamics And Factors
Drivers:
Many gears like Industrial Internet of Things (IIoT), Internet of Robotic Things (IoRT), AR, etcetera is fostering the market to grow. The Industrial Internet of Things made industries to rethink their business models, generating actionable information and knowledge from IIoT devices. Such smashing data sharing ecosystem have started to build new revenue streams and partnerships.
Further, clustered and real-time data acquired from sensors led to the development of robots that can take specific actions because of these built-in capabilities whereby IIoT becomes a driver of ‘decision-making’ devices and software’s which is driving the market towards a rise. AR (Augmented Reality) provided a new lens to view this real-time data for a variety of uses, which directly affected in improvement of front-line worker productivity.
Restraints:
With the interest of producing a superior sensor, the most prominent part is high-quality raw materials which is to be chosen by the producer. Metals and alloys used while manufacturing sensors include Platinum, Copper, Silicon, Tungsten, and Nickel, and alloys. Platinum prices have spiked towards a two-month high in month of May 2020, the platinum-group metals markets are going to remain under tension because of the Covid-19 pandemic. Prices for 99.95pc min platinum increased to USD 830/troy ounces (toz) in May 2020, which were at its lowest at USD 621/toz on 19 March 2020.
Also, in the year 2020, raw material prices of copper and aluminum increased by 15-20% which led to the low manufacturing units, which majorly disrupted the supply chain distribution toward the end-user applications.
The sensors in automobiles are required to work in varying environmental conditions, which differs from altitude and varying humidity, thus, adding the cost of maintenance of sensors under different conditions.
Opportunities:
The reduced cost of production and the efficiency in the production are fostering the growth as the conventional manufacturing process had such trouble which can be expelled with the technological advancement. Unforeseen facility stoppages are a major management issue at manufacturing sites and are directly linked to lost production opportunities. hence, manufacturers are looking for ways to utilize smart devices and IoT-based industrial sensors in order to maintain and further improve facility operation rates without directly appointing human experience or skills in the task.
The miniaturization of industrial sensors is the prime focus in the market as many industrial processes require multiple sensors. Thus, the manufacturers are having their attention towards the introduction of sensor fusion which can make it compact plus, it can perform tasks of more than one sensor. For example, TE connectivity has introduced pressure transducers with temperature sensing options with tri and quad designs.
Self-determining trends are also potent of having a very positive impact on the market. Overall, the market will have a stable increase in demand for all types of sensors owing to industrial automation, digitization, and factory automation.
Market Segmentation
Segmentation Insights
By Sensing Type, the pressure segment is dominating the market, with a share of 20.35% in 2020, and will maintain its dominance in the upcoming period. The same segment owns the fastest growth in the market at a high CAGR over the forecast period as, around 30% of the total cost of a vehicle is from electronic systems, the systems include touch screen displays, radio, automated braking systems, etc. The developments of Industry 4.0 with the Covid -19 pandemic are now acting as a catalyst which is pushing the development of intelligent pressure sensors that help in improving energy consumption with a high level of efficiency. The type segment is further followed flow and temperature segment in terms of revenue.
Addressing the End User Vertical, the manufacturing segment owns the major share. In 2020, the region covered over 29.79% of the market. However, other end user verticals are expected to experience the fastest growth rate among all others at a Highest CAGR over the forecast period. Various types of industrial sensors are presently used in manufacturing industries, including environmental sensors, image sensors, motion and vibration sensors, and proximity sensors, the main purpose of these sensors is to provide a variety of information about the product during manufacturing. The pharmaceutical industry also concedes an effective CAGR this segment primarily deals with vibration sensors and temperature-controlled sensors. Moreover, Mining, oil and gas vertical is increasingly adopting sensors for monitoring reciprocating machinery and oil and gas wells, and pipelines leveraging its highly accurate results.
Regional Insights
By geography, the industrial sensor market is mostly occupied by Asia-Pacific region. In 2020, the region stood with 38.16% of the market share, and also in the coming years the Asia-Pacific region is expected to experience the fastest growth at a very good CAGR. China held the major share of the market, and the Rest of Asia-Pacific is expected to grow swiftly at the highest rate CAGR.
In North America, Canada and United States are growing with a healthy CAGR. The industry 4.0 wave, in combination with the growing demand for industrial automation and steady growth in capital investments are setting up various industries wherein industrial sensors are used, driving the growth of the market in the United States.
The United Kingdom is highly competing with countries, like China, the United States, and India, in the production of vaccines against COVID-19. This shows the increase in investments in the pharmaceutical sector in UK, which results in greater use of industrial sensors. The vendors are focusing more on the developments in temperature sensors to monitor the vaccines stored in various facilities. However, the market in the region may witness an offset from the country’s automotive sector but the effect may not be sustainable.
Rest of Europe includes the countries such as Austria, the Czech Republic and Switzerland. These countries are mainly focusing on developments aimed at augmenting the current sensor technology rather than engendering new, in order to improve their efficiency in industrial environments. The manufacturing and automotive sectors are having the greater use of industrial sensors in the region.
Players Covered in Industrial Sensors Market are:
- Texas Instruments Incorporated
- TE Connectivity Inc.
- Omega Engineering Inc.
- Honeywell International Inc.
- Rockwell Automation Inc.
- Siemens AG
- STMicroelectronics Inc.
- ams AG
- NXP Semiconductors NV
- First Sensor AG
- Bosch Sensortec GmbH
- Sick AG
- ABB Limited
- Omron Corporation other Major Players.
Key Industry Developments
- Omron Corporation opened a new Automation Center in Tokyo as it will allow customers to experience and test state-of-the-art FA that seamlessly integrates AI, IoT, robotics, and other cutting-edge technologies, this indicates that the players are prioritizing the investments in the expansion of their product lines, expansion of manufacturing facilities and expansion of their operations across the world.
- Further in October 2020, Omron Electronic Components Europe announced that they have partnered with MIT-Systems to expand its Russian distribution network.
- TE Connectivity Ltd have also announced the completion of its public takeover of First Sensor AG to hold 71.87 % of First Sensor in March 2020.
|
Global Industrial Sensors Market |
|||
|
Base Year: |
2021 |
Forecast Period: |
2022-2028 |
|
Historical Data: |
2016 to 2020 |
Market Size in 2021: |
USD 23500 Mn. |
|
Forecast Period 2022-28 CAGR: |
6.4% |
Market Size in 2028: |
USD 36280 Mn. |
|
Segments Covered: |
By Sensing Type |
|
|
|
By End-User Industry |
|
||
|
By Region |
|
||
|
Key Market Drivers: |
|
||
|
Key Market Restraints: |
|
||
|
Key Opportunities: |
|
||
|
Companies Covered in the report: |
|
||
Chapter 1: Introduction
1.1 Research Objectives
1.2 Research Methodology
1.3 Research Process
1.4 Scope and Coverage
1.4.1 Market Definition
1.4.2 Key Questions Answered
1.5 Market Segmentation
Chapter 2:Executive Summary
Chapter 3:Growth Opportunities By Segment
3.1 By Sensing Type
3.2 By End User Industry
Chapter 4: Market Landscape
4.1 Porter's Five Forces Analysis
4.1.1 Bargaining Power of Supplier
4.1.2 Threat of New Entrants
4.1.3 Threat of Substitutes
4.1.4 Competitive Rivalry
4.1.5 Bargaining Power Among Buyers
4.2 Industry Value Chain Analysis
4.3 Market Dynamics
3.5.1 Drivers
3.5.2 Restraints
3.5.3 Opportunities
3.5.4 Challenges
4.4 Pestle Analysis
4.5 Technological Roadmap
4.6 Regulatory Landscape
4.7 SWOT Analysis
4.8 Price Trend Analysis
4.9 Patent Analysis
4.10 Analysis of the Impact of Covid-19
4.10.1 Impact on the Overall Market
4.10.2 Impact on the Supply Chain
4.10.3 Impact on the Key Manufacturers
4.10.4 Impact on the Pricing
Chapter 4: Industrial Sensors Market by Sensing Type
4.1 Industrial Sensors Market Overview Snapshot and Growth Engine
4.2 Industrial Sensors Market Overview
4.3 Flow
4.3.1 Introduction and Market Overview
4.3.2 Historic and Forecasted Market Size (2016-2028F)
4.3.3 Key Market Trends, Growth Factors and Opportunities
4.3.4 Flow: Grographic Segmentation
4.4 Pressure
4.4.1 Introduction and Market Overview
4.4.2 Historic and Forecasted Market Size (2016-2028F)
4.4.3 Key Market Trends, Growth Factors and Opportunities
4.4.4 Pressure: Grographic Segmentation
4.5 Proximity (Area)
4.5.1 Introduction and Market Overview
4.5.2 Historic and Forecasted Market Size (2016-2028F)
4.5.3 Key Market Trends, Growth Factors and Opportunities
4.5.4 Proximity (Area): Grographic Segmentation
4.6 Level Measurement
4.6.1 Introduction and Market Overview
4.6.2 Historic and Forecasted Market Size (2016-2028F)
4.6.3 Key Market Trends, Growth Factors and Opportunities
4.6.4 Level Measurement: Grographic Segmentation
4.7 Temperature
4.7.1 Introduction and Market Overview
4.7.2 Historic and Forecasted Market Size (2016-2028F)
4.7.3 Key Market Trends, Growth Factors and Opportunities
4.7.4 Temperature: Grographic Segmentation
4.8 Image
4.8.1 Introduction and Market Overview
4.8.2 Historic and Forecasted Market Size (2016-2028F)
4.8.3 Key Market Trends, Growth Factors and Opportunities
4.8.4 Image: Grographic Segmentation
4.9 Other Sensing Types
4.9.1 Introduction and Market Overview
4.9.2 Historic and Forecasted Market Size (2016-2028F)
4.9.3 Key Market Trends, Growth Factors and Opportunities
4.9.4 Other Sensing Types: Grographic Segmentation
Chapter 5: Industrial Sensors Market by End User Industry
5.1 Industrial Sensors Market Overview Snapshot and Growth Engine
5.2 Industrial Sensors Market Overview
5.3 Mining
5.3.1 Introduction and Market Overview
5.3.2 Historic and Forecasted Market Size (2016-2028F)
5.3.3 Key Market Trends, Growth Factors and Opportunities
5.3.4 Mining: Grographic Segmentation
5.4 Oil
5.4.1 Introduction and Market Overview
5.4.2 Historic and Forecasted Market Size (2016-2028F)
5.4.3 Key Market Trends, Growth Factors and Opportunities
5.4.4 Oil: Grographic Segmentation
5.5 and Gas
5.5.1 Introduction and Market Overview
5.5.2 Historic and Forecasted Market Size (2016-2028F)
5.5.3 Key Market Trends, Growth Factors and Opportunities
5.5.4 and Gas: Grographic Segmentation
5.6 Manufacturing
5.6.1 Introduction and Market Overview
5.6.2 Historic and Forecasted Market Size (2016-2028F)
5.6.3 Key Market Trends, Growth Factors and Opportunities
5.6.4 Manufacturing: Grographic Segmentation
5.7 Chemical
5.7.1 Introduction and Market Overview
5.7.2 Historic and Forecasted Market Size (2016-2028F)
5.7.3 Key Market Trends, Growth Factors and Opportunities
5.7.4 Chemical: Grographic Segmentation
5.8 Pharmaceutical
5.8.1 Introduction and Market Overview
5.8.2 Historic and Forecasted Market Size (2016-2028F)
5.8.3 Key Market Trends, Growth Factors and Opportunities
5.8.4 Pharmaceutical: Grographic Segmentation
5.9 Other End-user Verticals
5.9.1 Introduction and Market Overview
5.9.2 Historic and Forecasted Market Size (2016-2028F)
5.9.3 Key Market Trends, Growth Factors and Opportunities
5.9.4 Other End-user Verticals: Grographic Segmentation
Chapter 6: Company Profiles and Competitive Analysis
6.1 Competitive Landscape
6.1.1 Competitive Positioning
6.1.2 Industrial Sensors Sales and Market Share By Players
6.1.3 Industry BCG Matrix
6.1.4 Ansoff Matrix
6.1.5 Industrial Sensors Industry Concentration Ratio (CR5 and HHI)
6.1.6 Top 5 Industrial Sensors Players Market Share
6.1.7 Mergers and Acquisitions
6.1.8 Business Strategies By Top Players
6.2 TEXAS INSTRUMENTS INCORPORATED
6.2.1 Company Overview
6.2.2 Key Executives
6.2.3 Company Snapshot
6.2.4 Operating Business Segments
6.2.5 Product Portfolio
6.2.6 Business Performance
6.2.7 Key Strategic Moves and Recent Developments
6.2.8 SWOT Analysis
6.3 TE CONNECTIVITY INC.
6.4 OMEGA ENGINEERING INC.
6.5 HONEYWELL INTERNATIONAL INC.
6.6 ROCKWELL AUTOMATION INC.
6.7 SIEMENS AG
6.8 STMICROELECTRONICS INC.
6.9 AMS AG
6.10 NXP SEMICONDUCTORS NV
6.11 FIRST SENSOR AG
6.12 BOSCH SENSORTEC GMBH
6.13 SICK AG
6.14 ABB LIMITED
6.15 OMRON CORPORATION
Chapter 7: Global Industrial Sensors Market Analysis, Insights and Forecast, 2016-2028
7.1 Market Overview
7.2 Historic and Forecasted Market Size By Sensing Type
7.2.1 Flow
7.2.2 Pressure
7.2.3 Proximity (Area)
7.2.4 Level Measurement
7.2.5 Temperature
7.2.6 Image
7.2.7 Other Sensing Types
7.3 Historic and Forecasted Market Size By End User Industry
7.3.1 Mining
7.3.2 Oil
7.3.3 and Gas
7.3.4 Manufacturing
7.3.5 Chemical
7.3.6 Pharmaceutical
7.3.7 Other End-user Verticals
Chapter 8: North America Industrial Sensors Market Analysis, Insights and Forecast, 2016-2028
8.1 Key Market Trends, Growth Factors and Opportunities
8.2 Impact of Covid-19
8.3 Key Players
8.4 Key Market Trends, Growth Factors and Opportunities
8.4 Historic and Forecasted Market Size By Sensing Type
8.4.1 Flow
8.4.2 Pressure
8.4.3 Proximity (Area)
8.4.4 Level Measurement
8.4.5 Temperature
8.4.6 Image
8.4.7 Other Sensing Types
8.5 Historic and Forecasted Market Size By End User Industry
8.5.1 Mining
8.5.2 Oil
8.5.3 and Gas
8.5.4 Manufacturing
8.5.5 Chemical
8.5.6 Pharmaceutical
8.5.7 Other End-user Verticals
8.6 Historic and Forecast Market Size by Country
8.6.1 U.S.
8.6.2 Canada
8.6.3 Mexico
Chapter 9: Europe Industrial Sensors Market Analysis, Insights and Forecast, 2016-2028
9.1 Key Market Trends, Growth Factors and Opportunities
9.2 Impact of Covid-19
9.3 Key Players
9.4 Key Market Trends, Growth Factors and Opportunities
9.4 Historic and Forecasted Market Size By Sensing Type
9.4.1 Flow
9.4.2 Pressure
9.4.3 Proximity (Area)
9.4.4 Level Measurement
9.4.5 Temperature
9.4.6 Image
9.4.7 Other Sensing Types
9.5 Historic and Forecasted Market Size By End User Industry
9.5.1 Mining
9.5.2 Oil
9.5.3 and Gas
9.5.4 Manufacturing
9.5.5 Chemical
9.5.6 Pharmaceutical
9.5.7 Other End-user Verticals
9.6 Historic and Forecast Market Size by Country
9.6.1 Germany
9.6.2 U.K.
9.6.3 France
9.6.4 Italy
9.6.5 Russia
9.6.6 Spain
Chapter 10: Asia-Pacific Industrial Sensors Market Analysis, Insights and Forecast, 2016-2028
10.1 Key Market Trends, Growth Factors and Opportunities
10.2 Impact of Covid-19
10.3 Key Players
10.4 Key Market Trends, Growth Factors and Opportunities
10.4 Historic and Forecasted Market Size By Sensing Type
10.4.1 Flow
10.4.2 Pressure
10.4.3 Proximity (Area)
10.4.4 Level Measurement
10.4.5 Temperature
10.4.6 Image
10.4.7 Other Sensing Types
10.5 Historic and Forecasted Market Size By End User Industry
10.5.1 Mining
10.5.2 Oil
10.5.3 and Gas
10.5.4 Manufacturing
10.5.5 Chemical
10.5.6 Pharmaceutical
10.5.7 Other End-user Verticals
10.6 Historic and Forecast Market Size by Country
10.6.1 China
10.6.2 India
10.6.3 Japan
10.6.4 Southeast Asia
Chapter 11: South America Industrial Sensors Market Analysis, Insights and Forecast, 2016-2028
11.1 Key Market Trends, Growth Factors and Opportunities
11.2 Impact of Covid-19
11.3 Key Players
11.4 Key Market Trends, Growth Factors and Opportunities
11.4 Historic and Forecasted Market Size By Sensing Type
11.4.1 Flow
11.4.2 Pressure
11.4.3 Proximity (Area)
11.4.4 Level Measurement
11.4.5 Temperature
11.4.6 Image
11.4.7 Other Sensing Types
11.5 Historic and Forecasted Market Size By End User Industry
11.5.1 Mining
11.5.2 Oil
11.5.3 and Gas
11.5.4 Manufacturing
11.5.5 Chemical
11.5.6 Pharmaceutical
11.5.7 Other End-user Verticals
11.6 Historic and Forecast Market Size by Country
11.6.1 Brazil
11.6.2 Argentina
Chapter 12: Middle East & Africa Industrial Sensors Market Analysis, Insights and Forecast, 2016-2028
12.1 Key Market Trends, Growth Factors and Opportunities
12.2 Impact of Covid-19
12.3 Key Players
12.4 Key Market Trends, Growth Factors and Opportunities
12.4 Historic and Forecasted Market Size By Sensing Type
12.4.1 Flow
12.4.2 Pressure
12.4.3 Proximity (Area)
12.4.4 Level Measurement
12.4.5 Temperature
12.4.6 Image
12.4.7 Other Sensing Types
12.5 Historic and Forecasted Market Size By End User Industry
12.5.1 Mining
12.5.2 Oil
12.5.3 and Gas
12.5.4 Manufacturing
12.5.5 Chemical
12.5.6 Pharmaceutical
12.5.7 Other End-user Verticals
12.6 Historic and Forecast Market Size by Country
12.6.1 Saudi Arabia
12.6.2 South Africa
Chapter 13 Investment Analysis
Chapter 14 Analyst Viewpoint and Conclusion
|
Global Industrial Sensors Market |
|||
|
Base Year: |
2021 |
Forecast Period: |
2022-2028 |
|
Historical Data: |
2016 to 2020 |
Market Size in 2021: |
USD 23500 Mn. |
|
Forecast Period 2022-28 CAGR: |
6.4% |
Market Size in 2028: |
USD 36280 Mn. |
|
Segments Covered: |
By Sensing Type |
|
|
|
By End-User Industry |
|
||
|
By Region |
|
||
|
Key Market Drivers: |
|
||
|
Key Market Restraints: |
|
||
|
Key Opportunities: |
|
||
|
Companies Covered in the report: |
|
||
LIST OF TABLES
TABLE 001. EXECUTIVE SUMMARY
TABLE 002. INDUSTRIAL SENSORS MARKET BARGAINING POWER OF SUPPLIERS
TABLE 003. INDUSTRIAL SENSORS MARKET BARGAINING POWER OF CUSTOMERS
TABLE 004. INDUSTRIAL SENSORS MARKET COMPETITIVE RIVALRY
TABLE 005. INDUSTRIAL SENSORS MARKET THREAT OF NEW ENTRANTS
TABLE 006. INDUSTRIAL SENSORS MARKET THREAT OF SUBSTITUTES
TABLE 007. INDUSTRIAL SENSORS MARKET BY SENSING TYPE
TABLE 008. FLOW MARKET OVERVIEW (2016-2028)
TABLE 009. PRESSURE MARKET OVERVIEW (2016-2028)
TABLE 010. PROXIMITY (AREA) MARKET OVERVIEW (2016-2028)
TABLE 011. LEVEL MEASUREMENT MARKET OVERVIEW (2016-2028)
TABLE 012. TEMPERATURE MARKET OVERVIEW (2016-2028)
TABLE 013. IMAGE MARKET OVERVIEW (2016-2028)
TABLE 014. OTHER SENSING TYPES MARKET OVERVIEW (2016-2028)
TABLE 015. INDUSTRIAL SENSORS MARKET BY END USER INDUSTRY
TABLE 016. MINING MARKET OVERVIEW (2016-2028)
TABLE 017. OIL MARKET OVERVIEW (2016-2028)
TABLE 018. AND GAS MARKET OVERVIEW (2016-2028)
TABLE 019. MANUFACTURING MARKET OVERVIEW (2016-2028)
TABLE 020. CHEMICAL MARKET OVERVIEW (2016-2028)
TABLE 021. PHARMACEUTICAL MARKET OVERVIEW (2016-2028)
TABLE 022. OTHER END-USER VERTICALS MARKET OVERVIEW (2016-2028)
TABLE 023. NORTH AMERICA INDUSTRIAL SENSORS MARKET, BY SENSING TYPE (2016-2028)
TABLE 024. NORTH AMERICA INDUSTRIAL SENSORS MARKET, BY END USER INDUSTRY (2016-2028)
TABLE 025. N INDUSTRIAL SENSORS MARKET, BY COUNTRY (2016-2028)
TABLE 026. EUROPE INDUSTRIAL SENSORS MARKET, BY SENSING TYPE (2016-2028)
TABLE 027. EUROPE INDUSTRIAL SENSORS MARKET, BY END USER INDUSTRY (2016-2028)
TABLE 028. INDUSTRIAL SENSORS MARKET, BY COUNTRY (2016-2028)
TABLE 029. ASIA PACIFIC INDUSTRIAL SENSORS MARKET, BY SENSING TYPE (2016-2028)
TABLE 030. ASIA PACIFIC INDUSTRIAL SENSORS MARKET, BY END USER INDUSTRY (2016-2028)
TABLE 031. INDUSTRIAL SENSORS MARKET, BY COUNTRY (2016-2028)
TABLE 032. MIDDLE EAST & AFRICA INDUSTRIAL SENSORS MARKET, BY SENSING TYPE (2016-2028)
TABLE 033. MIDDLE EAST & AFRICA INDUSTRIAL SENSORS MARKET, BY END USER INDUSTRY (2016-2028)
TABLE 034. INDUSTRIAL SENSORS MARKET, BY COUNTRY (2016-2028)
TABLE 035. SOUTH AMERICA INDUSTRIAL SENSORS MARKET, BY SENSING TYPE (2016-2028)
TABLE 036. SOUTH AMERICA INDUSTRIAL SENSORS MARKET, BY END USER INDUSTRY (2016-2028)
TABLE 037. INDUSTRIAL SENSORS MARKET, BY COUNTRY (2016-2028)
TABLE 038. TEXAS INSTRUMENTS INCORPORATED: SNAPSHOT
TABLE 039. TEXAS INSTRUMENTS INCORPORATED: BUSINESS PERFORMANCE
TABLE 040. TEXAS INSTRUMENTS INCORPORATED: PRODUCT PORTFOLIO
TABLE 041. TEXAS INSTRUMENTS INCORPORATED: KEY STRATEGIC MOVES AND DEVELOPMENTS
TABLE 041. TE CONNECTIVITY INC.: SNAPSHOT
TABLE 042. TE CONNECTIVITY INC.: BUSINESS PERFORMANCE
TABLE 043. TE CONNECTIVITY INC.: PRODUCT PORTFOLIO
TABLE 044. TE CONNECTIVITY INC.: KEY STRATEGIC MOVES AND DEVELOPMENTS
TABLE 044. OMEGA ENGINEERING INC.: SNAPSHOT
TABLE 045. OMEGA ENGINEERING INC.: BUSINESS PERFORMANCE
TABLE 046. OMEGA ENGINEERING INC.: PRODUCT PORTFOLIO
TABLE 047. OMEGA ENGINEERING INC.: KEY STRATEGIC MOVES AND DEVELOPMENTS
TABLE 047. HONEYWELL INTERNATIONAL INC.: SNAPSHOT
TABLE 048. HONEYWELL INTERNATIONAL INC.: BUSINESS PERFORMANCE
TABLE 049. HONEYWELL INTERNATIONAL INC.: PRODUCT PORTFOLIO
TABLE 050. HONEYWELL INTERNATIONAL INC.: KEY STRATEGIC MOVES AND DEVELOPMENTS
TABLE 050. ROCKWELL AUTOMATION INC.: SNAPSHOT
TABLE 051. ROCKWELL AUTOMATION INC.: BUSINESS PERFORMANCE
TABLE 052. ROCKWELL AUTOMATION INC.: PRODUCT PORTFOLIO
TABLE 053. ROCKWELL AUTOMATION INC.: KEY STRATEGIC MOVES AND DEVELOPMENTS
TABLE 053. SIEMENS AG: SNAPSHOT
TABLE 054. SIEMENS AG: BUSINESS PERFORMANCE
TABLE 055. SIEMENS AG: PRODUCT PORTFOLIO
TABLE 056. SIEMENS AG: KEY STRATEGIC MOVES AND DEVELOPMENTS
TABLE 056. STMICROELECTRONICS INC.: SNAPSHOT
TABLE 057. STMICROELECTRONICS INC.: BUSINESS PERFORMANCE
TABLE 058. STMICROELECTRONICS INC.: PRODUCT PORTFOLIO
TABLE 059. STMICROELECTRONICS INC.: KEY STRATEGIC MOVES AND DEVELOPMENTS
TABLE 059. AMS AG: SNAPSHOT
TABLE 060. AMS AG: BUSINESS PERFORMANCE
TABLE 061. AMS AG: PRODUCT PORTFOLIO
TABLE 062. AMS AG: KEY STRATEGIC MOVES AND DEVELOPMENTS
TABLE 062. NXP SEMICONDUCTORS NV: SNAPSHOT
TABLE 063. NXP SEMICONDUCTORS NV: BUSINESS PERFORMANCE
TABLE 064. NXP SEMICONDUCTORS NV: PRODUCT PORTFOLIO
TABLE 065. NXP SEMICONDUCTORS NV: KEY STRATEGIC MOVES AND DEVELOPMENTS
TABLE 065. FIRST SENSOR AG: SNAPSHOT
TABLE 066. FIRST SENSOR AG: BUSINESS PERFORMANCE
TABLE 067. FIRST SENSOR AG: PRODUCT PORTFOLIO
TABLE 068. FIRST SENSOR AG: KEY STRATEGIC MOVES AND DEVELOPMENTS
TABLE 068. BOSCH SENSORTEC GMBH: SNAPSHOT
TABLE 069. BOSCH SENSORTEC GMBH: BUSINESS PERFORMANCE
TABLE 070. BOSCH SENSORTEC GMBH: PRODUCT PORTFOLIO
TABLE 071. BOSCH SENSORTEC GMBH: KEY STRATEGIC MOVES AND DEVELOPMENTS
TABLE 071. SICK AG: SNAPSHOT
TABLE 072. SICK AG: BUSINESS PERFORMANCE
TABLE 073. SICK AG: PRODUCT PORTFOLIO
TABLE 074. SICK AG: KEY STRATEGIC MOVES AND DEVELOPMENTS
TABLE 074. ABB LIMITED: SNAPSHOT
TABLE 075. ABB LIMITED: BUSINESS PERFORMANCE
TABLE 076. ABB LIMITED: PRODUCT PORTFOLIO
TABLE 077. ABB LIMITED: KEY STRATEGIC MOVES AND DEVELOPMENTS
TABLE 077. OMRON CORPORATION: SNAPSHOT
TABLE 078. OMRON CORPORATION: BUSINESS PERFORMANCE
TABLE 079. OMRON CORPORATION: PRODUCT PORTFOLIO
TABLE 080. OMRON CORPORATION: KEY STRATEGIC MOVES AND DEVELOPMENTS
LIST OF FIGURES
FIGURE 001. YEARS CONSIDERED FOR ANALYSIS
FIGURE 002. SCOPE OF THE STUDY
FIGURE 003. INDUSTRIAL SENSORS MARKET OVERVIEW BY REGIONS
FIGURE 004. PORTER'S FIVE FORCES ANALYSIS
FIGURE 005. BARGAINING POWER OF SUPPLIERS
FIGURE 006. COMPETITIVE RIVALRYFIGURE 007. THREAT OF NEW ENTRANTS
FIGURE 008. THREAT OF SUBSTITUTES
FIGURE 009. VALUE CHAIN ANALYSIS
FIGURE 010. PESTLE ANALYSIS
FIGURE 011. INDUSTRIAL SENSORS MARKET OVERVIEW BY SENSING TYPE
FIGURE 012. FLOW MARKET OVERVIEW (2016-2028)
FIGURE 013. PRESSURE MARKET OVERVIEW (2016-2028)
FIGURE 014. PROXIMITY (AREA) MARKET OVERVIEW (2016-2028)
FIGURE 015. LEVEL MEASUREMENT MARKET OVERVIEW (2016-2028)
FIGURE 016. TEMPERATURE MARKET OVERVIEW (2016-2028)
FIGURE 017. IMAGE MARKET OVERVIEW (2016-2028)
FIGURE 018. OTHER SENSING TYPES MARKET OVERVIEW (2016-2028)
FIGURE 019. INDUSTRIAL SENSORS MARKET OVERVIEW BY END USER INDUSTRY
FIGURE 020. MINING MARKET OVERVIEW (2016-2028)
FIGURE 021. OIL MARKET OVERVIEW (2016-2028)
FIGURE 022. AND GAS MARKET OVERVIEW (2016-2028)
FIGURE 023. MANUFACTURING MARKET OVERVIEW (2016-2028)
FIGURE 024. CHEMICAL MARKET OVERVIEW (2016-2028)
FIGURE 025. PHARMACEUTICAL MARKET OVERVIEW (2016-2028)
FIGURE 026. OTHER END-USER VERTICALS MARKET OVERVIEW (2016-2028)
FIGURE 027. NORTH AMERICA INDUSTRIAL SENSORS MARKET OVERVIEW BY COUNTRY (2016-2028)
FIGURE 028. EUROPE INDUSTRIAL SENSORS MARKET OVERVIEW BY COUNTRY (2016-2028)
FIGURE 029. ASIA PACIFIC INDUSTRIAL SENSORS MARKET OVERVIEW BY COUNTRY (2016-2028)
FIGURE 030. MIDDLE EAST & AFRICA INDUSTRIAL SENSORS MARKET OVERVIEW BY COUNTRY (2016-2028)
FIGURE 031. SOUTH AMERICA INDUSTRIAL SENSORS MARKET OVERVIEW BY COUNTRY (2016-2028)
Frequently Asked Questions :
The forecast period in the Industrial Sensors Market research report is 2022-2028.
Texas Instruments Incorporated, TE Connectivity Inc., Omega Engineering Inc., Honeywell International Inc., Rockwell Automation Inc., Siemens AG, STMicroelectronics Inc., AMS AG, NXP Semiconductors NV, First Sensor AG, Bosch Sensortec GmbH, Sick AG, ABB Limited, Omron Corporation and other major players.
The Industrial Sensors Market is segmented into Sensing Type, End-User Industry and Region. By Sensing Type, the market is categorized into Flow, Pressure, Proximity (Area), Level Measurement, Temperature, Image. By End-User Industry, the market is categorized into Mining, Oil, and Gas, Manufacturing, Chemical, Pharmaceutical, Others. By region, it is analyzed across North America (U.S.; Canada; Mexico), Europe (Germany; U.K.; France; Italy; Russia; Spain, etc.), Asia-Pacific (China; India; Japan; Southeast Asia, etc.), South America (Brazil; Argentina, etc.), Middle East & Africa (Saudi Arabia; South Africa, etc.).
Industrial sensors are devices that carries the main tasks of detecting events or changes in the environment and then providing the corresponding output. These sensors are used to sense input, such as light, heat, motion, pressure, moisture or any other entity, and respond by an output on a display or transmit the information in electronic form for further Processing of the information.
Industrial Sensors Market was valued at USD 23500 million in 2021 and is expected to reach USD 36280 million by the year 2028, at a CAGR of 6.4%.


