


Hydropower Market Synopsis
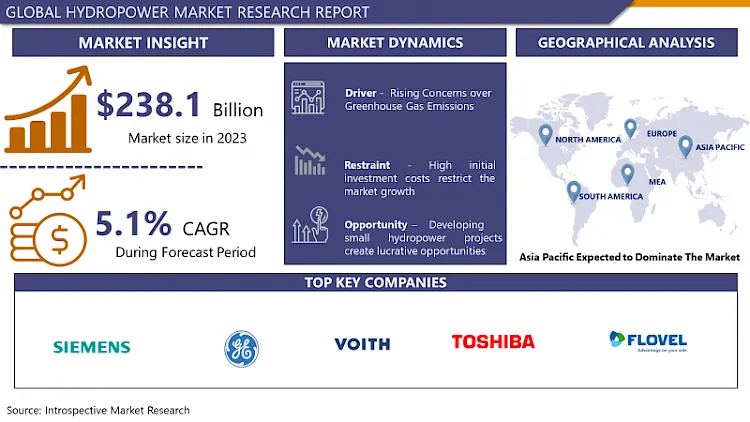
Hydropower Market Size Was Valued at USD 250.24 Billion in 2024, and is Projected to Reach USD 372.54 Billion by 2032, Growing at a CAGR of 5.1% From 2025-2032.
Hydropower or hydro electric power is the energy derived from flowing or falling water and is one form of the renewable energy source. This process involves allowing water to flow through a turbine that is sated with a generator whereby the flowing water imparts kinetic energy to the turbine /generator and this is then converted into electrical energy. Hydropower is used both with the utilization of a dam or a naturally occurring moving water force in run-of-river facilities to provide electricity for the world. This makes it a clean energy type given the absence of direct emissions of greenhouse gases during use and a very common approach towards power generation all over the world.
Hydropower industry is headed towards further growth as governments and countries are shifting more towards renewable energy sources. Hydropower projects have for long been used by many countries and it has been preferred today by many countries as they need more electrical energy and to reduce carbon emissions. Other assisting factors include but not limited to political factors: specific government policies, support, and legal measures to endorse the use of hydropower in different nations also fosters the development of new projects.
With increasing consumer interest and adoption of renewable energy sources, the hydropower market is growing and changing. Hydropower, as the direct utilisation of the energy of moving water was historically the first type of power, known for its dependability, versatility and practically low CO2 emissions. Existing large and medium hydropower market is having a steady growth in the existing market, due to the rising demand for clean power sources for combating the turmoil of climate change and reduction of the power generated from fossil fuels. Large and small capacities, including individual mini-hydro stations and extensive reservoir schemes, hydroelectricity is firmly at the centre of the global shift towards renewable power generation.
Hydropower is also promoted globally mainly driven by technology and innovation. Modernization of hydropower systems is being worked on very actively so that the energy generated has maximum efficiency and minimum impacts on the environment. The innovative build of today’s turbines, fish friendly technologies and environmental management measures are working towards solving the ecological issues related to the construction of hydropower plants. Such innovations play a positive role in moving hydropower to a level of sustainability, which would also garner social acceptance.

Hydropower Market Trend Analysis
Growing Demand from Other Energy Sources
- The hydropower market is at the moment in high demands all over the world due to the shifts towards the use of other energy sources as compared to the conventional sources. I?d like to look into the importance of hydropower and the role it plays as the world step up efforts in combating the effects of climate change and move to lower their carbon footprint. Hydropower, the process of producing electrical energy with the help of flowing water has been gaining more attention from government, industries and the customers for the following reasons.
- The following are the various influences which have contributed to the increased demand for hydropower: The environmental Impact of hydropower. Hydropower is one of the renewable sources of energy that generates electricity without any release of greenhouse gases therefore can be said to be environmental friendly as compared to fossil fuels. Hydropower remains an option that is both renewable and sustainable in its contribution to the energy needs of the people across the world. Also, the generation of hydropower endures a relatively long period, and thus the electricity generated will be constant for many years.
Rising Global Energy Needs
- The growth in electricity demand across the international market has grown to be a key factor that has boosted the hydropower market. Hydropower becomes one of the prime contenders in the fight for positions in respectable rank of renewable energy sources as countries step up efforts to provide sufficient energy to the growing population and developing economies. The unmatched benefits of hydropower for the prevalence, stability, and the level of anthropogenic impact recommend this type of energy sources for further development.
- The first positive aspect that can be identified as a key driver to the growth of hydropower is that it is reliable hence consistent. Unlike some forms of renewable energy sources that may be unpredictable and influenced by the weather the hydropower is capable of providing reliability power at all times of the year. The dependability of base load electricity power is important in providing reliable electricity necessary for various industries such as manufacturing, domestic use, and vital services such as hospitals.
- Moreover, hydro energy efficiency or environmental friendliness boosts the global demand for hydropower. The peoples of the world are now more conscious of the need to fight against climate change and reduce emissions of greenhouse gases and the use of hydropower is a clean source of energy. Unlike the production of electricity from fossil fuels which is a health burden due to emission of air pollutants and causes global warming hydropower does not emit any air pollutants.
Hydropower Market Segment Analysis:
Hydropower Market is segmented based on Type, Application, and Region.
By Type, Large Hydropower segment is expected to dominate the market during the forecast period
- Large hydropower segment is expected to hold the market share of around 62%. 0. 02P 2% of market share in the global hydropower market in 2024 thanks to its benefits. This nature gives them the advantage of being able to use massive quantities of water and produce large quantities of electricity at a very low cost. After the construction of large hydropower plants, their operating costs also remain relatively low as compared to other sources of renewables. This makes electricity generated by large hydros relatively cheap in the market. They also offer the benefits of base load power capabilities thanks to their large size for large hydroelectric power stations. These can produce electricity at a constant rate and hence supply energy at a particular time when the energy is required. This positions them as ideal for industries and commercial facilites which require constant power supply. Large hydropower is a significant source of electricity generation as it is reliable and offers a baseload as compared to variable renewables like solar and wind. The large capacity of large hydropower plants enable utilities to rely and build large hydropower plants as the main component of power generation system.
By Application, : Industrial segment held the largest share in 2024
- The industrial segment is the biggest customer for hydropower given the considerable requirements for electrical energy throughout the year. Industrial segment is estimated to hold 43. It will have 3% of the market share by 2024. The diverse manufacturing industries such as metals, chemicals, paper, food processing and others require a large and uninterrupted supply of power. This makes hydropower a favorable form of power especially in areas where industries can harness nearby hydro power resources cheaply. Certain large industries that require electricity and are best served by hydropower include the aluminum plant, steel plant, paper mills and water utilities. These processes are energy intensive and demand large volumes of uninterrupted power, which hydropower as a renewable power source can supply in the most efficient way as compared to fossil fuels. This versatility, especially of large hydro projects, to be inflexible and always available to provide base load power makes it especially attractive to industries. Most manufacturing clusters are situated near river basins; this makes it easy to transport power from hydroelectricity stations. This directly accessible local hydro resource opportunity underlines industrial adoption of hydropower.
Hydropower Market Regional Insights:
Asia Pacific is Expected to Dominate the Market Over the Forecast period
- Currently, Asia Pacific region is the largest consumer of hydropower in the world. This industry has more dominance of countries like China, India and Japan due to its geographical and climatic conditions and having an estimated 37. 8% share in 2024. Due to significant presence of hilly and mountain region, there are large number of river systems in the region which can be utilized effectively for generation of hydro electricity. For instance, China has been in the frontline in the development of hydropower plants over the last few decades. It has become the world’s largest producer of hydropower capacity and hydropower electricity.
Active Key Players in the Hydropower Market
- Siemens
- GE
- Voith GmbH & Co. KGaA
- TOSHIBA CORPORATION
- FLOVEL Energy Private Limited
- ANDRITZ
- Natel Energy
- Gilkes
- Bharat Heavy Electricals Limited
- SNC-Lavalin Group
- Kolektor
- Mavel, a.s.
- Canyon Hydro
- Three Gorges
- Alfa Laval
- Hydro-Quebec
- ABB
- Engie
- Other Key Players
Key Industry Developments in the Hydropower Market:
- In 2023, Tata Power Delhi Distribution Limited (Tata Power-DDL) entered into a 5-year ahead 200 MW medium term hydro power purchase agreement (PPA) with NTPC Vidyut Vyapar Nigam Ltd (NVVNL) to fulfil expected peak load requirement. It will share hydro power with Tata Power-DDL from May to September of the next year starting early May, 2023.
|
Global Hydropower Market |
|||
|
Base Year: |
2024 |
Forecast Period: |
2025-2032 |
|
Historical Data: |
2018 to 2023 |
Market Size in 2024: |
USD 250.24 Bn. |
|
Forecast Period 2025-32 CAGR: |
5.1% |
Market Size in 2032: |
USD 372.54 Bn. |
|
Segments Covered: |
By Type |
|
|
|
By Application |
|
||
|
By Region |
|
||
|
Key Market Drivers: |
|
||
|
Key Market Restraints: |
|
||
|
Key Opportunities: |
|
||
|
Companies Covered in the report: |
|
||
Chapter 1: Introduction
1.1 Scope and Coverage
Chapter 2:Executive Summary
Chapter 3: Market Landscape
3.1 Market Dynamics
3.1.1 Drivers
3.1.2 Restraints
3.1.3 Opportunities
3.1.4 Challenges
3.2 Market Trend Analysis
3.3 PESTLE Analysis
3.4 Porter's Five Forces Analysis
3.5 Industry Value Chain Analysis
3.6 Ecosystem
3.7 Regulatory Landscape
3.8 Price Trend Analysis
3.9 Patent Analysis
3.10 Technology Evolution
3.11 Investment Pockets
3.12 Import-Export Analysis
Chapter 4: Hydropower Market by Type (2018-2032)
4.1 Hydropower Market Snapshot and Growth Engine
4.2 Market Overview
4.3 Large Hydropower
4.3.1 Introduction and Market Overview
4.3.2 Historic and Forecasted Market Size in Value USD and Volume Units
4.3.3 Key Market Trends, Growth Factors, and Opportunities
4.3.4 Geographic Segmentation Analysis
4.4 Small Hydropower
4.5 Other Sizes
Chapter 5: Hydropower Market by Application (2018-2032)
5.1 Hydropower Market Snapshot and Growth Engine
5.2 Market Overview
5.3 Residential
5.3.1 Introduction and Market Overview
5.3.2 Historic and Forecasted Market Size in Value USD and Volume Units
5.3.3 Key Market Trends, Growth Factors, and Opportunities
5.3.4 Geographic Segmentation Analysis
5.4 Commercial
5.5 Industrial
Chapter 6: Company Profiles and Competitive Analysis
6.1 Competitive Landscape
6.1.1 Competitive Benchmarking
6.1.2 Hydropower Market Share by Manufacturer (2024)
6.1.3 Industry BCG Matrix
6.1.4 Heat Map Analysis
6.1.5 Mergers and Acquisitions
6.2 ALIENWARE (DELL) (USA)
6.2.1 Company Overview
6.2.2 Key Executives
6.2.3 Company Snapshot
6.2.4 Role of the Company in the Market
6.2.5 Sustainability and Social Responsibility
6.2.6 Operating Business Segments
6.2.7 Product Portfolio
6.2.8 Business Performance
6.2.9 Key Strategic Moves and Recent Developments
6.2.10 SWOT Analysis
6.3 LOGITECH INTERNATIONAL SA (SWITZERLAND)
6.4 RAZER INC. (USA)
6.5 MAD CATZ GLOBAL LIMITED (HONG KONG)
6.6 TURTLE BEACH CORPORATION (USA)
6.7 CORSAIR GAMING INC. (USA)
6.8 COOLER MASTER CO. LTD (TAIWAN)
6.9 SENNHEISER ELECTRONIC GMBH & CO. KG (GERMANY)
6.10 HYPERX (USA)
6.11 ANKER (CHINA)
6.12 REDRAGON (EASTERN TIMES TECHNOLOGY CO. LTD) (CHINA)
6.13 NINTENDO CO. LTD (JAPAN)
6.14 SONY CORPORATION (JAPAN)
6.15 STEELSERIES – (USA)
6.16 MICROSOFT CORPORATION (USA)
Chapter 7: Global Hydropower Market By Region
7.1 Overview
7.2. North America Hydropower Market
7.2.1 Key Market Trends, Growth Factors and Opportunities
7.2.2 Top Key Companies
7.2.3 Historic and Forecasted Market Size by Segments
7.2.4 Historic and Forecasted Market Size by Type
7.2.4.1 Large Hydropower
7.2.4.2 Small Hydropower
7.2.4.3 Other Sizes
7.2.5 Historic and Forecasted Market Size by Application
7.2.5.1 Residential
7.2.5.2 Commercial
7.2.5.3 Industrial
7.2.6 Historic and Forecast Market Size by Country
7.2.6.1 US
7.2.6.2 Canada
7.2.6.3 Mexico
7.3. Eastern Europe Hydropower Market
7.3.1 Key Market Trends, Growth Factors and Opportunities
7.3.2 Top Key Companies
7.3.3 Historic and Forecasted Market Size by Segments
7.3.4 Historic and Forecasted Market Size by Type
7.3.4.1 Large Hydropower
7.3.4.2 Small Hydropower
7.3.4.3 Other Sizes
7.3.5 Historic and Forecasted Market Size by Application
7.3.5.1 Residential
7.3.5.2 Commercial
7.3.5.3 Industrial
7.3.6 Historic and Forecast Market Size by Country
7.3.6.1 Russia
7.3.6.2 Bulgaria
7.3.6.3 The Czech Republic
7.3.6.4 Hungary
7.3.6.5 Poland
7.3.6.6 Romania
7.3.6.7 Rest of Eastern Europe
7.4. Western Europe Hydropower Market
7.4.1 Key Market Trends, Growth Factors and Opportunities
7.4.2 Top Key Companies
7.4.3 Historic and Forecasted Market Size by Segments
7.4.4 Historic and Forecasted Market Size by Type
7.4.4.1 Large Hydropower
7.4.4.2 Small Hydropower
7.4.4.3 Other Sizes
7.4.5 Historic and Forecasted Market Size by Application
7.4.5.1 Residential
7.4.5.2 Commercial
7.4.5.3 Industrial
7.4.6 Historic and Forecast Market Size by Country
7.4.6.1 Germany
7.4.6.2 UK
7.4.6.3 France
7.4.6.4 The Netherlands
7.4.6.5 Italy
7.4.6.6 Spain
7.4.6.7 Rest of Western Europe
7.5. Asia Pacific Hydropower Market
7.5.1 Key Market Trends, Growth Factors and Opportunities
7.5.2 Top Key Companies
7.5.3 Historic and Forecasted Market Size by Segments
7.5.4 Historic and Forecasted Market Size by Type
7.5.4.1 Large Hydropower
7.5.4.2 Small Hydropower
7.5.4.3 Other Sizes
7.5.5 Historic and Forecasted Market Size by Application
7.5.5.1 Residential
7.5.5.2 Commercial
7.5.5.3 Industrial
7.5.6 Historic and Forecast Market Size by Country
7.5.6.1 China
7.5.6.2 India
7.5.6.3 Japan
7.5.6.4 South Korea
7.5.6.5 Malaysia
7.5.6.6 Thailand
7.5.6.7 Vietnam
7.5.6.8 The Philippines
7.5.6.9 Australia
7.5.6.10 New Zealand
7.5.6.11 Rest of APAC
7.6. Middle East & Africa Hydropower Market
7.6.1 Key Market Trends, Growth Factors and Opportunities
7.6.2 Top Key Companies
7.6.3 Historic and Forecasted Market Size by Segments
7.6.4 Historic and Forecasted Market Size by Type
7.6.4.1 Large Hydropower
7.6.4.2 Small Hydropower
7.6.4.3 Other Sizes
7.6.5 Historic and Forecasted Market Size by Application
7.6.5.1 Residential
7.6.5.2 Commercial
7.6.5.3 Industrial
7.6.6 Historic and Forecast Market Size by Country
7.6.6.1 Turkiye
7.6.6.2 Bahrain
7.6.6.3 Kuwait
7.6.6.4 Saudi Arabia
7.6.6.5 Qatar
7.6.6.6 UAE
7.6.6.7 Israel
7.6.6.8 South Africa
7.7. South America Hydropower Market
7.7.1 Key Market Trends, Growth Factors and Opportunities
7.7.2 Top Key Companies
7.7.3 Historic and Forecasted Market Size by Segments
7.7.4 Historic and Forecasted Market Size by Type
7.7.4.1 Large Hydropower
7.7.4.2 Small Hydropower
7.7.4.3 Other Sizes
7.7.5 Historic and Forecasted Market Size by Application
7.7.5.1 Residential
7.7.5.2 Commercial
7.7.5.3 Industrial
7.7.6 Historic and Forecast Market Size by Country
7.7.6.1 Brazil
7.7.6.2 Argentina
7.7.6.3 Rest of SA
Chapter 8 Analyst Viewpoint and Conclusion
8.1 Recommendations and Concluding Analysis
8.2 Potential Market Strategies
Chapter 9 Research Methodology
9.1 Research Process
9.2 Primary Research
9.3 Secondary Research
|
Global Hydropower Market |
|||
|
Base Year: |
2024 |
Forecast Period: |
2025-2032 |
|
Historical Data: |
2018 to 2023 |
Market Size in 2024: |
USD 250.24 Bn. |
|
Forecast Period 2025-32 CAGR: |
5.1% |
Market Size in 2032: |
USD 372.54 Bn. |
|
Segments Covered: |
By Type |
|
|
|
By Application |
|
||
|
By Region |
|
||
|
Key Market Drivers: |
|
||
|
Key Market Restraints: |
|
||
|
Key Opportunities: |
|
||
|
Companies Covered in the report: |
|
||


