


Fuel Cell Market Synopsis
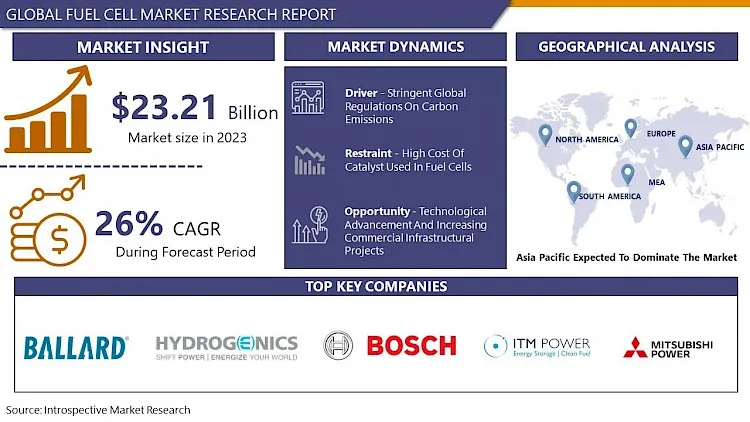
Fuel Cell Market size was valued at USD 29.24 Billion in 2024 and is projected to reach USD 185.76 Billion by 2032, growing at a CAGR of 26% from 2025 to 2032.
A fuel cell is an electrochemical cell that converts the chemical energy of a fuel (often hydrogen) and an oxidizing agent into electricity through a pair of redox reactions. Fuel cells are different from most batteries in requiring a continuous source of fuel and oxygen (usually from air) to sustain the chemical reaction, whereas in a battery the chemical energy usually comes from substances that are already present in the battery.
Fuel cells can produce electricity continuously for as long as fuel and oxygen are supplied. Fuel cells operate based on the principle of electrochemical reactions. They consist of two electrodes: an anode (negative electrode) and a cathode (positive electrode) separated by an electrolyte.
Fuel cells can achieve high energy conversion efficiency, especially in combined heat and power (CHP) applications. They produce minimal or no emissions, depending on the fuel source. Fuel cells offer a promising alternative to conventional combustion-based power generation methods, with the potential to reduce greenhouse gas emissions and reliance on fossil fuels in various applications.

Fuel Cell Market Trend Analysis
Stringent Global Regulations On Carbon Emissions
- In the face of growing concerns about climate change and the adverse environmental impacts of greenhouse gas emissions, countries worldwide have been implementing increasingly strict regulations aimed at curbing carbon emissions. These stringent global regulations on carbon emissions have emerged as a powerful catalyst for the growth and development of the fuel cell market. Fuel cells, with their high energy efficiency and minimal emissions, are well-positioned to play a pivotal role in meeting these regulatory requirements and driving sustainable energy solutions.
- With political leaders across the globe coming together to reduce their country’s carbon footprint and signing of the Paris Agreement has given a boost to green and renewable technologies to set themselves in markets. Fuel cells being a non-emission solution for power generation fit the category of green and renewable technologies and is growing owing to the carbon emission norms.
- One of the most significant areas where stringent carbon emission regulations have influenced the adoption of fuel cells is transportation. Governments and regulatory bodies worldwide have been implementing policies to reduce carbon emissions from vehicles. Electric vehicles (EVs) powered by hydrogen fuel cells, known as fuel cell vehicles (FCVs), have emerged as a promising solution. FCVs offer longer driving ranges and shorter refueling times compared to battery-electric vehicles. Additionally, they produce no tailpipe emissions, making them a compelling choice for achieving emission reduction targets.
Technological Advancement and Increasing Commercial Infrastructural Projects
- The fuel cell market is experiencing a significant upswing due to a confluence of factors, among which technological advancements and the propagation of commercial infrastructural projects stand out as major opportunities. As industries and governments worldwide seek cleaner and more efficient energy solutions, fuel cells are poised to play a pivotal role in addressing the growing demand for sustainable power generation and transportation.
- Germany’s H2Mobility program is supporting the adoption of fuel cell vehicles by developing fueling stations, which in turn, opens up opportunities for the deployment of fuel cells. Moreover, Europe's Hydrogen for Innovative Vehicles (HyFIVE) project aims to expand its hydrogen fuel cell network, developing stations in Italy, the United Kingdom, Austria, and Denmark.
- The energy landscape is evolving with a growing emphasis on clean and decentralized power generation. Fuel cells, especially in combined heat and power (CHP) configurations, are increasingly being integrated into commercial buildings, data centers, and industrial facilities. These projects offer a reliable and eco-friendly source of on-site electricity and heat.
- The development of hydrogen infrastructure is gaining momentum as governments and private entities invest in the construction of hydrogen refuelling stations. This infrastructure expansion is essential to support fuel cell vehicles (FCVs), especially in commercial fleets and public transportation.
Fuel Cell Market Segment Analysis:
The Fuel Cell market segments cover by Type, Application, Size, End User, and Region.
By Type, the PEMFC segment is Anticipated to Dominate the Market Over the Forecast period.
- The demand for PEMFC is higher owing to various benefits over other types. Benefits, such as flexibility in input fuel, compact design, lightweight, low cost, and solidity of electrolyte, will aid market escalation.
- PEMFC is widely used in applications such as forklifts, automobiles, telecommunications, primary systems, and backup power systems. Versatility is a significant factor that bolsters their demand in the forecast period.
- PEMFCs are known for their high energy conversion efficiency, typically ranging from 40% to 60%. This means they can convert a significant portion of the chemical energy in their fuel source (usually hydrogen) into electricity. This efficiency is particularly attractive in various applications where energy efficiency is crucial, such as automotive and portable power generation.
- PEMFCs operate at relatively low temperatures compared to other fuel cell types, typically around 80-100°C. This low operating temperature allows for a more straightforward thermal management system and reduces the risk of damage to materials, contributing to their durability and reliability. These factors driving the growth of PEMFCs segment during forecast period.
Fuel Cell Market Regional Insights:
Asia Pacific is Expected to Dominate the Market Over the Forecast period.
- The Asia-Pacific solid oxide fuel cell (SOFC) market is expected to reach $412 million USD by 2023, highlighting its significant position in the worldwide arena. Government initiatives, particularly in Japan, South Korea, and China, are critical in driving SOFC adoption. Reduce emissions, increase energy security, and accelerate technological advancement are the goals of these initiatives. The district's fast financial extension and industrialization drive up interest for proficient power arrangements, and SOFCs offer an upper hand because of their high productivity and low outflows profile. SOFCs are more suitable than customary energy sources thanks to mechanical progressions in materials, assembling, and framework plan that have worked on their presentation, solidness, and cost-viability.
- Foundation improvement, especially in hydrogen creation and transport, works with SOFC working, particularly in hydrogen-fueled applications. Increased environmental awareness and rising energy demands drive SOFC use in the region. With continuing government support, technical innovation, and rising market demand, the Asia-Pacific SOFC market is primed for further expansion, solidifying its critical role in defining the global energy landscape.
Fuel Cell Market Key Players Covered
- Ballard Power Systems (Canada)
- Hydrogenics (Canada)
- Plug Power (U.S.)
- Nuvera Fuel Cells, LLC (U.S.)
- FuelCell Energy(U.S.)
- W.L. Gore & Associates (U.S.)
- Bloom Energy (U.S.)
- Nexceris LLC (U.S.)
- Bosch (Germany)
- ElringKlinger (Germany)
- SOLIDpower Italia (Italy)
- Ceres Power (U.K.)
- AVL (Austria)
- Pragma Industries (France)
- Nedstack Fuel Cell Technology (Netherlands)
- Proton Motor Fuel Cell GmbH (Germany)
- ITM Power (U.K.)
- Elcogen (Estonia)
- SFS Energy AG (Germany)
- Blue World Technologies (Denmark)
- Roland Gumpert (Germany)
- AISIN (Japan)
- Horizon Fuel Cell Technologies (Singapore)
- Mitsubishi Hitachi Power Systems (Japan)
- Convion (Finland)
- Other Active Players
Key Industry Developments in the Fuel Cell Market
- In April 2024, Ballard Power Systems announced that it had received multiple purchase orders totaling 70 FCmove®-HD hydrogen fuel cell engines from its customer Wrightbus, a UK-based bus manufacturer deploying hydrogen-powered buses in the UK and Europe. Ballard expected the delivery of the fuel cell engines to occur in 2024, and the buses to enter into service in 2025. The hydrogen fuel cell engines were planned to power single- and double-decker buses in the UK and Germany.
- In February 2024, Plug Power Inc, a global leader in comprehensive hydrogen solutions, and Uline, the prominent distributor of shipping, industrial, and packaging materials, announced an expanded partnership for the deployment of Plug's hydrogen infrastructure and fuel cell solutions at Uline's new campus in Kenosha, Wisconsin. As part of this expanded partnership, an on-site hydrogen infrastructure was integrated, which involved the installation of an 18,000-gallon hydrogen storage tank and 17 hydrogen dispensers to cater to four distribution centers within the campus. Additionally, 250 fuel cell forklifts were added to the operations, with hydrogen being generated on-site using Plug's advanced infrastructure.
|
Global Fuel Cell Market |
|||
|
Base Year: |
2024 |
Forecast Period: |
2025-2032 |
|
Historical Data: |
2018 to 2023 |
Market Size in 2024: |
USD 29.24 Bn. |
|
Forecast Period 2025-32 CAGR: |
26% |
Market Size in 2032: |
USD 185.76 Bn. |
|
Segments Covered: |
By Type |
|
|
|
By Application |
|
||
|
By Size |
|
||
|
By Region |
|
||
|
Key Market Drivers: |
|
||
|
Key Market Restraints: |
|
||
|
Key Opportunities: |
|
||
|
Companies Covered in the report: |
|
||
Chapter 1: Introduction
1.1 Scope and Coverage
Chapter 2:Executive Summary
Chapter 3: Market Landscape
3.1 Market Dynamics
3.1.1 Drivers
3.1.2 Restraints
3.1.3 Opportunities
3.1.4 Challenges
3.2 Market Trend Analysis
3.3 PESTLE Analysis
3.4 Porter's Five Forces Analysis
3.5 Industry Value Chain Analysis
3.6 Ecosystem
3.7 Regulatory Landscape
3.8 Price Trend Analysis
3.9 Patent Analysis
3.10 Technology Evolution
3.11 Investment Pockets
3.12 Import-Export Analysis
Chapter 4: Fuel Cell Market by Type (2018-2032)
4.1 Fuel Cell Market Snapshot and Growth Engine
4.2 Market Overview
4.3 PEMFC
4.3.1 Introduction and Market Overview
4.3.2 Historic and Forecasted Market Size in Value USD and Volume Units
4.3.3 Key Market Trends, Growth Factors, and Opportunities
4.3.4 Geographic Segmentation Analysis
4.4 SOFC
4.5 PAFC
4.6 MFC
4.7 DMFC
4.8 AFC
Chapter 5: Fuel Cell Market by Application (2018-2032)
5.1 Fuel Cell Market Snapshot and Growth Engine
5.2 Market Overview
5.3 Portable
5.3.1 Introduction and Market Overview
5.3.2 Historic and Forecasted Market Size in Value USD and Volume Units
5.3.3 Key Market Trends, Growth Factors, and Opportunities
5.3.4 Geographic Segmentation Analysis
5.4 Stationary
5.5 Vehicles (FCV)
Chapter 6: Fuel Cell Market by Size (2018-2032)
6.1 Fuel Cell Market Snapshot and Growth Engine
6.2 Market Overview
6.3 Small
6.3.1 Introduction and Market Overview
6.3.2 Historic and Forecasted Market Size in Value USD and Volume Units
6.3.3 Key Market Trends, Growth Factors, and Opportunities
6.3.4 Geographic Segmentation Analysis
6.4 Large
Chapter 7: Company Profiles and Competitive Analysis
7.1 Competitive Landscape
7.1.1 Competitive Benchmarking
7.1.2 Fuel Cell Market Share by Manufacturer (2024)
7.1.3 Industry BCG Matrix
7.1.4 Heat Map Analysis
7.1.5 Mergers and Acquisitions
7.2 HILL-ROM HOLDINGS INC. (U.S.)
7.2.1 Company Overview
7.2.2 Key Executives
7.2.3 Company Snapshot
7.2.4 Role of the Company in the Market
7.2.5 Sustainability and Social Responsibility
7.2.6 Operating Business Segments
7.2.7 Product Portfolio
7.2.8 Business Performance
7.2.9 Key Strategic Moves and Recent Developments
7.2.10 SWOT Analysis
7.3 BOSTON SCIENTIFIC (U.S.)
7.4 MEDTRONIC (U.S.)
7.5 ETHICON (U.S.)
7.6 TELEFLEX (U.S.)
7.7 BEAVER-VISITEC INTERNATIONAL (BVI) MEDICAL (U.S.)
7.8 STRYKER (U.S.)
7.9 ASPEN SURGICAL (U.S.)
7.10 SURGICAL SPECIALTIES CORPORATION (U.S.)
7.11 MYCO MEDICAL (U.S.)
7.12 CINCINNATI SURGICAL COMPANY (U.S.)
7.13 PL MEDICAL COLLC. (U.S.)
7.14 HU-FRIEDY MFG. COLLC (U.S.)
7.15 INTEGRA LIFE SCIENCES CORPORATION (UNITED STATES)
7.16 SOUTHMEDIC (CANADA)
7.17 SWANN-MORTON LIMITED (U.K)
7.18 VOGT MEDICAL (GERMANY)
7.19 ERBE ELEKTROMEDIZIN GMBH (GERMANY)
7.20 BRAUN MELSUNGEN (GERMANY)
7.21 VOGT MEDICAL VERTRIEB GMBH (GERMANY)
7.22 OLYMPUS CORPORATION (JAPAN)
7.23 KAI INDUSTRIES COLTD. (JAPAN)
7.24 QINGDAO SINOLAND MEDICAL TECHNOLOGY CO. (CHINA)
7.25 ANHUI INTRAG MEDICAL TECHS CO. (CHINA)
7.26 SHANGHAI SUN-SHORE MEDICAL INSTRUMENTS CO. (CHINA)
Chapter 8: Global Fuel Cell Market By Region
8.1 Overview
8.2. North America Fuel Cell Market
8.2.1 Key Market Trends, Growth Factors and Opportunities
8.2.2 Top Key Companies
8.2.3 Historic and Forecasted Market Size by Segments
8.2.4 Historic and Forecasted Market Size by Type
8.2.4.1 PEMFC
8.2.4.2 SOFC
8.2.4.3 PAFC
8.2.4.4 MFC
8.2.4.5 DMFC
8.2.4.6 AFC
8.2.5 Historic and Forecasted Market Size by Application
8.2.5.1 Portable
8.2.5.2 Stationary
8.2.5.3 Vehicles (FCV)
8.2.6 Historic and Forecasted Market Size by Size
8.2.6.1 Small
8.2.6.2 Large
8.2.7 Historic and Forecast Market Size by Country
8.2.7.1 US
8.2.7.2 Canada
8.2.7.3 Mexico
8.3. Eastern Europe Fuel Cell Market
8.3.1 Key Market Trends, Growth Factors and Opportunities
8.3.2 Top Key Companies
8.3.3 Historic and Forecasted Market Size by Segments
8.3.4 Historic and Forecasted Market Size by Type
8.3.4.1 PEMFC
8.3.4.2 SOFC
8.3.4.3 PAFC
8.3.4.4 MFC
8.3.4.5 DMFC
8.3.4.6 AFC
8.3.5 Historic and Forecasted Market Size by Application
8.3.5.1 Portable
8.3.5.2 Stationary
8.3.5.3 Vehicles (FCV)
8.3.6 Historic and Forecasted Market Size by Size
8.3.6.1 Small
8.3.6.2 Large
8.3.7 Historic and Forecast Market Size by Country
8.3.7.1 Russia
8.3.7.2 Bulgaria
8.3.7.3 The Czech Republic
8.3.7.4 Hungary
8.3.7.5 Poland
8.3.7.6 Romania
8.3.7.7 Rest of Eastern Europe
8.4. Western Europe Fuel Cell Market
8.4.1 Key Market Trends, Growth Factors and Opportunities
8.4.2 Top Key Companies
8.4.3 Historic and Forecasted Market Size by Segments
8.4.4 Historic and Forecasted Market Size by Type
8.4.4.1 PEMFC
8.4.4.2 SOFC
8.4.4.3 PAFC
8.4.4.4 MFC
8.4.4.5 DMFC
8.4.4.6 AFC
8.4.5 Historic and Forecasted Market Size by Application
8.4.5.1 Portable
8.4.5.2 Stationary
8.4.5.3 Vehicles (FCV)
8.4.6 Historic and Forecasted Market Size by Size
8.4.6.1 Small
8.4.6.2 Large
8.4.7 Historic and Forecast Market Size by Country
8.4.7.1 Germany
8.4.7.2 UK
8.4.7.3 France
8.4.7.4 The Netherlands
8.4.7.5 Italy
8.4.7.6 Spain
8.4.7.7 Rest of Western Europe
8.5. Asia Pacific Fuel Cell Market
8.5.1 Key Market Trends, Growth Factors and Opportunities
8.5.2 Top Key Companies
8.5.3 Historic and Forecasted Market Size by Segments
8.5.4 Historic and Forecasted Market Size by Type
8.5.4.1 PEMFC
8.5.4.2 SOFC
8.5.4.3 PAFC
8.5.4.4 MFC
8.5.4.5 DMFC
8.5.4.6 AFC
8.5.5 Historic and Forecasted Market Size by Application
8.5.5.1 Portable
8.5.5.2 Stationary
8.5.5.3 Vehicles (FCV)
8.5.6 Historic and Forecasted Market Size by Size
8.5.6.1 Small
8.5.6.2 Large
8.5.7 Historic and Forecast Market Size by Country
8.5.7.1 China
8.5.7.2 India
8.5.7.3 Japan
8.5.7.4 South Korea
8.5.7.5 Malaysia
8.5.7.6 Thailand
8.5.7.7 Vietnam
8.5.7.8 The Philippines
8.5.7.9 Australia
8.5.7.10 New Zealand
8.5.7.11 Rest of APAC
8.6. Middle East & Africa Fuel Cell Market
8.6.1 Key Market Trends, Growth Factors and Opportunities
8.6.2 Top Key Companies
8.6.3 Historic and Forecasted Market Size by Segments
8.6.4 Historic and Forecasted Market Size by Type
8.6.4.1 PEMFC
8.6.4.2 SOFC
8.6.4.3 PAFC
8.6.4.4 MFC
8.6.4.5 DMFC
8.6.4.6 AFC
8.6.5 Historic and Forecasted Market Size by Application
8.6.5.1 Portable
8.6.5.2 Stationary
8.6.5.3 Vehicles (FCV)
8.6.6 Historic and Forecasted Market Size by Size
8.6.6.1 Small
8.6.6.2 Large
8.6.7 Historic and Forecast Market Size by Country
8.6.7.1 Turkiye
8.6.7.2 Bahrain
8.6.7.3 Kuwait
8.6.7.4 Saudi Arabia
8.6.7.5 Qatar
8.6.7.6 UAE
8.6.7.7 Israel
8.6.7.8 South Africa
8.7. South America Fuel Cell Market
8.7.1 Key Market Trends, Growth Factors and Opportunities
8.7.2 Top Key Companies
8.7.3 Historic and Forecasted Market Size by Segments
8.7.4 Historic and Forecasted Market Size by Type
8.7.4.1 PEMFC
8.7.4.2 SOFC
8.7.4.3 PAFC
8.7.4.4 MFC
8.7.4.5 DMFC
8.7.4.6 AFC
8.7.5 Historic and Forecasted Market Size by Application
8.7.5.1 Portable
8.7.5.2 Stationary
8.7.5.3 Vehicles (FCV)
8.7.6 Historic and Forecasted Market Size by Size
8.7.6.1 Small
8.7.6.2 Large
8.7.7 Historic and Forecast Market Size by Country
8.7.7.1 Brazil
8.7.7.2 Argentina
8.7.7.3 Rest of SA
Chapter 9 Analyst Viewpoint and Conclusion
9.1 Recommendations and Concluding Analysis
9.2 Potential Market Strategies
Chapter 10 Research Methodology
10.1 Research Process
10.2 Primary Research
10.3 Secondary Research
|
Global Fuel Cell Market |
|||
|
Base Year: |
2024 |
Forecast Period: |
2025-2032 |
|
Historical Data: |
2018 to 2023 |
Market Size in 2024: |
USD 29.24 Bn. |
|
Forecast Period 2025-32 CAGR: |
26% |
Market Size in 2032: |
USD 185.76 Bn. |
|
Segments Covered: |
By Type |
|
|
|
By Application |
|
||
|
By Size |
|
||
|
By Region |
|
||
|
Key Market Drivers: |
|
||
|
Key Market Restraints: |
|
||
|
Key Opportunities: |
|
||
|
Companies Covered in the report: |
|
||


