


Global Fortified Salt Market Overview
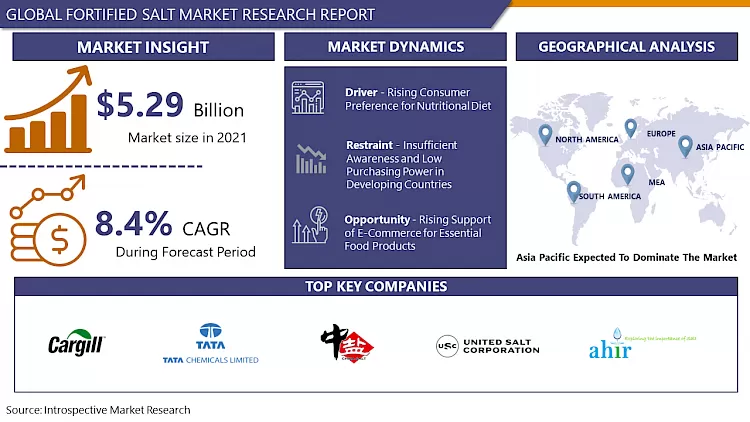
Global Fortified Salt Market was valued at USD 5.29 billion in 2021 and is expected to reach USD 9.30 billion by the year 2028, at a CAGR of 8.4%.
Salt is an ideal porter for micronutrient fortification and micronutrients such as iodine and iron can be found through salt, which ingurgitated by an individual provides various nutritional benefits, this micronutrient added salt is called as fortified salt. Fortification of salt is appreciated as one of the most cost-effective methods to tackle deficiency of iron and iodine as it is universally consumed by all income groups and age segments. Double fortified salt (DFS) is a form of table salt produced with mixed iron and iodine. When consumed in regular food, it may help to reduce iron deficiency and iodine deficiency disorders which helps to growth of fortified salt market.
Moreover, Iron insufficiency Anemia (IDA) and Iodine Deficiency Disorder (IDD) come up with for the micronutrient deficiencies of public health significance over the globe, noticeably in the developing and under-developed countries. For instance, according to TATA Trust India, the trusts reinforced DFS interference in the government’s mid-day meal, Integrated Child Development Services and Public Distribution Services Program have benefited around 68 million people from India.

COVID-19 Impact Analysis of Fortified Salt Market
During COVID 19 pandemic growing consciousness as well as necessity among consumers about immunity to safeguard themselves from the virus had fueled the sales of such products. This factor leads to growth in demand for fortified salt. However, COVID-19 has obstructed the value chain across the globe due to lockdown of production units, limitations for transportation, and closures of borders across the nations which leads to hindering the production and sales of the product across the globe.
Report Coverage:
The global market report of Fortified Salt Market by the Introspective Market Research includes qualitative and quantitative insights. The company also offers a detailed analysis of the market size and growth rate of the possible segments. The report tracks recent developments, key players and start-up’s details that are working in the industry. The report offers surplus of information about market entry strategies, regulatory framework and reimbursement scenario.
Market Dynamics And Factor
Drivers:
The key driving factor for the global fortified salts market is rising consumer preference for nutritional diet coupled with constantly mounting malnutrition cases among the children and adults have resulted in growing surge for fortified salts over developing countries. The main factor such as growing incidence of anemia due to iron deficiency is further supplementing the sales for fortified salts. In addition, the rapid growing in sales of fortified salts due to the increasing demand for food preservation due to rising consumption of processed and packaged food is expected to drive the global fortified salts market.
An increasing hair loss problem in the youths and middle-aged people in anticipated to product surge in upcoming years. The growing hair follicle strength will be prime driving factor to growth of the market.
Restraints:
Insufficient awareness and low purchasing power in developing countries, health menacing including tuberculosis and kidney ailments, and thyroid papillary cancer owing to over consumption may hamper the global fortified salts market growth in projected period.
Opportunities:
Rising support of e-commerce for essential food products is anticipated to grow the sales of the product in developed countries.
Growing the number of miscarriages as well as low mental growth witnessed in the children resulted to lower intake of iron, has initiation of programs by the government in developing nations for the promoting benefits of fortified salt, such positive moves will stimulate the growth in fortified salt industry and is expected to grow in upcoming years.
Market Segmentation
Type Insights
Based on product type, double fortified salt is more beneficial with their delivery of crucial daily amount of iodine and iron, which dominating the market. Based on application, food and beverage industry dominated the fortified salt market owing to usage in food products, beverages and others. Based on distribution channels, owing to easy availability in grocery store with the discount price for the customer dominates the market.
Regional Analysis:
Asia Pacific dominates the market owing to high population, highest usage of fortified salt as well as being presence of major key players such as Tata Chemicals, Annapurna Salt, Bajaj Salt, Hindustan Salt, Tamil Nadu Salt Corporation in the region are factors leads to boost the market over forecast period.
Rising the obese population will drive the market expansion as more than one third od adults are overweight in North America region. The fortified salt product helps to maintains full energy level in the body by proper calorie consumption, without allowing extra fat deposition.
The Europe region has adopted salt reduction framework owing to excessive intake of salt which has resulted in increased sodium product in the body. Which leads to moderate growth in projected period.
Players Covered in Fortified Salt Market are:
- Cargill Incorporated
- Tata Chemicals
- China National Salt Industry
- United Salt Corporation
- Kutch Brine Chem Industries
- Sambhar
- AkzoNobel
- Schweizer Salinen
- Ankur Salt
- Windsor Salt
- Annapurna Salt
- Bajaj Salt
- Super Salt
- Shreeram Chem Food
- Saboo Sodium Choro
- Ahir Salt Industries
- Hindustan Salt
- Compass Minerals
- Tamil Nadu Salt Corporation and other major players.
Key Industry Developments
- In April 2017, TATA Chemicals launches fortified salt products in East African countries. The instigate of two flagship salt-based products for the Kenyan livestock is the peak of the long journey of market analysis and purchase of new marketing skills.
- In December 2019, China National Salt Industry decided to keep innovating in developing in salt business. China National Salt Industry is the leading and only state-owned enterprises of China’s salt industry. In addition, company also announced to innovation in bringing the health value of salt and will continue to design low-sodium salt, while at the same time try to add favorable microelements to salt to make it healthier for consumers.
|
Global Fortified Salt Market |
|||
|
Base Year: |
2021 |
Forecast Period: |
2022-2028 |
|
Historical Data: |
2016 to 2020 |
Market Size in 2021: |
USD 5.29 Bn. |
|
Forecast Period 2022-28 CAGR: |
8.4% |
Market Size in 2028: |
USD 9.30 Bn. |
|
Segments Covered: |
By Type |
|
|
|
By Application |
|
||
|
By Distribution Channel |
|
||
|
By Region |
|
||
|
Key Market Drivers: |
|
||
|
Key Market Restraints: |
|
||
|
Key Opportunities: |
|
||
|
Companies Covered in the report: |
|
||
1.1 Scope and Coverage
Chapter 2:Executive Summary
Chapter 3: Market Landscape
3.1 Market Dynamics
3.1.1 Drivers
3.1.2 Restraints
3.1.3 Opportunities
3.1.4 Challenges
3.2 Market Trend Analysis
3.3 PESTLE Analysis
3.4 Porter's Five Forces Analysis
3.5 Industry Value Chain Analysis
3.6 Ecosystem
3.7 Regulatory Landscape
3.8 Price Trend Analysis
3.9 Patent Analysis
3.10 Technology Evolution
3.11 Investment Pockets
3.12 Import-Export Analysis
Chapter 4: Fortified Salt Market by Type (2018-2032)
4.1 Fortified Salt Market Snapshot and Growth Engine
4.2 Market Overview
4.3 Iodine
4.3.1 Introduction and Market Overview
4.3.2 Historic and Forecasted Market Size in Value USD and Volume Units
4.3.3 Key Market Trends, Growth Factors, and Opportunities
4.3.4 Geographic Segmentation Analysis
4.4 Iron
4.5 Double Fortified Salt
Chapter 5: Fortified Salt Market by Application (2018-2032)
5.1 Fortified Salt Market Snapshot and Growth Engine
5.2 Market Overview
5.3 Food Processing
5.3.1 Introduction and Market Overview
5.3.2 Historic and Forecasted Market Size in Value USD and Volume Units
5.3.3 Key Market Trends, Growth Factors, and Opportunities
5.3.4 Geographic Segmentation Analysis
5.4 Household
5.5 Animal Feed
5.6 Hospitality & Services
5.7 Others
Chapter 6: Fortified Salt Market by Distribution Channel (2018-2032)
6.1 Fortified Salt Market Snapshot and Growth Engine
6.2 Market Overview
6.3 Hypermarket/Supermarket
6.3.1 Introduction and Market Overview
6.3.2 Historic and Forecasted Market Size in Value USD and Volume Units
6.3.3 Key Market Trends, Growth Factors, and Opportunities
6.3.4 Geographic Segmentation Analysis
6.4 Grocery Stores
6.5 Online
6.6 Others
Chapter 7: Company Profiles and Competitive Analysis
7.1 Competitive Landscape
7.1.1 Competitive Benchmarking
7.1.2 Fortified Salt Market Share by Manufacturer (2024)
7.1.3 Industry BCG Matrix
7.1.4 Heat Map Analysis
7.1.5 Mergers and Acquisitions
7.2 BAYER CROP SCIENCES AG
7.2.1 Company Overview
7.2.2 Key Executives
7.2.3 Company Snapshot
7.2.4 Role of the Company in the Market
7.2.5 Sustainability and Social Responsibility
7.2.6 Operating Business Segments
7.2.7 Product Portfolio
7.2.8 Business Performance
7.2.9 Key Strategic Moves and Recent Developments
7.2.10 SWOT Analysis
7.3 VALENT BIOSCIENCES CORPORATIONS
7.4 BRANDT
7.5 MARRON BIO INNOVATIONS
7.6 AGRI LIFE
7.7 MONSANTO
7.8 THE REAL IPM COMPANY
7.9 BIO HUMA NETICS INC.
7.10 T. STANES AND COMPANY
7.11 SYNGENTA
7.12 CERTIS USA
7.13 DOW AGRO SCIENCES
7.14 HORIZON AGROTECH
7.15 BASF SE
7.16 FMC CORPORATION AND OTHER MAJOR PLAYERS.
Chapter 8: Global Fortified Salt Market By Region
8.1 Overview
8.2. North America Fortified Salt Market
8.2.1 Key Market Trends, Growth Factors and Opportunities
8.2.2 Top Key Companies
8.2.3 Historic and Forecasted Market Size by Segments
8.2.4 Historic and Forecasted Market Size by Type
8.2.4.1 Iodine
8.2.4.2 Iron
8.2.4.3 Double Fortified Salt
8.2.5 Historic and Forecasted Market Size by Application
8.2.5.1 Food Processing
8.2.5.2 Household
8.2.5.3 Animal Feed
8.2.5.4 Hospitality & Services
8.2.5.5 Others
8.2.6 Historic and Forecasted Market Size by Distribution Channel
8.2.6.1 Hypermarket/Supermarket
8.2.6.2 Grocery Stores
8.2.6.3 Online
8.2.6.4 Others
8.2.7 Historic and Forecast Market Size by Country
8.2.7.1 US
8.2.7.2 Canada
8.2.7.3 Mexico
8.3. Eastern Europe Fortified Salt Market
8.3.1 Key Market Trends, Growth Factors and Opportunities
8.3.2 Top Key Companies
8.3.3 Historic and Forecasted Market Size by Segments
8.3.4 Historic and Forecasted Market Size by Type
8.3.4.1 Iodine
8.3.4.2 Iron
8.3.4.3 Double Fortified Salt
8.3.5 Historic and Forecasted Market Size by Application
8.3.5.1 Food Processing
8.3.5.2 Household
8.3.5.3 Animal Feed
8.3.5.4 Hospitality & Services
8.3.5.5 Others
8.3.6 Historic and Forecasted Market Size by Distribution Channel
8.3.6.1 Hypermarket/Supermarket
8.3.6.2 Grocery Stores
8.3.6.3 Online
8.3.6.4 Others
8.3.7 Historic and Forecast Market Size by Country
8.3.7.1 Russia
8.3.7.2 Bulgaria
8.3.7.3 The Czech Republic
8.3.7.4 Hungary
8.3.7.5 Poland
8.3.7.6 Romania
8.3.7.7 Rest of Eastern Europe
8.4. Western Europe Fortified Salt Market
8.4.1 Key Market Trends, Growth Factors and Opportunities
8.4.2 Top Key Companies
8.4.3 Historic and Forecasted Market Size by Segments
8.4.4 Historic and Forecasted Market Size by Type
8.4.4.1 Iodine
8.4.4.2 Iron
8.4.4.3 Double Fortified Salt
8.4.5 Historic and Forecasted Market Size by Application
8.4.5.1 Food Processing
8.4.5.2 Household
8.4.5.3 Animal Feed
8.4.5.4 Hospitality & Services
8.4.5.5 Others
8.4.6 Historic and Forecasted Market Size by Distribution Channel
8.4.6.1 Hypermarket/Supermarket
8.4.6.2 Grocery Stores
8.4.6.3 Online
8.4.6.4 Others
8.4.7 Historic and Forecast Market Size by Country
8.4.7.1 Germany
8.4.7.2 UK
8.4.7.3 France
8.4.7.4 The Netherlands
8.4.7.5 Italy
8.4.7.6 Spain
8.4.7.7 Rest of Western Europe
8.5. Asia Pacific Fortified Salt Market
8.5.1 Key Market Trends, Growth Factors and Opportunities
8.5.2 Top Key Companies
8.5.3 Historic and Forecasted Market Size by Segments
8.5.4 Historic and Forecasted Market Size by Type
8.5.4.1 Iodine
8.5.4.2 Iron
8.5.4.3 Double Fortified Salt
8.5.5 Historic and Forecasted Market Size by Application
8.5.5.1 Food Processing
8.5.5.2 Household
8.5.5.3 Animal Feed
8.5.5.4 Hospitality & Services
8.5.5.5 Others
8.5.6 Historic and Forecasted Market Size by Distribution Channel
8.5.6.1 Hypermarket/Supermarket
8.5.6.2 Grocery Stores
8.5.6.3 Online
8.5.6.4 Others
8.5.7 Historic and Forecast Market Size by Country
8.5.7.1 China
8.5.7.2 India
8.5.7.3 Japan
8.5.7.4 South Korea
8.5.7.5 Malaysia
8.5.7.6 Thailand
8.5.7.7 Vietnam
8.5.7.8 The Philippines
8.5.7.9 Australia
8.5.7.10 New Zealand
8.5.7.11 Rest of APAC
8.6. Middle East & Africa Fortified Salt Market
8.6.1 Key Market Trends, Growth Factors and Opportunities
8.6.2 Top Key Companies
8.6.3 Historic and Forecasted Market Size by Segments
8.6.4 Historic and Forecasted Market Size by Type
8.6.4.1 Iodine
8.6.4.2 Iron
8.6.4.3 Double Fortified Salt
8.6.5 Historic and Forecasted Market Size by Application
8.6.5.1 Food Processing
8.6.5.2 Household
8.6.5.3 Animal Feed
8.6.5.4 Hospitality & Services
8.6.5.5 Others
8.6.6 Historic and Forecasted Market Size by Distribution Channel
8.6.6.1 Hypermarket/Supermarket
8.6.6.2 Grocery Stores
8.6.6.3 Online
8.6.6.4 Others
8.6.7 Historic and Forecast Market Size by Country
8.6.7.1 Turkiye
8.6.7.2 Bahrain
8.6.7.3 Kuwait
8.6.7.4 Saudi Arabia
8.6.7.5 Qatar
8.6.7.6 UAE
8.6.7.7 Israel
8.6.7.8 South Africa
8.7. South America Fortified Salt Market
8.7.1 Key Market Trends, Growth Factors and Opportunities
8.7.2 Top Key Companies
8.7.3 Historic and Forecasted Market Size by Segments
8.7.4 Historic and Forecasted Market Size by Type
8.7.4.1 Iodine
8.7.4.2 Iron
8.7.4.3 Double Fortified Salt
8.7.5 Historic and Forecasted Market Size by Application
8.7.5.1 Food Processing
8.7.5.2 Household
8.7.5.3 Animal Feed
8.7.5.4 Hospitality & Services
8.7.5.5 Others
8.7.6 Historic and Forecasted Market Size by Distribution Channel
8.7.6.1 Hypermarket/Supermarket
8.7.6.2 Grocery Stores
8.7.6.3 Online
8.7.6.4 Others
8.7.7 Historic and Forecast Market Size by Country
8.7.7.1 Brazil
8.7.7.2 Argentina
8.7.7.3 Rest of SA
Chapter 9 Analyst Viewpoint and Conclusion
9.1 Recommendations and Concluding Analysis
9.2 Potential Market Strategies
Chapter 10 Research Methodology
10.1 Research Process
10.2 Primary Research
10.3 Secondary Research
|
Global Fortified Salt Market |
|||
|
Base Year: |
2021 |
Forecast Period: |
2022-2028 |
|
Historical Data: |
2016 to 2020 |
Market Size in 2021: |
USD 5.29 Bn. |
|
Forecast Period 2022-28 CAGR: |
8.4% |
Market Size in 2028: |
USD 9.30 Bn. |
|
Segments Covered: |
By Type |
|
|
|
By Application |
|
||
|
By Distribution Channel |
|
||
|
By Region |
|
||
|
Key Market Drivers: |
|
||
|
Key Market Restraints: |
|
||
|
Key Opportunities: |
|
||
|
Companies Covered in the report: |
|
||
Frequently Asked Questions :
The forecast period in the Fortified Salt Market research report is 2022-2028.
Cargill Incorporated, Tata Chemicals, China National Salt Industry, United Salt Corporation, Kutch Brine Chem Industries, Sambhar, AkzoNobel, Schweizer Salinen, Ankur Salt, Windsor Salt, Annapurna Salt, Bajaj Salt, Super Salt, Shreeram Chem Food, Saboo Sodium Choro, Ahir Salt Industries, Hindustan Salt, Compass Minerals, Tamil Nadu Salt Corporation, and other major players.
The Fortified Salt Market is segmented into Vehicle Type, Component, Fuel Type and region. By Vehicle Type, the market is categorized into Passenger cars, and Commercial Vehicles. By Component, the market is categorized into Pump, Urea Tank, Injector, and ECU. By Fuel Type, the market is categorized into Diesel and Gasoline. By region, it is analyzed across North America (U.S.; Canada; Mexico), Europe (Germany; U.K.; France; Italy; Russia; Spain, etc.), Asia-Pacific (China; India; Japan; Southeast Asia, etc.), South America (Brazil; Argentina, etc.), Middle East & Africa (Saudi Arabia; South Africa, etc.).
Fortification of salt is appreciated as one of the most cost-effective methods to tackle deficiency of iron and iodine as it is universally consumed by all income groups and age segments.
The Fortified Salt Market was valued at USD 5.29 Billion in 2021 and is projected to reach USD 9.30 Billion by 2028, growing at a CAGR of 8.4% from 2022 to 2028.


