


Farming as a Service Market Synopsis
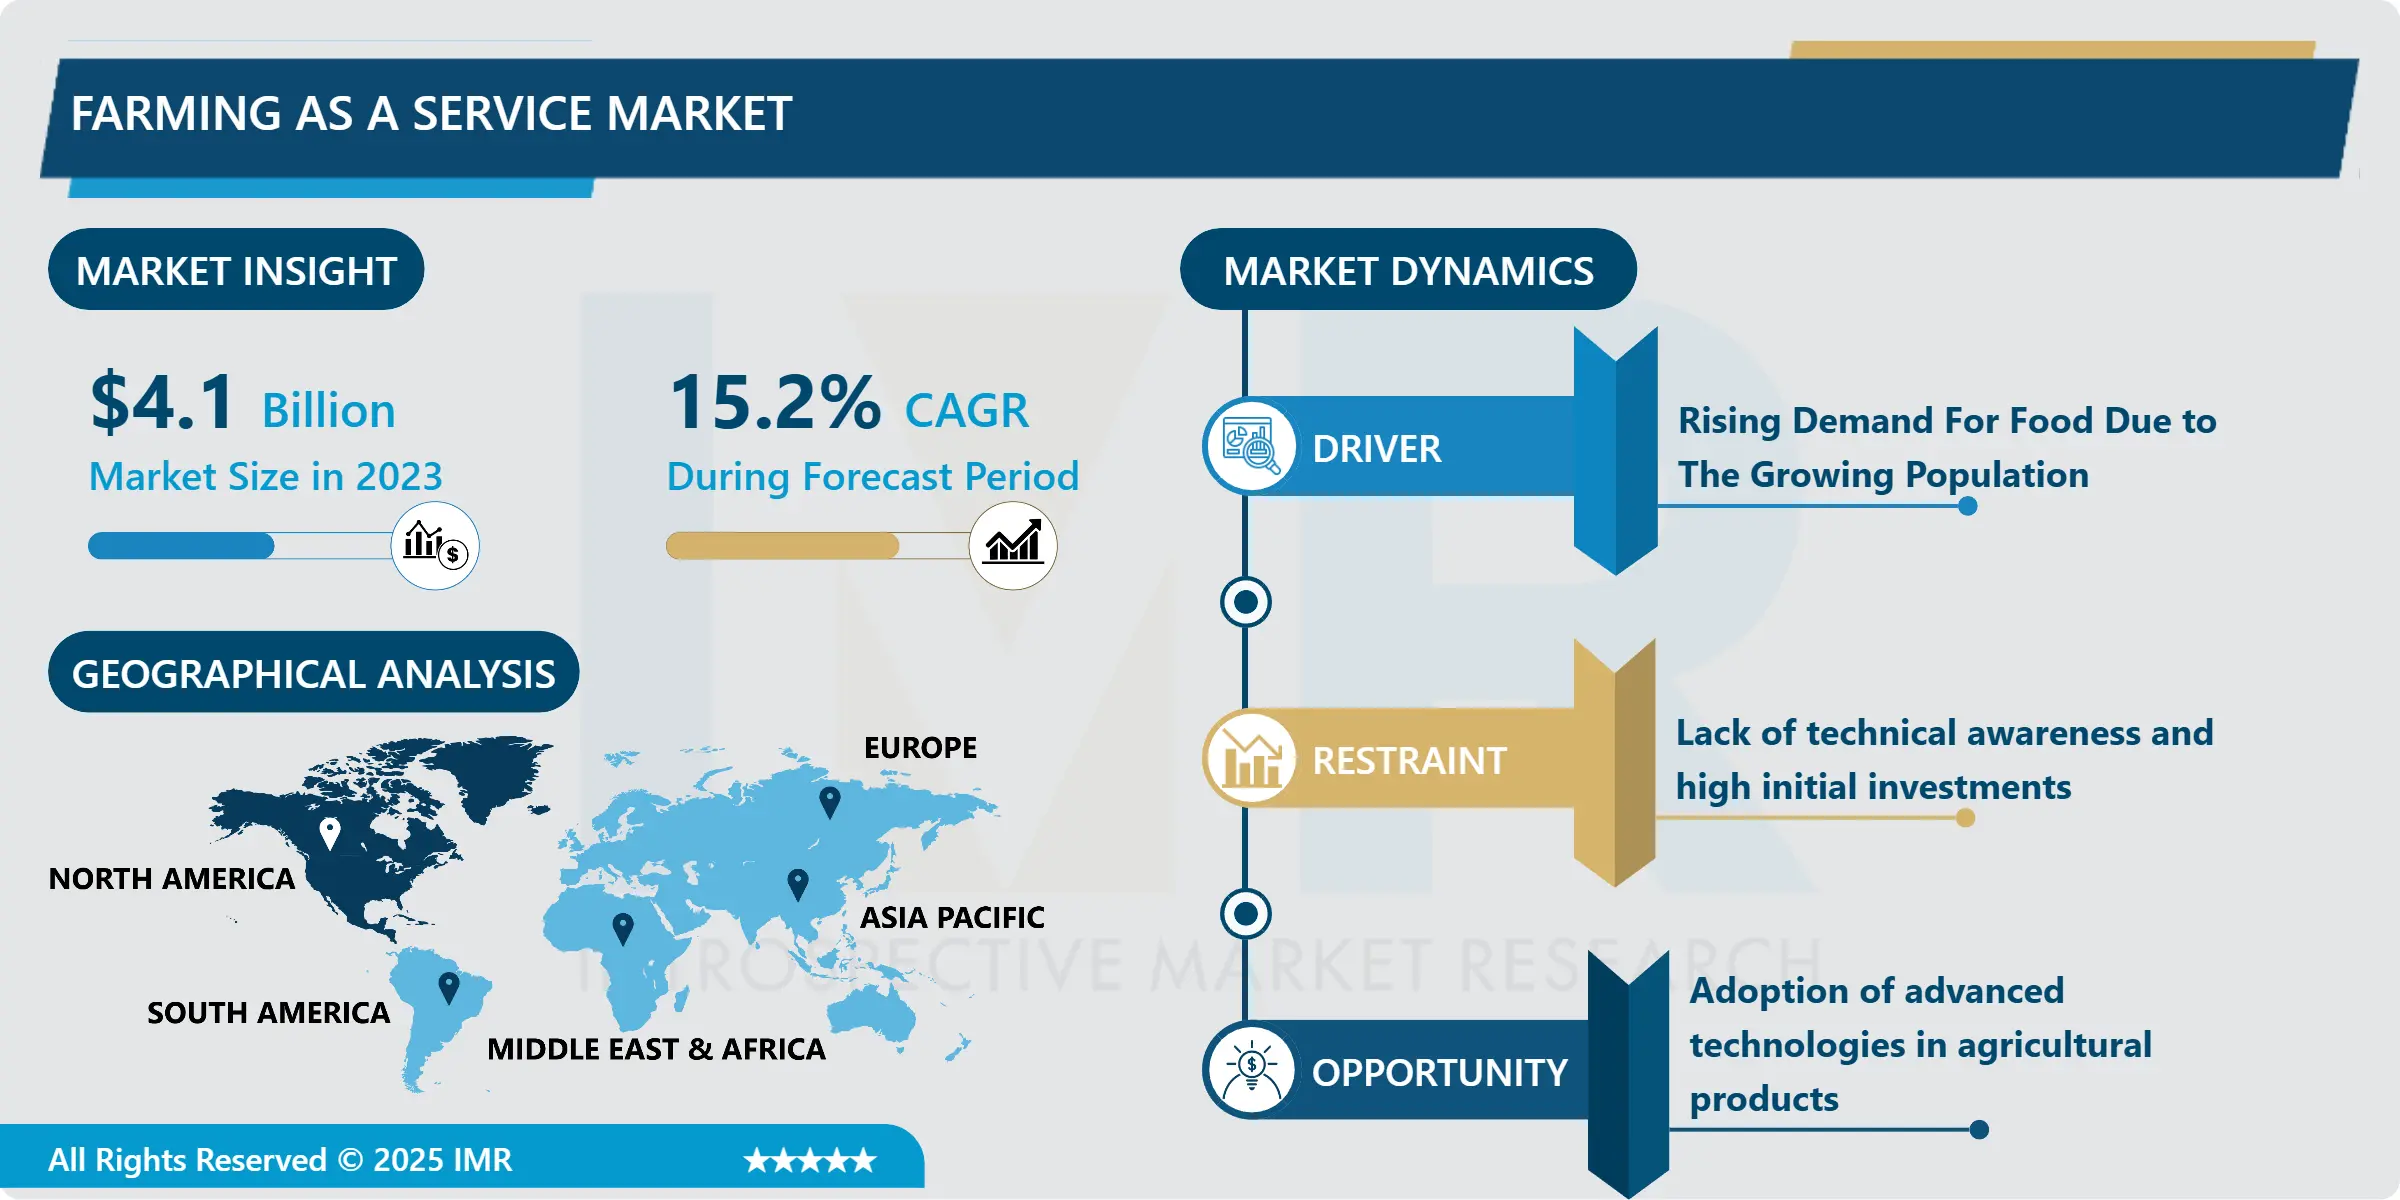
Farming as a Service Market Size Was Valued at USD 4.72 Billion in 2024 and is Projected to Reach USD 14.7 Billion by 2032, Growing at a CAGR of 15.2% From 2025-2032.
Farming as a Service (FaaS) is a business model where a farmer can demand for a service on demand, on a usage or a subscription basis that provides sophisticated, professional and easy to use solutions for farmers. It is a structure of professional services that provide a range of expert agrarian management services. It also offers the farmers the various services like precision farming tools, analytics, utility & labor services, equipment rentals and access to markets & broader audience among others. In addition, through FaaS, farmers get convenient access to crop production inputs, timely availabilities of labor, desired machinery and equipment hiring options and utility facilities such as irrigation services & electricity.
FAAS market is under the increased legal interest, particularly in terms of data protection and clarity of contractual relationships. Since farming is a service, the essence of which is the gathering and processing of substantial amounts of data on yields, climate, and ground conditions, the topic of data protection and cybersecurity is critical. Protection of farmers’ and other stakeholders’ data is important to foster trust and compliance with the law. Additionally, maintaining clarity of subscription terms, service level agreements, and any legal implications that may be linked to the farming as a service become fundamental determinants of compliance in the context. This concern with regulatory compliance is crucial to long-term development and in an ever-shifting environment in the agricultural technology industry
Technological expansion especially in categories like agricultural products is the main reason behind the farming as a service market. Automated data management software, GPS, Yield mapping software (YMS), variable rate technology (VRT), and the mapping software play a crucial role in increasing profit levels and the fertility of the soil besides reducing the cost of farming and encouraging sustainable farming.
Further, it has also seen the increased adoption of internet of things (IoT) in agriculture and a decrease in energy usage as well as the cost. As such, the following factors contribute to the growth of the farming as a service market size. But high initial investments coupled with low technical awareness is a real concern that is restraining the farming as a service market. However, there will be more opportunities for agritech start-ups in the future and this will contribute to the major growth opportunities in the farming as a service market.
Hence, it can be observed that precision and resource investment in software development lead to better farm management approaches that decrease energy consumption and make the entire process more cost effective. Due to the time constraint and effectiveness of smart farming solutions over the conventional methods, the smart farming market is poised to grow.

Farming as a Service Market Trend Analysis
Farming as a Service Market Drivers- Implementation of Cutting-Edge Technologies in Agricultural Commodities
- If adopted to the maximum, smart agriculture enables farmers to combat the impact of climate change on crops by collating geospatial data on planting, soil, livestock, and other inter- and intra-field information. Additionally, smart agriculture also offers knowledge on the amount of pesticide, herbicide, liquid fertilizer, and irrigation required to be used, minimizing wastage. Computer aided data management, GPS, yield mapping software (YMS), variable rate technology (VRT), and mapping software assist in increasing profit growth and soil fertility, decreasing the relative costs in farming and encouraging sustainable farming.
- Another notable feature of smart agricultural technologies is increased business productivity through the use of automation and improved product quality at lower farming expenses. For this reason, most farming entrepreneurs are already using the following innovative and effective agricultural tools to increase productivity and profits. In addition, smart agriculture techniques were designed to ensure that agribusiness becomes more lucrative than it has ever been.
Farming as a Service Market Opportunity- Increasing Adoption Of The Internet Of Things (Iot) In Agriculture
- There is an increased use of Internet of Things (IoT) in agriculture and farmers get real time assistance through the use of loT application. The plan of loT applications in traditional agriculture leads to more efficient use of time and resources, such as a land, energy or water for farming and thus farmers can concentrate on delivering food of good quality to the consumers. Furthermore, farmers are also able lo address significant changes in the air efficiency, humidity, and weather due to the aggressive adaption of loT technology by the agricultural industry. It incorporates various management tools and technologies, visualization, and data analytics to perform the tasks that are typically accomplished in farming activities. By initiating smart sustainable solutions of energy and water resource at loT technology in agriculture, the farm production is Increased, while emissions are reduced. Further, the farmers may be enlightened on how to apply information and communication technologies to full earnings and promote sustainable utilization of resources based on different climatic conditions when internet grows in the agricultural sector. Therefore, the farming as a service Industry over the forecast period will have its growth driven by the higher usage of the Internet of Things (IoT) in the agriculture sector within the aforementioned years.
Farming as a Service Market Segment Analysis:
Farming as a Service Market is Segmented based on Service, Delivery Model, and End User.
By Service, farm management solutions segment is expected to dominate the market during the forecast period
- Depending on the type of provided service, farming as a service market includes farm management solutions, production assistance, and access to markets.
- Among all these segments the farm management solutions segment had the largest market share of about 76%. 83% in 2023. Some of the key services offered in farm management are as follows: Government, farmer, corporates, and other final advisory firms are given insights.
- Farm management services also involve precision farming services which have been rapidly expanding in recentyears due to the increasing adoption of precision farming to meet the increasing global market demand for better quality food products. Hyperspectral imaging technology, sensors for collecting weather information and soil samples, auto-guidance equipment, precision irrigation systems, etc. , which can enhance agricultural outcomes.
- In addition to increase demand for precision farming and accelerating the growth of the market, there is deterioration of the water problem, as well as the need to save the Earth’s resources. The particular sub-segmentation of production assistance is equipment rental, labour, utility service, and agriculture marketing. Equipment rental for example, includes renting of farming machinery such as tractors, combines, etc.
By End User, Farmers segment held the largest share in 2024
- Segmented on the basis of end-users they include farmers, government bodies, corporations, financial institutions and advisory bodies. Farmers continued to dominate the farming as a service industry due to the segment’s revenue share of over 30% among all end-users. 41% in 2023. Furthermore, the farmer end-user segment is expected to grow at a considerably high CAGR of 15% over the projected duration. There is expectation that by the end of the forecast period, this figure will drop to only 4%. Farming as a service is used mainly by farmers who require the services to boost their farming activities.
- All service types are used by farmers, including services related to farm management, production, or access to market. Farmers apply farm management solutions in order to make sound decision instead of assuming things blindly. Others include production assistance services, these are the services in relation to renting out equipment, hiring labor, providing utility services or even helping farmers to market their produce.
Farming as a Service Market Regional Insights:
North America is Expected to Dominate the Market Over the Forecast period
- North America held the largest share of the market, generating 45 % of the total sales. 41% in 2023. North America is one of the leading agricultural regions globally and encompasses some of the largest average farmlands globally. Currently there is about 897,400,000 acres of land under cultivation in North America, while the U. S. farmer works on an averagely sized farm of about 445 acres.
- With relatively large average farm size and a vast amount of cultivated land, North America emerged as the largest region in the farming as a service market. This market share has been attributed to the fact that the use of automation and control systems are common in most countries in the region due to the adoption of more progressive smart farming approaches that has seen an uptake of agriculture farming-as-a-service.
Active Key Players in the Farming as a Service Market
- Mahindra and Mahindra
- John Deere
- ITC
- Trimble
- EM3
- Apollo Agriculture
- Accenture
- Taranis
- Precision Hawk
- IBM
- BigHaat
- Ninja Kart
- Other Active Players
Key Industry Developments in the Farming as a Service Market:
- In September 2024, the Union Cabinet, led by Prime Minister Shri Narendra Modi, approved the Digital Agriculture Mission with an allocation of Rs. 2817 crore. The initiative aims to transform the agricultural sector by promoting digital technologies and innovations to improve productivity, sustainability, and farmers' income. The mission will focus on enhancing the use of data, AI, and digital tools in agriculture to drive inclusive growth.
- January 2023, Taranis announced the commercial release of AcreForward that aims to help ag retailers bring greater value to the acres of land across the world. The solution was conceived to deliver the most detailed and frequent, at the leaf level, information about growers’ crops in the season and to capitalize on each acre’s Smart agriculture possibilities enhanced by new findings related to carbon capture and soil health.
Global Farming as a Service Market Scope:
|
Farming as a Service Market |
|||
|
Base Year: |
2024 |
Forecast Period: |
2025-2032 |
|
Historical Data: |
2018 to 2023 |
Market Size in 2024: |
USD 4.72 Bn. |
|
Forecast Period 2024-32 CAGR: |
15.2% |
Market Size in 2032: |
USD 14.7 Bn. |
|
Segments Covered: |
By Service |
|
|
|
By Delivery Model |
|
||
|
By End-User |
|
||
|
By Region |
|
||
|
Key Market Drivers: |
|
||
|
Key Market Restraints: |
|
||
|
Key Opportunities: |
|
||
|
Companies Covered in the report: |
|
||
Chapter 1: Introduction
1.1 Scope and Coverage
Chapter 2:Executive Summary
Chapter 3: Market Landscape
3.1 Market Dynamics
3.1.1 Drivers
3.1.2 Restraints
3.1.3 Opportunities
3.1.4 Challenges
3.2 Market Trend Analysis
3.3 PESTLE Analysis
3.4 Porter's Five Forces Analysis
3.5 Industry Value Chain Analysis
3.6 Ecosystem
3.7 Regulatory Landscape
3.8 Price Trend Analysis
3.9 Patent Analysis
3.10 Technology Evolution
3.11 Investment Pockets
3.12 Import-Export Analysis
Chapter 4: Farming as a Service Market by Service (2018-2032)
4.1 Farming as a Service Market Snapshot and Growth Engine
4.2 Market Overview
4.3 Farm Management Solutions
4.3.1 Introduction and Market Overview
4.3.2 Historic and Forecasted Market Size in Value USD and Volume Units
4.3.3 Key Market Trends, Growth Factors, and Opportunities
4.3.4 Geographic Segmentation Analysis
4.4 Production Assistance
4.5 Access to Markets
Chapter 5: Farming as a Service Market by Delivery Model (2018-2032)
5.1 Farming as a Service Market Snapshot and Growth Engine
5.2 Market Overview
5.3 Subscription
5.3.1 Introduction and Market Overview
5.3.2 Historic and Forecasted Market Size in Value USD and Volume Units
5.3.3 Key Market Trends, Growth Factors, and Opportunities
5.3.4 Geographic Segmentation Analysis
5.4 Pay-per-Use
Chapter 6: Farming as a Service Market by End-User (2018-2032)
6.1 Farming as a Service Market Snapshot and Growth Engine
6.2 Market Overview
6.3 Farmers
6.3.1 Introduction and Market Overview
6.3.2 Historic and Forecasted Market Size in Value USD and Volume Units
6.3.3 Key Market Trends, Growth Factors, and Opportunities
6.3.4 Geographic Segmentation Analysis
6.4 Government
6.5 Corporate
6.6 Financial Institutions
6.7 Advisory Bodies
Chapter 7: Company Profiles and Competitive Analysis
7.1 Competitive Landscape
7.1.1 Competitive Benchmarking
7.1.2 Farming as a Service Market Share by Manufacturer (2024)
7.1.3 Industry BCG Matrix
7.1.4 Heat Map Analysis
7.1.5 Mergers and Acquisitions
7.2 ATOS (FRANCE)
7.2.1 Company Overview
7.2.2 Key Executives
7.2.3 Company Snapshot
7.2.4 Role of the Company in the Market
7.2.5 Sustainability and Social Responsibility
7.2.6 Operating Business Segments
7.2.7 Product Portfolio
7.2.8 Business Performance
7.2.9 Key Strategic Moves and Recent Developments
7.2.10 SWOT Analysis
7.3 COGNIZANT (UNITED STATES)
7.4 COHESITY INC (UNITED STATES)
7.5 COMMVAULT (UNITED STATES)
7.6 EATON (IRELAND)
7.7 H4 TECHNOLOGY (UNITED STATES)
7.8 HAPPIEST MINDS (INDIA)
7.9 INFOSYS (INDIA)
7.10 M247 U.K. LTD. (UNITED KINGDOM)
7.11 METALLIC (UNITED STATES)
7.12 NLYTE SOFTWARE (UNITED STATES)
7.13 RACKSPACE (UNITED STATES)
7.14 SCHNEIDER ELECTRIC (FRANCE)
7.15 WIPRO (INDIA)
7.16
Chapter 8: Global Farming as a Service Market By Region
8.1 Overview
8.2. North America Farming as a Service Market
8.2.1 Key Market Trends, Growth Factors and Opportunities
8.2.2 Top Key Companies
8.2.3 Historic and Forecasted Market Size by Segments
8.2.4 Historic and Forecasted Market Size by Service
8.2.4.1 Farm Management Solutions
8.2.4.2 Production Assistance
8.2.4.3 Access to Markets
8.2.5 Historic and Forecasted Market Size by Delivery Model
8.2.5.1 Subscription
8.2.5.2 Pay-per-Use
8.2.6 Historic and Forecasted Market Size by End-User
8.2.6.1 Farmers
8.2.6.2 Government
8.2.6.3 Corporate
8.2.6.4 Financial Institutions
8.2.6.5 Advisory Bodies
8.2.7 Historic and Forecast Market Size by Country
8.2.7.1 US
8.2.7.2 Canada
8.2.7.3 Mexico
8.3. Eastern Europe Farming as a Service Market
8.3.1 Key Market Trends, Growth Factors and Opportunities
8.3.2 Top Key Companies
8.3.3 Historic and Forecasted Market Size by Segments
8.3.4 Historic and Forecasted Market Size by Service
8.3.4.1 Farm Management Solutions
8.3.4.2 Production Assistance
8.3.4.3 Access to Markets
8.3.5 Historic and Forecasted Market Size by Delivery Model
8.3.5.1 Subscription
8.3.5.2 Pay-per-Use
8.3.6 Historic and Forecasted Market Size by End-User
8.3.6.1 Farmers
8.3.6.2 Government
8.3.6.3 Corporate
8.3.6.4 Financial Institutions
8.3.6.5 Advisory Bodies
8.3.7 Historic and Forecast Market Size by Country
8.3.7.1 Russia
8.3.7.2 Bulgaria
8.3.7.3 The Czech Republic
8.3.7.4 Hungary
8.3.7.5 Poland
8.3.7.6 Romania
8.3.7.7 Rest of Eastern Europe
8.4. Western Europe Farming as a Service Market
8.4.1 Key Market Trends, Growth Factors and Opportunities
8.4.2 Top Key Companies
8.4.3 Historic and Forecasted Market Size by Segments
8.4.4 Historic and Forecasted Market Size by Service
8.4.4.1 Farm Management Solutions
8.4.4.2 Production Assistance
8.4.4.3 Access to Markets
8.4.5 Historic and Forecasted Market Size by Delivery Model
8.4.5.1 Subscription
8.4.5.2 Pay-per-Use
8.4.6 Historic and Forecasted Market Size by End-User
8.4.6.1 Farmers
8.4.6.2 Government
8.4.6.3 Corporate
8.4.6.4 Financial Institutions
8.4.6.5 Advisory Bodies
8.4.7 Historic and Forecast Market Size by Country
8.4.7.1 Germany
8.4.7.2 UK
8.4.7.3 France
8.4.7.4 The Netherlands
8.4.7.5 Italy
8.4.7.6 Spain
8.4.7.7 Rest of Western Europe
8.5. Asia Pacific Farming as a Service Market
8.5.1 Key Market Trends, Growth Factors and Opportunities
8.5.2 Top Key Companies
8.5.3 Historic and Forecasted Market Size by Segments
8.5.4 Historic and Forecasted Market Size by Service
8.5.4.1 Farm Management Solutions
8.5.4.2 Production Assistance
8.5.4.3 Access to Markets
8.5.5 Historic and Forecasted Market Size by Delivery Model
8.5.5.1 Subscription
8.5.5.2 Pay-per-Use
8.5.6 Historic and Forecasted Market Size by End-User
8.5.6.1 Farmers
8.5.6.2 Government
8.5.6.3 Corporate
8.5.6.4 Financial Institutions
8.5.6.5 Advisory Bodies
8.5.7 Historic and Forecast Market Size by Country
8.5.7.1 China
8.5.7.2 India
8.5.7.3 Japan
8.5.7.4 South Korea
8.5.7.5 Malaysia
8.5.7.6 Thailand
8.5.7.7 Vietnam
8.5.7.8 The Philippines
8.5.7.9 Australia
8.5.7.10 New Zealand
8.5.7.11 Rest of APAC
8.6. Middle East & Africa Farming as a Service Market
8.6.1 Key Market Trends, Growth Factors and Opportunities
8.6.2 Top Key Companies
8.6.3 Historic and Forecasted Market Size by Segments
8.6.4 Historic and Forecasted Market Size by Service
8.6.4.1 Farm Management Solutions
8.6.4.2 Production Assistance
8.6.4.3 Access to Markets
8.6.5 Historic and Forecasted Market Size by Delivery Model
8.6.5.1 Subscription
8.6.5.2 Pay-per-Use
8.6.6 Historic and Forecasted Market Size by End-User
8.6.6.1 Farmers
8.6.6.2 Government
8.6.6.3 Corporate
8.6.6.4 Financial Institutions
8.6.6.5 Advisory Bodies
8.6.7 Historic and Forecast Market Size by Country
8.6.7.1 Turkiye
8.6.7.2 Bahrain
8.6.7.3 Kuwait
8.6.7.4 Saudi Arabia
8.6.7.5 Qatar
8.6.7.6 UAE
8.6.7.7 Israel
8.6.7.8 South Africa
8.7. South America Farming as a Service Market
8.7.1 Key Market Trends, Growth Factors and Opportunities
8.7.2 Top Key Companies
8.7.3 Historic and Forecasted Market Size by Segments
8.7.4 Historic and Forecasted Market Size by Service
8.7.4.1 Farm Management Solutions
8.7.4.2 Production Assistance
8.7.4.3 Access to Markets
8.7.5 Historic and Forecasted Market Size by Delivery Model
8.7.5.1 Subscription
8.7.5.2 Pay-per-Use
8.7.6 Historic and Forecasted Market Size by End-User
8.7.6.1 Farmers
8.7.6.2 Government
8.7.6.3 Corporate
8.7.6.4 Financial Institutions
8.7.6.5 Advisory Bodies
8.7.7 Historic and Forecast Market Size by Country
8.7.7.1 Brazil
8.7.7.2 Argentina
8.7.7.3 Rest of SA
Chapter 9 Analyst Viewpoint and Conclusion
9.1 Recommendations and Concluding Analysis
9.2 Potential Market Strategies
Chapter 10 Research Methodology
10.1 Research Process
10.2 Primary Research
10.3 Secondary Research
Global Farming as a Service Market Scope:
|
Farming as a Service Market |
|||
|
Base Year: |
2024 |
Forecast Period: |
2025-2032 |
|
Historical Data: |
2018 to 2023 |
Market Size in 2024: |
USD 4.72 Bn. |
|
Forecast Period 2024-32 CAGR: |
15.2% |
Market Size in 2032: |
USD 14.7 Bn. |
|
Segments Covered: |
By Service |
|
|
|
By Delivery Model |
|
||
|
By End-User |
|
||
|
By Region |
|
||
|
Key Market Drivers: |
|
||
|
Key Market Restraints: |
|
||
|
Key Opportunities: |
|
||
|
Companies Covered in the report: |
|
||


