


Extended Reality Market Synopsis
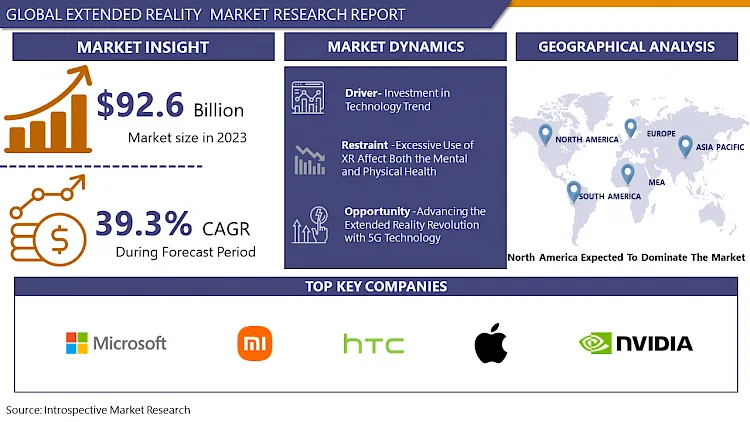
Extended Reality Market Size Was Valued at USD 128.99 Billion in 2024, and is Projected to Reach USD 1828.79 Billion by 2032, Growing at a CAGR of 39.3% From 2025-2032.
Extended Reality, or XR, is not only a fancy term but also a revolution simmering below the surface of our daily existence. Think of it like a secret room with three potent tools: Virtual Reality (VR), Augmented Reality (AR), and Mixed Reality (MR). Every tool provides a distinct method to alter our understanding of reality.
Virtual reality functions as an all-encompassing gateway, transporting you to magical worlds via a head-mounted display. Imagine virtually climbing Mount Everest, working with coworkers from around the world in a common virtual environment, or battling holographic foes in a futuristic combat game. The options are limitless, ranging from amusement to instruction and even rehabilitation.
However, AR is more rooted. Having a magic window that projects digital information onto the real world, usually accessed via your smartphone. Picture holding your phone in front of a landmark and seeing detailed historical information projected onto it or getting real-time repair instructions displayed on a malfunctioning appliance. AR has the potential to transform education, maintenance procedures, and improve daily commutes using augmented reality arrows displayed on the street for navigation.
MR serves as a connection between both, effortlessly merging the virtual and real worlds. Picture an architect altering a digital blueprint on an actual table, or a surgeon carrying out a complicated surgery with holographic anatomical overlays directing their every action. MR has great possibilities for design, education, and particularly the medical sector.
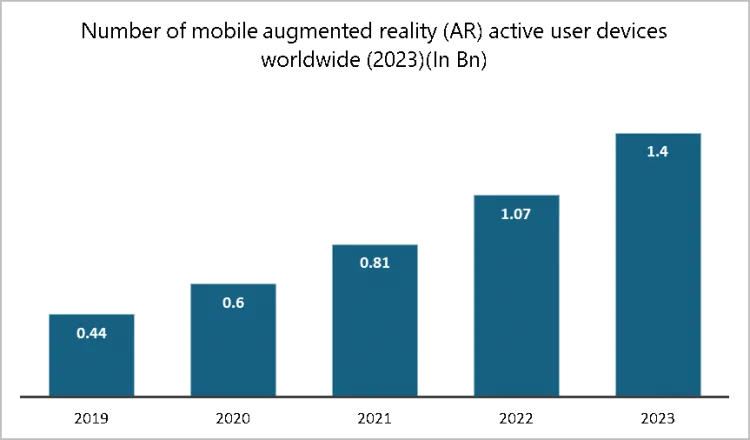
VR is currently seen as the most mature technology, with well-established gaming uses, while AR is expected to experience significant growth soon. Developments such as 5G are creating a smoother and more immersive AR encounter. Despite being in its infancy, MR is akin to an empty canvas full of possibilities. The influence of XR goes beyond just providing enjoyment. Picture a scenario in which doctors utilize augmented reality to examine live data.

Extended Reality Market Trend Analysis
Investment in Technology Trend
- In recent years, there has been a significant amount of fascination in extended reality (XR). Businesses worldwide are currently investing in virtual, augmented, and mixed reality (VR/AR/MR) technologies. Businesses around the world are creating a wide range of applications for XR, such as immersive training, R&D, virtual collaboration, entertainment, and remote assistance, leading to success in various areas.
- The different sectors implement immersive technologies to help customers try products before making a purchase. This allows the user to observe how a garment fits or try out cosmetics. it allows for consideration of both furniture and paintings, ultimately decreasing potential profits while improving the overall consumer experience. Investors have shown interest in these characteristics across different industries like entertainment, sports, education, tourism, and e-commerce. Major manufacturers like NVIDIA are collaborating with Siemens to develop digitally twinned facilities, allowing remote workers to monitor the entire facility in real-time.
- Using technological progress, extended reality (XR) establishes a distinct environment from reality, allowing for immersive 3D computer-generated experiences. The technologies of extended reality today are built upon the advancements made in the 19th century. Additional instances of virtual and augmented reality technologies began emerging in the mid-20th century. Morton Heilig invented the original virtual reality device. This device offered customers an immersive viewing experience by blending 3D colour television with scents, sounds, and a vibrating seat. Four years after that, the inventor also obtained a patent for the initial head-mounted display. Various sectors, such as entertainment, education, healthcare, manufacturing, and retail, are currently using XR technology in innovative ways. Extended reality shows great potential in enhancing capabilities.
Restraints
Excessive Use of XR Affect Both the Mental and Physical Health
- XR devices, which include both VR and AR, provide amazing experiences by immersing us in stunning landscapes or exciting virtual environments. Nevertheless, delving too deeply into these online worlds for long periods of time can result in certain health issues, both physical and mental. Having knowledge of these possible problems helps us to responsibly utilize XR technology, ensuring maximum enjoyment with minimal potential dangers.
- Eye strain and vision Extended use of XR gadgets causes the same eye strain as staring at a computer screen for long periods. Because VR headsets fully shield the real world, our eyes are always adjusting to focus on a virtual environment set at a specific distance. This may result in dry eyes, blurred vision, headaches, and challenges switching focus from close to far objects. To address these problems, it is essential to take breaks every 20-30 minutes. Implement the "20-20-20 rule" by taking a break from the screen every 20 minutes and gazing at a faraway object for 20 seconds. you can prevent eye strain by setting the brightness and contrast of your XR device to a comfortable level and making sure there is adequate ventilation.
- Musculoskeletal Problems Virtual reality activities frequently include simulated motion like running or jumping, yet our physical bodies stay stationary. The discrepancy in virtual and actual movement can result in muscle tightness and discomfort, especially in the neck, back, and shoulders. It is crucial to have proper posture when using XR devices. Make sure to take regular breaks to stretch and keep your body moving. If possible, think about utilizing full-body tracking systems in virtual reality, as they enable a more natural range of movement in the virtual world environments can induce feelings of imbalance and vertigo, particularly when there is a discrepancy between visual information and signals from the inner ear. These symptoms may result in feelings of di92.6iness and light-headedness.
Opportunity
Advancing the Extended Reality Revolution with 5G Technology
- The rapid speed of 5G progress is fuelling the entire Extended Reality (XR) realm, which includes Virtual Reality (VR) and Augmented Reality (AR). Think about the contrast between a dial-up modem and high-speed fibre optic internet - that's the level of advancement 5G brings to XR. Here's a more in-depth look at how 5G is changing what is achievable.
- Latency, the obstacle to immersion, defeated: One of the main challenges for achieving true immersion in XR has been latency. There is a clear delay between your actions and the response in the virtual or augmented world when using 4G. 5G greatly reduces that delay to almost instantaneous. Imagine a doctor conducting a complicated surgery through virtual reality. With the use of 5G technology, their actions are immediately mirrored in the virtual patient, enabling accurate and life-saving interventions. 5G guarantees a smooth and immersive experience without any shaky movements or irritating lags.
- Bandwidth Bonanza Enjoying XR worlds with no constraints XR experiences have a high appetite for data. Massive data transfer is necessary for high-resolution visuals, intricate 3D models, and complex simulations. The increased bandwidth of 5G over 4G can be likened to expanding a road. Picture yourself discovering a virtual museum where every detail is shown in amazing clarity, or participating in a live virtual reality concert with sharp audio and visuals that make you feel as if you are on stage. 5G guarantees seamless streaming with no interruptions or delays, allowing you to completely immerse yourself in the XR environment.
- Network Capacity 5G networks can seamlessly connect a massive number of devices, far surpassing what 4G can handle. This paves the way for XR applications on a massive scale that were previously inconceivable. Imagine being part of an online conference with numerous attendees engaging in a communal virtual environment, where every participant's digital representation moves with fluidity and lifelike motion. Picture a lively urban environment
Challenges
The Comfort, Content, and Cost Barriers in Virtual Reality
- The cost continues to be a significant obstacle. Expensive VR headsets with strong processors and high-resolution screens continue to be a barrier for many potential users. Picture a scenario where experiencing stunning virtual environments comes at a significant cost. Moreover, existing XR hardware is plagued by large and ergonomically unsatisfactory configurations. These headsets frequently look like backpacks instead of fashionable accessories, resulting in social isolation as users visually disconnect from reality. The duration of battery life limits how long users can use devices, interrupting their immersion just when they are most engaged. Picture being abruptly pulled out of an exciting virtual reality experience due to your headset losing power.
- Creating content poses a different kind of difficulty. Despite the amazing potential of XR, there is still a lack of high-quality content tailored for these experiences. There is a lack of interesting content to maintain user interest in the digital realm. Picture having a high-tech VR device but not having exciting content to enjoy. The absence of content suppresses user interaction and constrains the overall attractiveness of XR technology. Privacy and security issues are also significant.
- XR devices gather a large quantity of user data, such as motion patterns, eye tracking data, and voice instructions. This brings up worries about the collection, storage, and utilization of this data. Users are concerned about the possible breach of privacy and the inappropriate use of their personal data. Additionally, security weaknesses present a danger, since these entry points to digital spaces may be abused by malicious individuals. Picture your virtual persona being compromised, or your actions monitored in a virtual reality environment. Establishing strong security measures and ethical data management practices are essential for gaining user trust and promoting a secure XR environment. Transitioning past the difficult technical obstacles, user experience introduces its own series of challenges. Motion sickness can be a significant obstacle, particularly for individuals who are being exposed to quick movements or disorientation.
Extended Reality Market Segment Analysis:
Extended Reality market is segmented on the basis of Devices Type, Offering, Technology, Application.
By Application, Automotive Segment Is Expected to Dominate the Market During the Forecast Period
- There is a strong potential for the automotive sector to significantly contribute to the growth of the extended reality (XR) applications market, and with good justification. XR technologies such as VR and AR provide an ideal answer to key industry challenges and enable new opportunities to be explored. Here is a more in-depth analysis of why the automotive industry could dominate the XR applications market.
- Car design depends on physical prototypes, which is a process that is both time-consuming and costly. VR revolutionizes the industry by providing a virtual design studio. Designers can fully engage with 3D models, carefully assess ergonomics, aesthetics, and functionality instantly. This enables the early detection and rectification of design imperfections, resulting in substantial cost reductions. Moreover, AR superimposes digital elements onto real car prototypes, enabling teamwork in design evaluations and enhancing the production procedures. Picture a group of designers virtually analysing a car model in AR, discussing enhancements, and making real-time changes - a stark contrast to the constraints of static physical prototypes.
- Old-fashioned car showrooms are no longer relevant. VR enables customers to virtually experience a wide range of car models, examine features closely, personalize interiors, and enjoy virtual test drives on different terrains. This interactive encounter surpasses the constraints of traditional showrooms, empowering customers to make confident, well-informed choices. AR goes even further by allowing users to see cars parked in their own driveways or garages, guaranteeing a flawless blend of style and practicality. Picture a consumer using virtual reality to design their ideal vehicle, then utilizing augmented reality to visualize it virtually positioned in their own driveway – a smooth and captivating method to connect the divide between fantasy and actuality. Modern vehicles are complex devices with a variety of characteristics and capabilities. Extended reality
By Offering, Software Segment Held the Largest Share In 2024
- The software sector's control of the extended reality (XR) market is not just by chance. While hardware is designed for tasks, software is essential for every XR interaction. Here's a more in-depth look at why software is dominant. Visualize a virtual reality journey without the necessary software to create the environment, execute your commands, or provide visuals. it wouldn't be very immersive. Software is responsible for shaping the complete experience. It forms the digital realm, dictates user engagement with elements and personas, computes information instantly, and finally provides the engaging encounter that characterizes XR. VR headsets and controllers are merely instruments for engaging with this intricately designed virtual reality environment.
- Software demonstrates fantastic versatility. In contrast to a VR headset made exclusively for virtual reality, XR software can be customized for different applications and hardware platforms. The identical central software engine could be used for an exciting VR game at one moment and then changed into an educational AR tool for students or a training simulation for industrial workers. This flexibility enables software developers to meet a broader range of user needs and goals, broadening the scope of XR technology beyond the entertainment industry.
- Software is essential for creating engaging content, driving user interaction and retention. The software animates 3D models, establishes interactive elements in the virtual world, and controls the actions of AI characters encountered by users. Picture a visually impressive VR setting without compelling plots, interactive features, or lifelike character connections the result would seem empty. The way users view and engage with the XR world is determined by the quality and variety of software tools, which ultimately impacts the success of XR applications. Hardware and software coexist, and it is crucial to keep this in mind.
Extended Reality Market Regional Insights:
North America is Expected to Dominate the Market Over the Forecast Period
- The leading position of North America in XR innovation is a result of various factors that contribute to a dynamic and encouraging environment. North America has quickly implemented 5G networks, providing fast data transfer with low delay. This is essential in XR experiences because it removes the annoying lag or buffering that interrupts immersion. Visualize a virtual reality experience where your movements are lagging or the surroundings pause not very exciting, 5G guarantees smooth transmission of sharp graphics and immediate reaction to user input. This enables options such as cloud-based VR gaming, where complex processing is done off-site, eliminating the need for a large and costly headset. 5G's features enable specific XR experiences to be sent directly to smartphones, leading to a significant increase in the potential number of users.
- North America has a significant and technologically advanced mobile phone user population. This creates a rich environment for XR development centred on mobile interactions. A lot of smartphones currently have strong processors and high-quality cameras, which makes them perfect for Augmented Reality (AR) apps. This encourages the development of various innovative AR applications in areas such as gaming, education, and transforming shopping experiences. Picture yourself using your phone's camera to virtually try on clothes or visualize furniture placement in your living room before making a purchase. These AR experiences on mobile devices not just provide instant user involvement, but also serve as an entry point to even more immersive XR experiences in the future. The robust mobile app development community in North America serves as an additional benefit. Developers who are already skilled in creating mobile apps can easily use their knowledge to create immersive XR experiences tailored for mobile devices.
Extended Reality Market Active Players
- Microsoft (US)
- Google (US)
- Apple (US)
|
Global Extended Reality Market |
|||
|
Base Year: |
2024 |
Forecast Period: |
2025-2032 |
|
Historical Data: |
2018 to 2023 |
Market Size in 2024: |
USD 128.99 Bn. |
|
Forecast Period 2024-32 CAGR: |
39.3% |
Market Size in 2032: |
USD 1828.79 Bn. |
|
Segments Covered: |
By Devices Type |
|
|
|
By Offering |
|
||
|
By Technology |
|
||
|
By Application |
|
||
|
By Region |
|
||
|
Key Market Drivers: |
|
||
|
Key Market Restraints: |
|
||
|
Key Opportunities: |
|
||
|
Companies Covered in the report: |
Microsoft (US), HTC (Taiwan), Google (US), Apple (US), PTC (US), Meta Platforms (US), Qualcomm Technologies (US) Other Active Players |
||
Chapter 1: Introduction
1.1 Scope and Coverage
Chapter 2:Executive Summary
Chapter 3: Market Landscape
3.1 Market Dynamics
3.1.1 Drivers
3.1.2 Restraints
3.1.3 Opportunities
3.1.4 Challenges
3.2 Market Trend Analysis
3.3 PESTLE Analysis
3.4 Porter's Five Forces Analysis
3.5 Industry Value Chain Analysis
3.6 Ecosystem
3.7 Regulatory Landscape
3.8 Price Trend Analysis
3.9 Patent Analysis
3.10 Technology Evolution
3.11 Investment Pockets
3.12 Import-Export Analysis
Chapter 4: Extended Reality Market by
Devices Type (2018-2032)
4.1 Extended Reality Market Snapshot and Growth Engine
4.2 Market Overview
4.3 AR Devices
4.3.1 Introduction and Market Overview
4.3.2 Historic and Forecasted Market Size in Value USD and Volume Units
4.3.3 Key Market Trends, Growth Factors, and Opportunities
4.3.4 Geographic Segmentation Analysis
4.4 VR Devices
4.5 MR Devices
Chapter 5: Extended Reality Market by Offering (2018-2032)
5.1 Extended Reality Market Snapshot and Growth Engine
5.2 Market Overview
5.3 Hardware
5.3.1 Introduction and Market Overview
5.3.2 Historic and Forecasted Market Size in Value USD and Volume Units
5.3.3 Key Market Trends, Growth Factors, and Opportunities
5.3.4 Geographic Segmentation Analysis
5.4 Soft Ware
Chapter 6: Extended Reality Market by Technology (2018-2032)
6.1 Extended Reality Market Snapshot and Growth Engine
6.2 Market Overview
6.3 AR
6.3.1 Introduction and Market Overview
6.3.2 Historic and Forecasted Market Size in Value USD and Volume Units
6.3.3 Key Market Trends, Growth Factors, and Opportunities
6.3.4 Geographic Segmentation Analysis
6.4 VR
6.5 MR
Chapter 7: Extended Reality Market by Application (2018-2032)
7.1 Extended Reality Market Snapshot and Growth Engine
7.2 Market Overview
7.3 Consumer
7.3.1 Introduction and Market Overview
7.3.2 Historic and Forecasted Market Size in Value USD and Volume Units
7.3.3 Key Market Trends, Growth Factors, and Opportunities
7.3.4 Geographic Segmentation Analysis
7.4 Commercial
7.5 Enterprises
7.6 Automotive
Chapter 8: Company Profiles and Competitive Analysis
8.1 Competitive Landscape
8.1.1 Competitive Benchmarking
8.1.2 Extended Reality Market Share by Manufacturer (2024)
8.1.3 Industry BCG Matrix
8.1.4 Heat Map Analysis
8.1.5 Mergers and Acquisitions
8.2 BRAIN CORPORATION (UNITED STATES)
8.2.1 Company Overview
8.2.2 Key Executives
8.2.3 Company Snapshot
8.2.4 Role of the Company in the Market
8.2.5 Sustainability and Social Responsibility
8.2.6 Operating Business Segments
8.2.7 Product Portfolio
8.2.8 Business Performance
8.2.9 Key Strategic Moves and Recent Developments
8.2.10 SWOT Analysis
8.3 CEA-LETI (FRANCE)
8.4 GENERAL VISION INC. (UNITED STATES)
8.5 HEWLETT PACKARD COMPANY (UNITED STATES)
8.6 HRL LABORATORIES
8.7 LLC (UNITED STATES)
8.8 INTEL CORPORATION (UNITED STATES)
8.9 INTERNATIONAL BUSINESS MACHINES CORPORATION (UNITED STATES)
8.10 KNOWM INC (UNITED STATES)
8.11 QUALCOMM TECHNOLOGIES INC. (UNITED STATES)
8.12 SAMSUNG ELECTRONICS COLTD (SOUTH KOREA)
8.13 VICARIOUS FPC INC. (UNITED STATES) OTHERS
8.14
Chapter 9: Global Extended Reality Market By Region
9.1 Overview
9.2. North America Extended Reality Market
9.2.1 Key Market Trends, Growth Factors and Opportunities
9.2.2 Top Key Companies
9.2.3 Historic and Forecasted Market Size by Segments
9.2.4 Historic and Forecasted Market Size by
Devices Type
9.2.4.1 AR Devices
9.2.4.2 VR Devices
9.2.4.3 MR Devices
9.2.5 Historic and Forecasted Market Size by Offering
9.2.5.1 Hardware
9.2.5.2 Soft Ware
9.2.6 Historic and Forecasted Market Size by Technology
9.2.6.1 AR
9.2.6.2 VR
9.2.6.3 MR
9.2.7 Historic and Forecasted Market Size by Application
9.2.7.1 Consumer
9.2.7.2 Commercial
9.2.7.3 Enterprises
9.2.7.4 Automotive
9.2.8 Historic and Forecast Market Size by Country
9.2.8.1 US
9.2.8.2 Canada
9.2.8.3 Mexico
9.3. Eastern Europe Extended Reality Market
9.3.1 Key Market Trends, Growth Factors and Opportunities
9.3.2 Top Key Companies
9.3.3 Historic and Forecasted Market Size by Segments
9.3.4 Historic and Forecasted Market Size by
Devices Type
9.3.4.1 AR Devices
9.3.4.2 VR Devices
9.3.4.3 MR Devices
9.3.5 Historic and Forecasted Market Size by Offering
9.3.5.1 Hardware
9.3.5.2 Soft Ware
9.3.6 Historic and Forecasted Market Size by Technology
9.3.6.1 AR
9.3.6.2 VR
9.3.6.3 MR
9.3.7 Historic and Forecasted Market Size by Application
9.3.7.1 Consumer
9.3.7.2 Commercial
9.3.7.3 Enterprises
9.3.7.4 Automotive
9.3.8 Historic and Forecast Market Size by Country
9.3.8.1 Russia
9.3.8.2 Bulgaria
9.3.8.3 The Czech Republic
9.3.8.4 Hungary
9.3.8.5 Poland
9.3.8.6 Romania
9.3.8.7 Rest of Eastern Europe
9.4. Western Europe Extended Reality Market
9.4.1 Key Market Trends, Growth Factors and Opportunities
9.4.2 Top Key Companies
9.4.3 Historic and Forecasted Market Size by Segments
9.4.4 Historic and Forecasted Market Size by
Devices Type
9.4.4.1 AR Devices
9.4.4.2 VR Devices
9.4.4.3 MR Devices
9.4.5 Historic and Forecasted Market Size by Offering
9.4.5.1 Hardware
9.4.5.2 Soft Ware
9.4.6 Historic and Forecasted Market Size by Technology
9.4.6.1 AR
9.4.6.2 VR
9.4.6.3 MR
9.4.7 Historic and Forecasted Market Size by Application
9.4.7.1 Consumer
9.4.7.2 Commercial
9.4.7.3 Enterprises
9.4.7.4 Automotive
9.4.8 Historic and Forecast Market Size by Country
9.4.8.1 Germany
9.4.8.2 UK
9.4.8.3 France
9.4.8.4 The Netherlands
9.4.8.5 Italy
9.4.8.6 Spain
9.4.8.7 Rest of Western Europe
9.5. Asia Pacific Extended Reality Market
9.5.1 Key Market Trends, Growth Factors and Opportunities
9.5.2 Top Key Companies
9.5.3 Historic and Forecasted Market Size by Segments
9.5.4 Historic and Forecasted Market Size by
Devices Type
9.5.4.1 AR Devices
9.5.4.2 VR Devices
9.5.4.3 MR Devices
9.5.5 Historic and Forecasted Market Size by Offering
9.5.5.1 Hardware
9.5.5.2 Soft Ware
9.5.6 Historic and Forecasted Market Size by Technology
9.5.6.1 AR
9.5.6.2 VR
9.5.6.3 MR
9.5.7 Historic and Forecasted Market Size by Application
9.5.7.1 Consumer
9.5.7.2 Commercial
9.5.7.3 Enterprises
9.5.7.4 Automotive
9.5.8 Historic and Forecast Market Size by Country
9.5.8.1 China
9.5.8.2 India
9.5.8.3 Japan
9.5.8.4 South Korea
9.5.8.5 Malaysia
9.5.8.6 Thailand
9.5.8.7 Vietnam
9.5.8.8 The Philippines
9.5.8.9 Australia
9.5.8.10 New Zealand
9.5.8.11 Rest of APAC
9.6. Middle East & Africa Extended Reality Market
9.6.1 Key Market Trends, Growth Factors and Opportunities
9.6.2 Top Key Companies
9.6.3 Historic and Forecasted Market Size by Segments
9.6.4 Historic and Forecasted Market Size by
Devices Type
9.6.4.1 AR Devices
9.6.4.2 VR Devices
9.6.4.3 MR Devices
9.6.5 Historic and Forecasted Market Size by Offering
9.6.5.1 Hardware
9.6.5.2 Soft Ware
9.6.6 Historic and Forecasted Market Size by Technology
9.6.6.1 AR
9.6.6.2 VR
9.6.6.3 MR
9.6.7 Historic and Forecasted Market Size by Application
9.6.7.1 Consumer
9.6.7.2 Commercial
9.6.7.3 Enterprises
9.6.7.4 Automotive
9.6.8 Historic and Forecast Market Size by Country
9.6.8.1 Turkiye
9.6.8.2 Bahrain
9.6.8.3 Kuwait
9.6.8.4 Saudi Arabia
9.6.8.5 Qatar
9.6.8.6 UAE
9.6.8.7 Israel
9.6.8.8 South Africa
9.7. South America Extended Reality Market
9.7.1 Key Market Trends, Growth Factors and Opportunities
9.7.2 Top Key Companies
9.7.3 Historic and Forecasted Market Size by Segments
9.7.4 Historic and Forecasted Market Size by
Devices Type
9.7.4.1 AR Devices
9.7.4.2 VR Devices
9.7.4.3 MR Devices
9.7.5 Historic and Forecasted Market Size by Offering
9.7.5.1 Hardware
9.7.5.2 Soft Ware
9.7.6 Historic and Forecasted Market Size by Technology
9.7.6.1 AR
9.7.6.2 VR
9.7.6.3 MR
9.7.7 Historic and Forecasted Market Size by Application
9.7.7.1 Consumer
9.7.7.2 Commercial
9.7.7.3 Enterprises
9.7.7.4 Automotive
9.7.8 Historic and Forecast Market Size by Country
9.7.8.1 Brazil
9.7.8.2 Argentina
9.7.8.3 Rest of SA
Chapter 10 Analyst Viewpoint and Conclusion
10.1 Recommendations and Concluding Analysis
10.2 Potential Market Strategies
Chapter 11 Research Methodology
11.1 Research Process
11.2 Primary Research
11.3 Secondary Research
|
Global Extended Reality Market |
|||
|
Base Year: |
2024 |
Forecast Period: |
2025-2032 |
|
Historical Data: |
2018 to 2023 |
Market Size in 2024: |
USD 128.99 Bn. |
|
Forecast Period 2024-32 CAGR: |
39.3% |
Market Size in 2032: |
USD 1828.79 Bn. |
|
Segments Covered: |
By Devices Type |
|
|
|
By Offering |
|
||
|
By Technology |
|
||
|
By Application |
|
||
|
By Region |
|
||
|
Key Market Drivers: |
|
||
|
Key Market Restraints: |
|
||
|
Key Opportunities: |
|
||
|
Companies Covered in the report: |
Microsoft (US), HTC (Taiwan), Google (US), Apple (US), PTC (US), Meta Platforms (US), Qualcomm Technologies (US) Other Active Players |
||


