


Energy Bar Market Overview
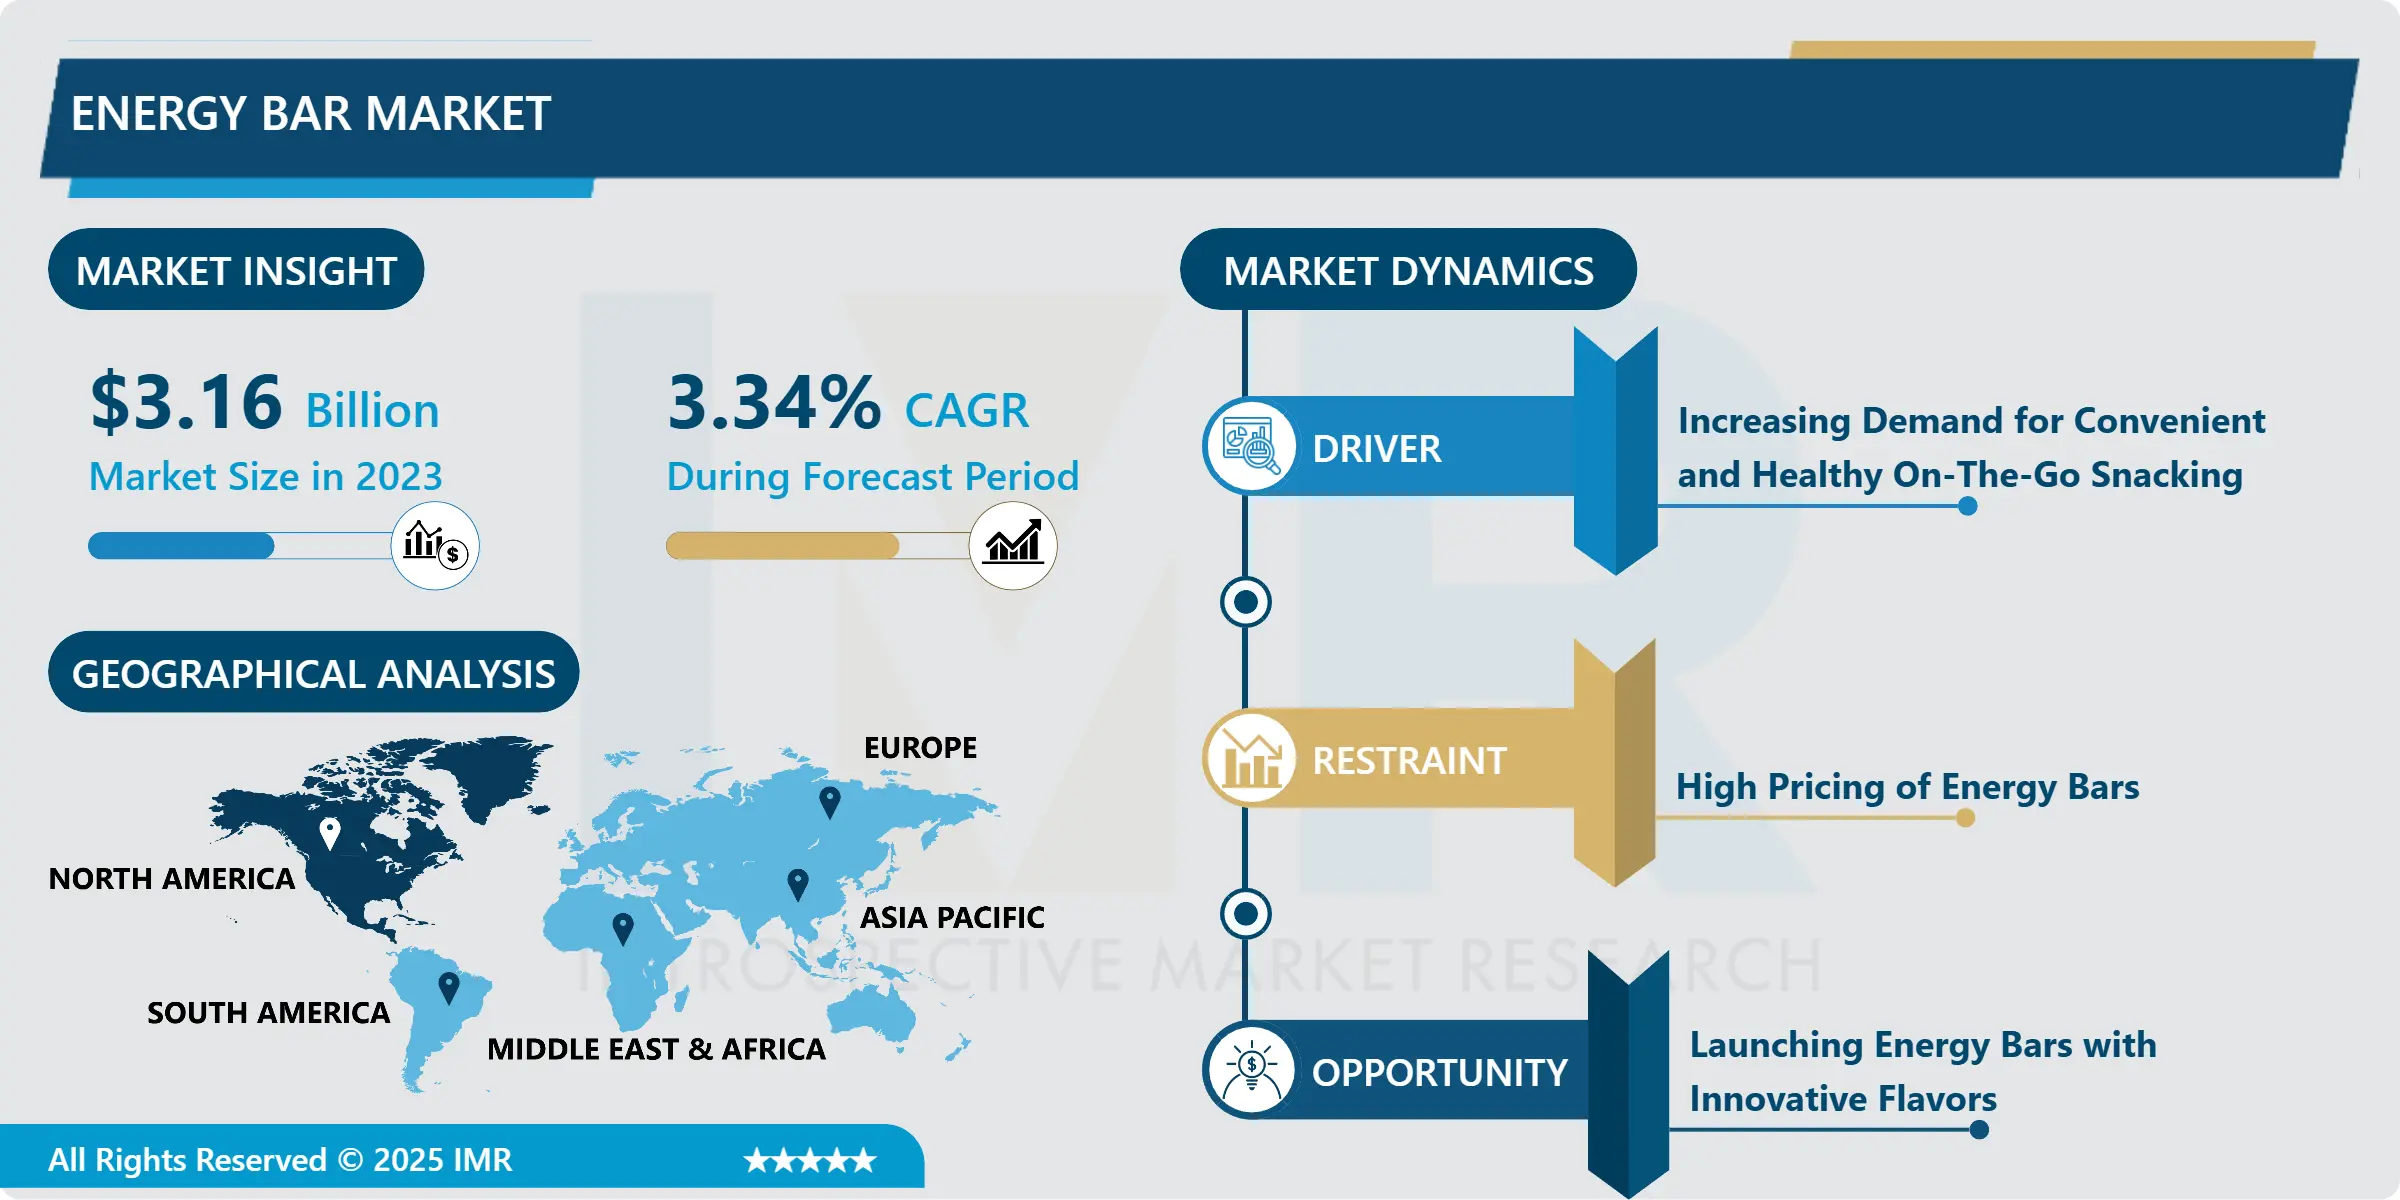
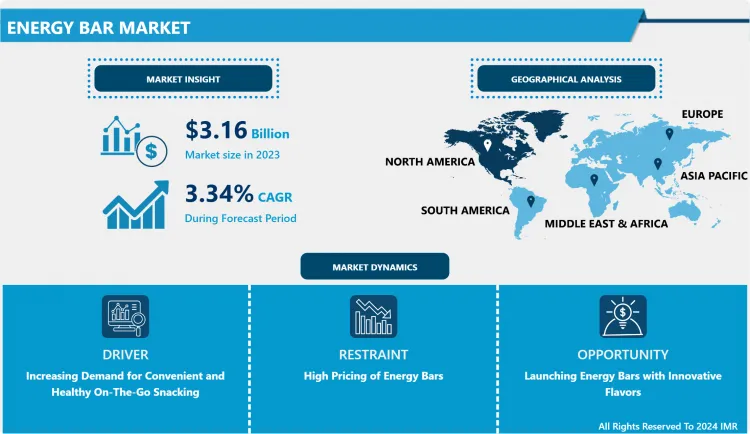
The Global Energy Bar market was valued at USD 3.27 billion in 2024 and is expected to reach USD 4.25 billion by the year 2032, at a CAGR of 3.34% over the analysis period 2025-2032.
Consumer demand for suitable and healthy ready-to-eat snack options has by far been the primary assign for the sales of energy bars worldwide. Additionally, owing to its small packaging and high energy content, it is an ideal solution for adults who need instant results. It also holds proteins and other nutrients, and micronutrients required daily, therefore, packing a balanced diet in a small quantity. Consumers are highly aware of their food content, quantity, and the number of times they eat. This has led them to focus more on their diet content, eat smaller portions, and increase the frequency of their meals. To fulfil these requirements, energy bars are suitable options for them.
Further, the growing demand for energy bars for various consumers' needs has led to various product innovations and increased utilization of healthy ingredients. Labelling these bars with various characteristics, such as gluten-free, vegan, low fat, low calories, no added sugars, and sweeteners, is hastening the market growth. Energy bars were unheard of among people who were not sports enthusiasts, but these days, they can be found at any supermarket or retail store. They are a good option for sports freaks as they are handy and give instant energy upon consumption. These are also considered meal replacements in many instances owing to factors, such as convenience, lack of options, and reducing calorie intake.
Market Dynamics And Factor
Drivers
Increasing Demand For Convenient And Healthy On-The-Go Snacking
- Owing to fast-paced lifestyles and the need for instant energy among adults, there has been a growing demand for healthy and convenient food that can be consumed instantly without any preparation. Energy bars, which are covered into little quantities carrying large amounts of instant energy and all the daily essential nutrients and micronutrients, have been extensively adopted, thus, hastening the market growth. Also, the growing trend of on-the-go snacking is becoming extremely popular among children owing to their need for regular meals while adults prefer them due to active hectic lifestyles. Other factors, such as growing disposable incomes, ease of carrying, and increasing health concerns, are also augmenting the market growth.
An Increasing Number Of Health And Fitness Centres
- Sports nutrition products have highly gained popularity, primarily among athletes and individuals involved in numerous physical activities. The rising significance of continuing healthy and in shape, and increasing participation in sports, health clubs, sports clubs, and gyms are some of the key drivers contributing to the growth of the global energy bars market. Energy bars have also found high levels of popularity in the sports nutrition market as sports activities involve lots of energy breakdown, and energy bars are a convenient and efficient option for the supply of instant energy to athletes. Hence, the demand for these products is gaining traction among athletes. In the past few years, health clubs and fitness centres have witnessed consistent growth, due to increases in health concerns and lifestyle changes. The rise in health consciousness and the need for proper nutritional content in food have also fostered the demand for sports nutrition products.
Restraints
High Pricing Of Energy Bars
- The energy bars are prepared with quality ingredients packed with instant energy-providing food materials. The high cost of the raw material, processing equipment, packaging, and high-profit margins have resulted in the higher retail price of the bars. As per industry sources, the cost of raw material is somewhere around 25% while profit hovers at 40-50% of the retail cost. Additionally, the premium packaging of these products, first in the wrapper and then in a box again, increases the overall price of the product.
Opportunities:
Allergy-Free Energy Bars Launch
- There's a growing demand for a dedicated line of allergy-free, nut-free snacks and energy bars among the allergy prevalent consumers. To cater to such demands, manufacturers have launched energy bars that are free from all the allergy-causing ingredients. For instance, Spark Nutrition LLC, introduced its product line No Nuts! which is nut-free protein energy bars. It is manufactured in a 100% nut-free facility specializing in non-allergic product manufacturing.
Flavour And Texture Appeal More To Consumers
- The taste and texture of the bars are very important for consumers' decisions and buying preferences. As per the result published in Trends impacting nutrition bar market, 74% say good taste is important when choosing a bar. Also, over 60% are concerned about the texture and ingredients used in the bar. Manufacturers are experimenting and launching energy bars with various ingredients to meet the consumer demand for new and tasty products. For this, they use ingredients like soy, amaranth, millets, and other cereals and grains, fruits, chocolates, etc. For instance, General Mills launched its Nature Valley Packed Sustained energy bar that contains nut butter, nuts, seeds, and dried fruit and is creamy, crunchy, and chewy in texture. It is also available in peanut butter & cranberry and almond butter & blueberry options.
Market Segmentation
Segmentation Insights
- Consumer demand for easy and nutritious on-the-go snack choices has been the primary driver of energy bar sales across the world. Moreover, consumers' evolving lifestyles, which include eating fewer meals, also contribute to a rise in snack consumption, which is expected to drive demand for conventional energy bars. Consumers are increasingly going health-conscious when it comes to bite-in-between meals. Thus, there is a growing awareness of various health effects of artificial additives, such as colour, flavour, sweeteners, and preservatives, which, in turn, has accelerated the demand for an organic energy bar.
- Based on Distribution Channel, the supermarkets/hypermarkets segment held the majority market share. supermarkets/hypermarkets provide a super-sized shopping experience with suitable displays and assortments of indulgent snacking products. The proximity factor of these channels, especially in bigger cities and metropolitan areas, gives them an added advantage of influencing the snacking habits of consumers. Convenience stores around the world witnessed an increase in the sales of functional snacking options at the expense of indulgent ones, a trend that is set to boost the market sentiments for functional bars from such distribution networks.
- Based on Product Type, the protein bar segment is accounted for the largest share in the market owing to the switching consumer preferences towards healthy and protein-based products included protein-based beverages. Increasing the consumption especially in youth and athletic, sportspersons has led to the demand for the protein energy bar in the market during the forecast period.
Regional Insights
- By Geography, North America held the largest market share. The growing consumer inclination toward sports and workout activities has raised the demand for nutritional snack bars, as they provide an instant energy boost and satiate hunger after a workout. Thus, increased consumer demand for nutritious products and rising clean label claims on energy bar products have augmented market growth in the North American region.
Players Covered in Energy Bar market are :
- Nature Essential Foods Pvt Ltd
- Lotus Bakeries
- General Mills Inc.
- Clif Bar & Company
- ProBar LLC
- Post Holdings Inc.
- BumbleBar Inc.
- PepsiCo Inc.
- Eat Anytime
- TORQ Limited
- OTE Sports Ltd
- Kind LLC
- Science in Sports PLC
- Kellogg Company and other active players
Key Industry Developments
-
In May 2024, Clif Bar, a brand under Mondelez International, unveiled its "The Most Important Ingredient is You" campaign, celebrating personal passion and perseverance. Featuring Clif Athletes like Frances Tiafoe and Breanna Stewart, the campaign showcased how Clif Bars fueled individuals to achieve their goals in sports and outdoor activities. With digital content, TV ads, and social media outreach, it inspired consumers across the U.S. and Canada on a motivational level.
-
In August 2024, Kellogg's expanded its Nutri-Grain brand with "Fruit & Vegetables Mash-Ups," offering innovative flavors like strawberry and squash, and chocolatey banana bites. This launch blended fruits and vegetables into enjoyable snacks for children, addressing nutrition needs in a fun way. By diversifying into the hybrid snacking segment, Nutri-Grain broadened its appeal, targeting health-conscious parents and positioning itself for growth in the energy bars market.
|
Energy Bar Market |
|||
|
Base Year: |
2024 |
Forecast Period: |
2025-2032 |
|
Historical Data: |
2018 to 2023 |
Market Size in 2024: |
USD 3.27 Bn. |
|
Forecast Period 2024-32 CAGR: |
3.34% |
Market Size in 2032: |
USD 4.25 Bn. |
|
Segments Covered: |
By Product Type |
|
|
|
By Product Nature |
|
||
|
By Distribution Channel |
|
||
|
By Region |
|
||
|
Key Market Drivers: |
|
||
|
Key Market Restraints: |
|
||
|
Key Opportunities: |
|
||
|
Companies Covered in the report: |
|
||
Chapter 1: Introduction
1.1 Scope and Coverage
Chapter 2:Executive Summary
Chapter 3: Market Landscape
3.1 Market Dynamics
3.1.1 Drivers
3.1.2 Restraints
3.1.3 Opportunities
3.1.4 Challenges
3.2 Market Trend Analysis
3.3 PESTLE Analysis
3.4 Porter's Five Forces Analysis
3.5 Industry Value Chain Analysis
3.6 Ecosystem
3.7 Regulatory Landscape
3.8 Price Trend Analysis
3.9 Patent Analysis
3.10 Technology Evolution
3.11 Investment Pockets
3.12 Import-Export Analysis
Chapter 4: Energy Bar Market by Product Type (2018-2032)
4.1 Energy Bar Market Snapshot and Growth Engine
4.2 Market Overview
4.3 Protein Bar
4.3.1 Introduction and Market Overview
4.3.2 Historic and Forecasted Market Size in Value USD and Volume Units
4.3.3 Key Market Trends, Growth Factors, and Opportunities
4.3.4 Geographic Segmentation Analysis
4.4 Nutrition Bar
4.5 Fibre Bar
4.6 And Cereal Bar
Chapter 5: Energy Bar Market by Product Nature (2018-2032)
5.1 Energy Bar Market Snapshot and Growth Engine
5.2 Market Overview
5.3 Organic
5.3.1 Introduction and Market Overview
5.3.2 Historic and Forecasted Market Size in Value USD and Volume Units
5.3.3 Key Market Trends, Growth Factors, and Opportunities
5.3.4 Geographic Segmentation Analysis
5.4 Conventional
Chapter 6: Energy Bar Market by Distribution Channel (2018-2032)
6.1 Energy Bar Market Snapshot and Growth Engine
6.2 Market Overview
6.3 Supermarkets/ Hypermarkets
6.3.1 Introduction and Market Overview
6.3.2 Historic and Forecasted Market Size in Value USD and Volume Units
6.3.3 Key Market Trends, Growth Factors, and Opportunities
6.3.4 Geographic Segmentation Analysis
6.4 Convenience Stores
6.5 Specialty Stores
6.6 Online Stores
6.7 Other
Chapter 7: Company Profiles and Competitive Analysis
7.1 Competitive Landscape
7.1.1 Competitive Benchmarking
7.1.2 Energy Bar Market Share by Manufacturer (2024)
7.1.3 Industry BCG Matrix
7.1.4 Heat Map Analysis
7.1.5 Mergers and Acquisitions
7.2 SIEMENS(GERMANY)
7.2.1 Company Overview
7.2.2 Key Executives
7.2.3 Company Snapshot
7.2.4 Role of the Company in the Market
7.2.5 Sustainability and Social Responsibility
7.2.6 Operating Business Segments
7.2.7 Product Portfolio
7.2.8 Business Performance
7.2.9 Key Strategic Moves and Recent Developments
7.2.10 SWOT Analysis
7.3 ABB(SWITZERLAND)
7.4 SCHNEIDER ELECTRIC (FRANCE)
7.5 ROCKWELL AUTOMATION (USA)
7.6 HONEYWELL INTERNATIONAL (USA)
7.7 EMERSON ELECTRIC CO. (USA)
7.8 MITSUBISHI ELECTRIC (JAPAN)
7.9 FANUC (JAPAN)
7.10 YOKOGAWA ELECTRIC CORPORATION (JAPAN)
7.11 OMRON CORPORATION (JAPAN)
7.12 BOSCH REXROTH AG (GERMANY)
7.13 KUKA ROBOTICS (GERMANY)
7.14 YASKAWA ELECTRIC CORPORATION (JAPAN)
7.15 EATON CORPORATION (IRELAND)
7.16 SCHNEIDER ELECTRIC INDUSTRIAL AUTOMATION (FRANCE)
7.17 BECKHOFF AUTOMATION GMBH (GERMANY)
7.18 MITSUBISHI HEAVY INDUSTRIES LTD. (JAPAN)
7.19 PHOENIX CONTACT ELECTRONICS GMBH (GERMANY)
7.20 NATIONAL INSTRUMENTS (USA)
7.21 COGNEX CORPORATION (USA)
7.22
Chapter 8: Global Energy Bar Market By Region
8.1 Overview
8.2. North America Energy Bar Market
8.2.1 Key Market Trends, Growth Factors and Opportunities
8.2.2 Top Key Companies
8.2.3 Historic and Forecasted Market Size by Segments
8.2.4 Historic and Forecasted Market Size by Product Type
8.2.4.1 Protein Bar
8.2.4.2 Nutrition Bar
8.2.4.3 Fibre Bar
8.2.4.4 And Cereal Bar
8.2.5 Historic and Forecasted Market Size by Product Nature
8.2.5.1 Organic
8.2.5.2 Conventional
8.2.6 Historic and Forecasted Market Size by Distribution Channel
8.2.6.1 Supermarkets/ Hypermarkets
8.2.6.2 Convenience Stores
8.2.6.3 Specialty Stores
8.2.6.4 Online Stores
8.2.6.5 Other
8.2.7 Historic and Forecast Market Size by Country
8.2.7.1 US
8.2.7.2 Canada
8.2.7.3 Mexico
8.3. Eastern Europe Energy Bar Market
8.3.1 Key Market Trends, Growth Factors and Opportunities
8.3.2 Top Key Companies
8.3.3 Historic and Forecasted Market Size by Segments
8.3.4 Historic and Forecasted Market Size by Product Type
8.3.4.1 Protein Bar
8.3.4.2 Nutrition Bar
8.3.4.3 Fibre Bar
8.3.4.4 And Cereal Bar
8.3.5 Historic and Forecasted Market Size by Product Nature
8.3.5.1 Organic
8.3.5.2 Conventional
8.3.6 Historic and Forecasted Market Size by Distribution Channel
8.3.6.1 Supermarkets/ Hypermarkets
8.3.6.2 Convenience Stores
8.3.6.3 Specialty Stores
8.3.6.4 Online Stores
8.3.6.5 Other
8.3.7 Historic and Forecast Market Size by Country
8.3.7.1 Russia
8.3.7.2 Bulgaria
8.3.7.3 The Czech Republic
8.3.7.4 Hungary
8.3.7.5 Poland
8.3.7.6 Romania
8.3.7.7 Rest of Eastern Europe
8.4. Western Europe Energy Bar Market
8.4.1 Key Market Trends, Growth Factors and Opportunities
8.4.2 Top Key Companies
8.4.3 Historic and Forecasted Market Size by Segments
8.4.4 Historic and Forecasted Market Size by Product Type
8.4.4.1 Protein Bar
8.4.4.2 Nutrition Bar
8.4.4.3 Fibre Bar
8.4.4.4 And Cereal Bar
8.4.5 Historic and Forecasted Market Size by Product Nature
8.4.5.1 Organic
8.4.5.2 Conventional
8.4.6 Historic and Forecasted Market Size by Distribution Channel
8.4.6.1 Supermarkets/ Hypermarkets
8.4.6.2 Convenience Stores
8.4.6.3 Specialty Stores
8.4.6.4 Online Stores
8.4.6.5 Other
8.4.7 Historic and Forecast Market Size by Country
8.4.7.1 Germany
8.4.7.2 UK
8.4.7.3 France
8.4.7.4 The Netherlands
8.4.7.5 Italy
8.4.7.6 Spain
8.4.7.7 Rest of Western Europe
8.5. Asia Pacific Energy Bar Market
8.5.1 Key Market Trends, Growth Factors and Opportunities
8.5.2 Top Key Companies
8.5.3 Historic and Forecasted Market Size by Segments
8.5.4 Historic and Forecasted Market Size by Product Type
8.5.4.1 Protein Bar
8.5.4.2 Nutrition Bar
8.5.4.3 Fibre Bar
8.5.4.4 And Cereal Bar
8.5.5 Historic and Forecasted Market Size by Product Nature
8.5.5.1 Organic
8.5.5.2 Conventional
8.5.6 Historic and Forecasted Market Size by Distribution Channel
8.5.6.1 Supermarkets/ Hypermarkets
8.5.6.2 Convenience Stores
8.5.6.3 Specialty Stores
8.5.6.4 Online Stores
8.5.6.5 Other
8.5.7 Historic and Forecast Market Size by Country
8.5.7.1 China
8.5.7.2 India
8.5.7.3 Japan
8.5.7.4 South Korea
8.5.7.5 Malaysia
8.5.7.6 Thailand
8.5.7.7 Vietnam
8.5.7.8 The Philippines
8.5.7.9 Australia
8.5.7.10 New Zealand
8.5.7.11 Rest of APAC
8.6. Middle East & Africa Energy Bar Market
8.6.1 Key Market Trends, Growth Factors and Opportunities
8.6.2 Top Key Companies
8.6.3 Historic and Forecasted Market Size by Segments
8.6.4 Historic and Forecasted Market Size by Product Type
8.6.4.1 Protein Bar
8.6.4.2 Nutrition Bar
8.6.4.3 Fibre Bar
8.6.4.4 And Cereal Bar
8.6.5 Historic and Forecasted Market Size by Product Nature
8.6.5.1 Organic
8.6.5.2 Conventional
8.6.6 Historic and Forecasted Market Size by Distribution Channel
8.6.6.1 Supermarkets/ Hypermarkets
8.6.6.2 Convenience Stores
8.6.6.3 Specialty Stores
8.6.6.4 Online Stores
8.6.6.5 Other
8.6.7 Historic and Forecast Market Size by Country
8.6.7.1 Turkiye
8.6.7.2 Bahrain
8.6.7.3 Kuwait
8.6.7.4 Saudi Arabia
8.6.7.5 Qatar
8.6.7.6 UAE
8.6.7.7 Israel
8.6.7.8 South Africa
8.7. South America Energy Bar Market
8.7.1 Key Market Trends, Growth Factors and Opportunities
8.7.2 Top Key Companies
8.7.3 Historic and Forecasted Market Size by Segments
8.7.4 Historic and Forecasted Market Size by Product Type
8.7.4.1 Protein Bar
8.7.4.2 Nutrition Bar
8.7.4.3 Fibre Bar
8.7.4.4 And Cereal Bar
8.7.5 Historic and Forecasted Market Size by Product Nature
8.7.5.1 Organic
8.7.5.2 Conventional
8.7.6 Historic and Forecasted Market Size by Distribution Channel
8.7.6.1 Supermarkets/ Hypermarkets
8.7.6.2 Convenience Stores
8.7.6.3 Specialty Stores
8.7.6.4 Online Stores
8.7.6.5 Other
8.7.7 Historic and Forecast Market Size by Country
8.7.7.1 Brazil
8.7.7.2 Argentina
8.7.7.3 Rest of SA
Chapter 9 Analyst Viewpoint and Conclusion
9.1 Recommendations and Concluding Analysis
9.2 Potential Market Strategies
Chapter 10 Research Methodology
10.1 Research Process
10.2 Primary Research
10.3 Secondary Research
|
Energy Bar Market |
|||
|
Base Year: |
2024 |
Forecast Period: |
2025-2032 |
|
Historical Data: |
2018 to 2023 |
Market Size in 2024: |
USD 3.27 Bn. |
|
Forecast Period 2024-32 CAGR: |
3.34% |
Market Size in 2032: |
USD 4.25 Bn. |
|
Segments Covered: |
By Product Type |
|
|
|
By Product Nature |
|
||
|
By Distribution Channel |
|
||
|
By Region |
|
||
|
Key Market Drivers: |
|
||
|
Key Market Restraints: |
|
||
|
Key Opportunities: |
|
||
|
Companies Covered in the report: |
|
||


