


Global Electric Ships Market Overview
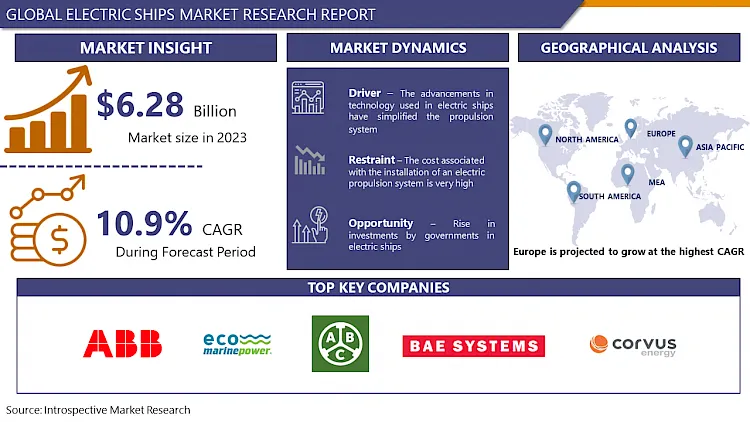
Global Electric Ships Market Size Was Valued at USD 6.28 Billion In 2023 And Is Projected to Reach USD 15.93 Billion By 2032, Growing at A CAGR of 10.9% From 2024 To 2032.
The electric ship industry is emerging with promising prospects driven by stringent environmental regulations, growing demand for sustainable transportation, and breakthroughs in battery technology. These ships, ranging from fully electric to hybrid models, are becoming favored choices for short-haul trips and longer voyages alike, offering cleaner and more efficient alternatives to traditional vessels.
Electric ships are champions of clean air, producing zero emissions during operation. This translates to better air quality, particularly in port cities and coastal communities, and combats greenhouse gas emissions, a key factor in climate change. Electric motors hum quietly compared to the roar of diesel engines. This tranquility benefits not only marine life but also people living and working near ports. Electric ships can turn out to be more economical in the long run. They require less maintenance for electric motors compared to complex diesel engines, and electricity can sometimes be cheaper than fuel, especially with the rising prices of oil.

Market Dynamics and Key Factors In Electric Ships Market
Drivers:
The advancements in technology used in electric ships have simplified the propulsion system, including the sophisticated reduction gear used to run the ship thus propelling the expansion of electric ship markets in the period of forecast. Moreover, the incorporation of electric ships has decreased the financial burden of maintenance and repair including life cycle costs due to the fact, electric ship utilizes integrated propulsion motors with power generation motors to support the internal electrical load. Furthermore, electric ships aids in silencing the onboard noise thus reducing the impact caused by the movement of the ship on the marine animals. Additionally, electric ships enhance fuel efficiency during travel owing to the ability to maintain a constant rotational speed that offers good fuel efficiency in the motors used for producing propulsive electric power. All these factors strengthen the growth of the electric ship market during the forecast period.
The transmission of severe stresses such as torsional and vibration is restricted as there is no direct connection of propeller shaft and prime mover in electric propulsion motors. Moreover, electric ships provide more flexibility in the installation of machinery. The space required for the installation of electric propulsion motors is very less and compact as compared to the conventional system. The motor used in electric ships generates maximum torque across the entire speed range at the propeller. Furthermore, the electric motor used in electric ships provides a much-enhanced dynamic response from zero to maximum propelling speed as compared to other conventional propelling systems. In addition, the time required for maintenance and service is very less thus encouraging the electric ship market development in the period of forecast.
The revised rules and regulations implemented by International Maritime Organization (IMO) in 2020 have compelled ship operators to use fuels having 0.50% sulfur content. Thus, ship operators are integrating the use of electric or hybrid propulsion systems instead of conventional diesel-driven engines. Such rules and regulations are promoting the diversification of the Electric ship's market.
Restraints:
The cost associated with the installation of an electric propulsion system is very high. Moreover, as the system involved in the electric ship is completely different from the mechanical system, an improvised training program to generate skilled and qualified labor is required. Additionally, this is a time-consuming and costly process, thus negatively impacting the growth of the electric ship market. The distance traveled by electric ships on a single charge is the limiting factor hindering the electric ship's market growth. In addition, the current battery technology doesn't facilitate the energy required for large merchant ships. Electric ships require charging stations to recharge the depleted batteries, as the use of electric ships is limited it will take time for the charging facilities to spread globally. Moreover, the speed offered by the electric propulsion system is low as compared to the conventional diesel engines. In certain instances, the load on the electric propulsion system can cause battery breakdown, thus all these factors are hampering the electric ship market growth during the period of forecast.
Opportunities:
Recently there has been a rise in investments by governments in electric ships, to make them compatible for long-distance transportation and to deploy charging stations at numerous points. Moreover, advancements in technology have improvised the efficiency of hybrid-electric propulsion systems utilized in electric ships. Maritime tourism has observed significant growth in recent years. The increasing popularity of cruises, yachts, personalized boats and small boats is proving a vital opportunity for the market players to develop electric ships according to need. Furthermore, the rapid rise in the integration of electric or hybrid propulsion systems to reduce carbon emission and to preserve the natural flora and fauna of the marine ecosystem is instigating market players to manufacture electric motors.
Challenges:
To increase the capacity of the batteries and to make them lightweight are some of the major challenges faced by the manufacturers of electric ships. Current technologies used in the manufacturing of electric ship does not guarantee zero-emission standard thus, to make them emission-free is a vital challenge as major of commodity transportation takes place through ships.
Market Segmentation
Segmentation Analysis of Electric Ships Market:
Depending on Power Source, the hybrid segment is anticipated to dominate the market in the period of forecast. Hybrid electric propulsion systems generate less pollution compared to conventional engines which use heavy fuel. In hybrid engines, the power to propel the shaft is provided by natural gas/diesel generator and prime mover assembly as the shaft is directly connected to the AC/DC motor. It has been discovered that there has been a 20% decrease in the consumption of fuel and about a 15% reduction in carbon dioxide emissions when hybrid engines are used, thus boosting the growth of the hybrid segment.
Depending upon the Mode of Operation, the semi-autonomous segment is predicted to have the highest share of the electric ship market. To sustain the proper functioning and maintenance of a hybrid propulsion system there is a need for crew members to look after it, thus propelling the growth of this segment. The autonomous segment is forecasted to have the second-highest share of the market owing to the reduction in labor cost and decrease in errors caused by humans.
Depending upon Battery Type, the lithium-ion battery is forecasted to lead the electric ship market. Lithium-ion batteries have long-lasting life as compared to lead-acid batteries. Moreover, lithium-ion batteries are light in weight, get charged quickly, and discharge electricity according to the need. Lithium-ion batteries can operate at adverse temperatures efficiently compared to the other solutions available in the market, thus supporting the growth of this segment.
Depending on Vessel Type, the commercial segment is expected to dominate the electric ship market throughout the forecast. The commercial segment comprises tanker ships, container vessels, general cargo ships, yachts, cruise, and ferries. The increase in seaborne trade and the growing maritime tourism industry is strengthening the growth of the commercial segment. Various rules and regulations implemented by governments to decrease the use of sulfur in fuels are expected to increase the demand for commercial electric ships.
Depending on the System, the energy storage segment is anticipated to have significant growth. Features such as lower emissions, fuel savings, and increased safety during operation and maintenance are driving the need for energy storage systems in electric ships, thus fueling the development of this segment.
Regional Analysis of Electric Ships Market:
Europe's dominance in the global electric ship market is driven by several factors, including strong government support for clean energy initiatives, robust infrastructure for electric transportation, and a focus on reducing emissions in the maritime industry. Countries like Norway, Denmark, and Sweden have been at the forefront of developing electric and hybrid vessels, with significant investments in research and development.
The European Union's ambitious environmental policies, such as the European Green Deal and the Clean Energy for All Europeans package. These initiatives aim to accelerate the transition to a low-carbon economy and promote the adoption of sustainable technologies across various sectors, including maritime transportation. As a result, European shipbuilders and maritime companies are increasingly investing in electric propulsion systems and alternative fuel technologies to meet the growing demand for eco-friendly vessels.
Europe's strategic location and extensive network of ports make it an ideal market for electric ships, as these vessels offer significant environmental benefits, such as reduced greenhouse gas emissions and noise pollution. With growing concerns about climate change and air quality, European countries are increasingly prioritizing the adoption of electric and hybrid vessels to achieve their environmental targets and improve the sustainability of their maritime operations. Overall, Europe's leadership in the electric ship market is expected to continue as the region continues to invest in clean energy technologies and promotes sustainable transportation solutions.
Players Covered in Electric Ships market are :
- ABB (Switzerland)
- ECO Marine Power Co Ltd. (UK)
- Anglo Belgian Corporation NV (Belgium)
- Bae Systems (UK)
- Corvus Energy (Canada)
- Echandia Marine AB (Sweden)
- EST Floattech (Netherlands)
- General Dynamics Electric Boat (US)
- General Electric (US)
- Kongsberg Gruppen (Norway)
- Leclanché SA (Switzerland)
- Man Energy Solutions (Germany)
- Norwegian Electric Systems (Norway)
- Siemens (Germany)
- Wartsila (Finland) and other major players.
Key Industry Developments In Electric Ships Market
-
In March 2023, ABB secured a deal with Fincantieri to provide eight mid-range Azipod propulsion systems for the construction of four medium-sized cruise ships. Each passenger vessel will be equipped with two 7.7-megawatt Azipod propulsion units. Delivery of these ships is scheduled for 2024, 2025, 2026, and 2027. The Azipod system, featuring an electric drive motor housed within a pod located beyond the ship's hull, offers the unique capability to rotate 360 degrees, facilitating smooth docking in harbors with limited turning space.
In February 2023, Kongsberg Maritime (KONGSBERG) secured an agreement to supply a range of equipment for a newly constructed vessel named SDO-SuRS (Special and Diving Operations - Submarine Rescue Ship), being built by the Italian shipyard T.Mariotti for the Marina Militare Italiana (The Italian Navy).
In February 2023, GE's local subsidiary in India finalized a contract with Cochin Shipyard to deliver a comprehensive digital solutions package aimed at enhancing the performance of the LM2500 marine gas turbines that drive the Indian Navy's inaugural Indigenous Aircraft Carrier-1 (IAC-1) Vikrant. Vikrant was commissioned in August 2022.
|
Global Electric Ships Market |
|||
|
Base Year: |
2022 |
Forecast Period: |
2023-2030 |
|
Historical Data: |
2017 to 2022 |
Market Size in 2022: |
USD 5.66 Bn. |
|
Forecast Period 2022-28 CAGR: |
10.9% |
Market Size in 2030: |
USD 12.94 Bn. |
|
Segments Covered: |
By Power Source |
|
|
|
By Autonomy Level |
|
||
|
By Vessel Type |
|
||
|
By Region |
|
||
|
Key Market Drivers: |
|
||
|
Key Market Restraints: |
|
||
|
Key Opportunities: |
|
||
|
Companies Covered in the report: |
|
||
1.1 Scope and Coverage
Chapter 2:Executive Summary
Chapter 3: Market Landscape
3.1 Market Dynamics
3.1.1 Drivers
3.1.2 Restraints
3.1.3 Opportunities
3.1.4 Challenges
3.2 Market Trend Analysis
3.3 PESTLE Analysis
3.4 Porter's Five Forces Analysis
3.5 Industry Value Chain Analysis
3.6 Ecosystem
3.7 Regulatory Landscape
3.8 Price Trend Analysis
3.9 Patent Analysis
3.10 Technology Evolution
3.11 Investment Pockets
3.12 Import-Export Analysis
Chapter 4: Electric Ships Market by Power Source (2018-2032)
4.1 Electric Ships Market Snapshot and Growth Engine
4.2 Market Overview
4.3 Hybrid
4.3.1 Introduction and Market Overview
4.3.2 Historic and Forecasted Market Size in Value USD and Volume Units
4.3.3 Key Market Trends, Growth Factors, and Opportunities
4.3.4 Geographic Segmentation Analysis
4.4 Fully Electric
Chapter 5: Electric Ships Market by Autonomy Level (2018-2032)
5.1 Electric Ships Market Snapshot and Growth Engine
5.2 Market Overview
5.3 Semi-Autonomous
5.3.1 Introduction and Market Overview
5.3.2 Historic and Forecasted Market Size in Value USD and Volume Units
5.3.3 Key Market Trends, Growth Factors, and Opportunities
5.3.4 Geographic Segmentation Analysis
5.4 Fully Autonomous
Chapter 6: Electric Ships Market by Vessel Type (2018-2032)
6.1 Electric Ships Market Snapshot and Growth Engine
6.2 Market Overview
6.3 Commercial
6.3.1 Introduction and Market Overview
6.3.2 Historic and Forecasted Market Size in Value USD and Volume Units
6.3.3 Key Market Trends, Growth Factors, and Opportunities
6.3.4 Geographic Segmentation Analysis
6.4 Defense
6.5 Special
Chapter 7: Company Profiles and Competitive Analysis
7.1 Competitive Landscape
7.1.1 Competitive Benchmarking
7.1.2 Electric Ships Market Share by Manufacturer (2024)
7.1.3 Industry BCG Matrix
7.1.4 Heat Map Analysis
7.1.5 Mergers and Acquisitions
7.2 MEDTRONIC
7.2.1 Company Overview
7.2.2 Key Executives
7.2.3 Company Snapshot
7.2.4 Role of the Company in the Market
7.2.5 Sustainability and Social Responsibility
7.2.6 Operating Business Segments
7.2.7 Product Portfolio
7.2.8 Business Performance
7.2.9 Key Strategic Moves and Recent Developments
7.2.10 SWOT Analysis
7.3 GETINGE
7.4 AB
7.5 XENIOS AG
7.6 ALUNG TECHNOLOGIES
7.7 ESTOR S.P.A
7.8 MEDICA SPA
7.9 AFERECTICA SRL
7.10 OTHERS
7.11
Chapter 8: Global Electric Ships Market By Region
8.1 Overview
8.2. North America Electric Ships Market
8.2.1 Key Market Trends, Growth Factors and Opportunities
8.2.2 Top Key Companies
8.2.3 Historic and Forecasted Market Size by Segments
8.2.4 Historic and Forecasted Market Size by Power Source
8.2.4.1 Hybrid
8.2.4.2 Fully Electric
8.2.5 Historic and Forecasted Market Size by Autonomy Level
8.2.5.1 Semi-Autonomous
8.2.5.2 Fully Autonomous
8.2.6 Historic and Forecasted Market Size by Vessel Type
8.2.6.1 Commercial
8.2.6.2 Defense
8.2.6.3 Special
8.2.7 Historic and Forecast Market Size by Country
8.2.7.1 US
8.2.7.2 Canada
8.2.7.3 Mexico
8.3. Eastern Europe Electric Ships Market
8.3.1 Key Market Trends, Growth Factors and Opportunities
8.3.2 Top Key Companies
8.3.3 Historic and Forecasted Market Size by Segments
8.3.4 Historic and Forecasted Market Size by Power Source
8.3.4.1 Hybrid
8.3.4.2 Fully Electric
8.3.5 Historic and Forecasted Market Size by Autonomy Level
8.3.5.1 Semi-Autonomous
8.3.5.2 Fully Autonomous
8.3.6 Historic and Forecasted Market Size by Vessel Type
8.3.6.1 Commercial
8.3.6.2 Defense
8.3.6.3 Special
8.3.7 Historic and Forecast Market Size by Country
8.3.7.1 Russia
8.3.7.2 Bulgaria
8.3.7.3 The Czech Republic
8.3.7.4 Hungary
8.3.7.5 Poland
8.3.7.6 Romania
8.3.7.7 Rest of Eastern Europe
8.4. Western Europe Electric Ships Market
8.4.1 Key Market Trends, Growth Factors and Opportunities
8.4.2 Top Key Companies
8.4.3 Historic and Forecasted Market Size by Segments
8.4.4 Historic and Forecasted Market Size by Power Source
8.4.4.1 Hybrid
8.4.4.2 Fully Electric
8.4.5 Historic and Forecasted Market Size by Autonomy Level
8.4.5.1 Semi-Autonomous
8.4.5.2 Fully Autonomous
8.4.6 Historic and Forecasted Market Size by Vessel Type
8.4.6.1 Commercial
8.4.6.2 Defense
8.4.6.3 Special
8.4.7 Historic and Forecast Market Size by Country
8.4.7.1 Germany
8.4.7.2 UK
8.4.7.3 France
8.4.7.4 The Netherlands
8.4.7.5 Italy
8.4.7.6 Spain
8.4.7.7 Rest of Western Europe
8.5. Asia Pacific Electric Ships Market
8.5.1 Key Market Trends, Growth Factors and Opportunities
8.5.2 Top Key Companies
8.5.3 Historic and Forecasted Market Size by Segments
8.5.4 Historic and Forecasted Market Size by Power Source
8.5.4.1 Hybrid
8.5.4.2 Fully Electric
8.5.5 Historic and Forecasted Market Size by Autonomy Level
8.5.5.1 Semi-Autonomous
8.5.5.2 Fully Autonomous
8.5.6 Historic and Forecasted Market Size by Vessel Type
8.5.6.1 Commercial
8.5.6.2 Defense
8.5.6.3 Special
8.5.7 Historic and Forecast Market Size by Country
8.5.7.1 China
8.5.7.2 India
8.5.7.3 Japan
8.5.7.4 South Korea
8.5.7.5 Malaysia
8.5.7.6 Thailand
8.5.7.7 Vietnam
8.5.7.8 The Philippines
8.5.7.9 Australia
8.5.7.10 New Zealand
8.5.7.11 Rest of APAC
8.6. Middle East & Africa Electric Ships Market
8.6.1 Key Market Trends, Growth Factors and Opportunities
8.6.2 Top Key Companies
8.6.3 Historic and Forecasted Market Size by Segments
8.6.4 Historic and Forecasted Market Size by Power Source
8.6.4.1 Hybrid
8.6.4.2 Fully Electric
8.6.5 Historic and Forecasted Market Size by Autonomy Level
8.6.5.1 Semi-Autonomous
8.6.5.2 Fully Autonomous
8.6.6 Historic and Forecasted Market Size by Vessel Type
8.6.6.1 Commercial
8.6.6.2 Defense
8.6.6.3 Special
8.6.7 Historic and Forecast Market Size by Country
8.6.7.1 Turkiye
8.6.7.2 Bahrain
8.6.7.3 Kuwait
8.6.7.4 Saudi Arabia
8.6.7.5 Qatar
8.6.7.6 UAE
8.6.7.7 Israel
8.6.7.8 South Africa
8.7. South America Electric Ships Market
8.7.1 Key Market Trends, Growth Factors and Opportunities
8.7.2 Top Key Companies
8.7.3 Historic and Forecasted Market Size by Segments
8.7.4 Historic and Forecasted Market Size by Power Source
8.7.4.1 Hybrid
8.7.4.2 Fully Electric
8.7.5 Historic and Forecasted Market Size by Autonomy Level
8.7.5.1 Semi-Autonomous
8.7.5.2 Fully Autonomous
8.7.6 Historic and Forecasted Market Size by Vessel Type
8.7.6.1 Commercial
8.7.6.2 Defense
8.7.6.3 Special
8.7.7 Historic and Forecast Market Size by Country
8.7.7.1 Brazil
8.7.7.2 Argentina
8.7.7.3 Rest of SA
Chapter 9 Analyst Viewpoint and Conclusion
9.1 Recommendations and Concluding Analysis
9.2 Potential Market Strategies
Chapter 10 Research Methodology
10.1 Research Process
10.2 Primary Research
10.3 Secondary Research
|
Global Electric Ships Market |
|||
|
Base Year: |
2022 |
Forecast Period: |
2023-2030 |
|
Historical Data: |
2017 to 2022 |
Market Size in 2022: |
USD 5.66 Bn. |
|
Forecast Period 2022-28 CAGR: |
10.9% |
Market Size in 2030: |
USD 12.94 Bn. |
|
Segments Covered: |
By Power Source |
|
|
|
By Autonomy Level |
|
||
|
By Vessel Type |
|
||
|
By Region |
|
||
|
Key Market Drivers: |
|
||
|
Key Market Restraints: |
|
||
|
Key Opportunities: |
|
||
|
Companies Covered in the report: |
|
||
Frequently Asked Questions :
The forecast period in the Electric Ships Market research report is 2023-2030.
ABB (Switzerland), ECO Marine Power Co Ltd. (UK), Anglo Belgian Corporation NV (Belgium), Bae Systems (UK), Corvus Energy (Canada), Echandia Marine AB (Sweden), EST Floattech (Netherlands), General Dynamics Electric Boat (US), General Electric (US), Kongsberg Gruppen (Norway), Leclanché SA (Switzerland), Man Energy Solutions (Germany), Norwegian Electric Systems (Norway), Siemens (Germany), Wartsila (Finland), and other major players.
The Electric Ships Market is segmented into power source, autonomy level, vessel type, and region. By Power Source, the market is categorized into Hybrid and Fully Electric. By Autonomy Level, the market is categorized into Semi-Autonomous and Fully Autonomous. By Vessel Type, the market is categorized into Commercial, Defense, and Special. By region, it is analyzed across North America (U.S.; Canada; Mexico), Europe (Germany; U.K.; France; Italy; Russia; Spain, etc.), Asia-Pacific (China; India; Japan; Southeast Asia, etc.), South America (Brazil; Argentina, etc.), Middle East & Africa (Saudi Arabia; South Africa, etc.).
Fully electric ships use lead-corrosive or lithium batteries, power modules or solar energy as a force source. Hybrid electric ships show less contamination when compared to the traditional marine drive systems which consume large-scale oil.
Global Electric Ships Market Size Was Valued at USD 6.28 Billion In 2023 And Is Projected to Reach USD 15.93 Billion By 2032, Growing at A CAGR of 10.9% From 2024 To 2032.


