


Digital Asset Management Market Overview
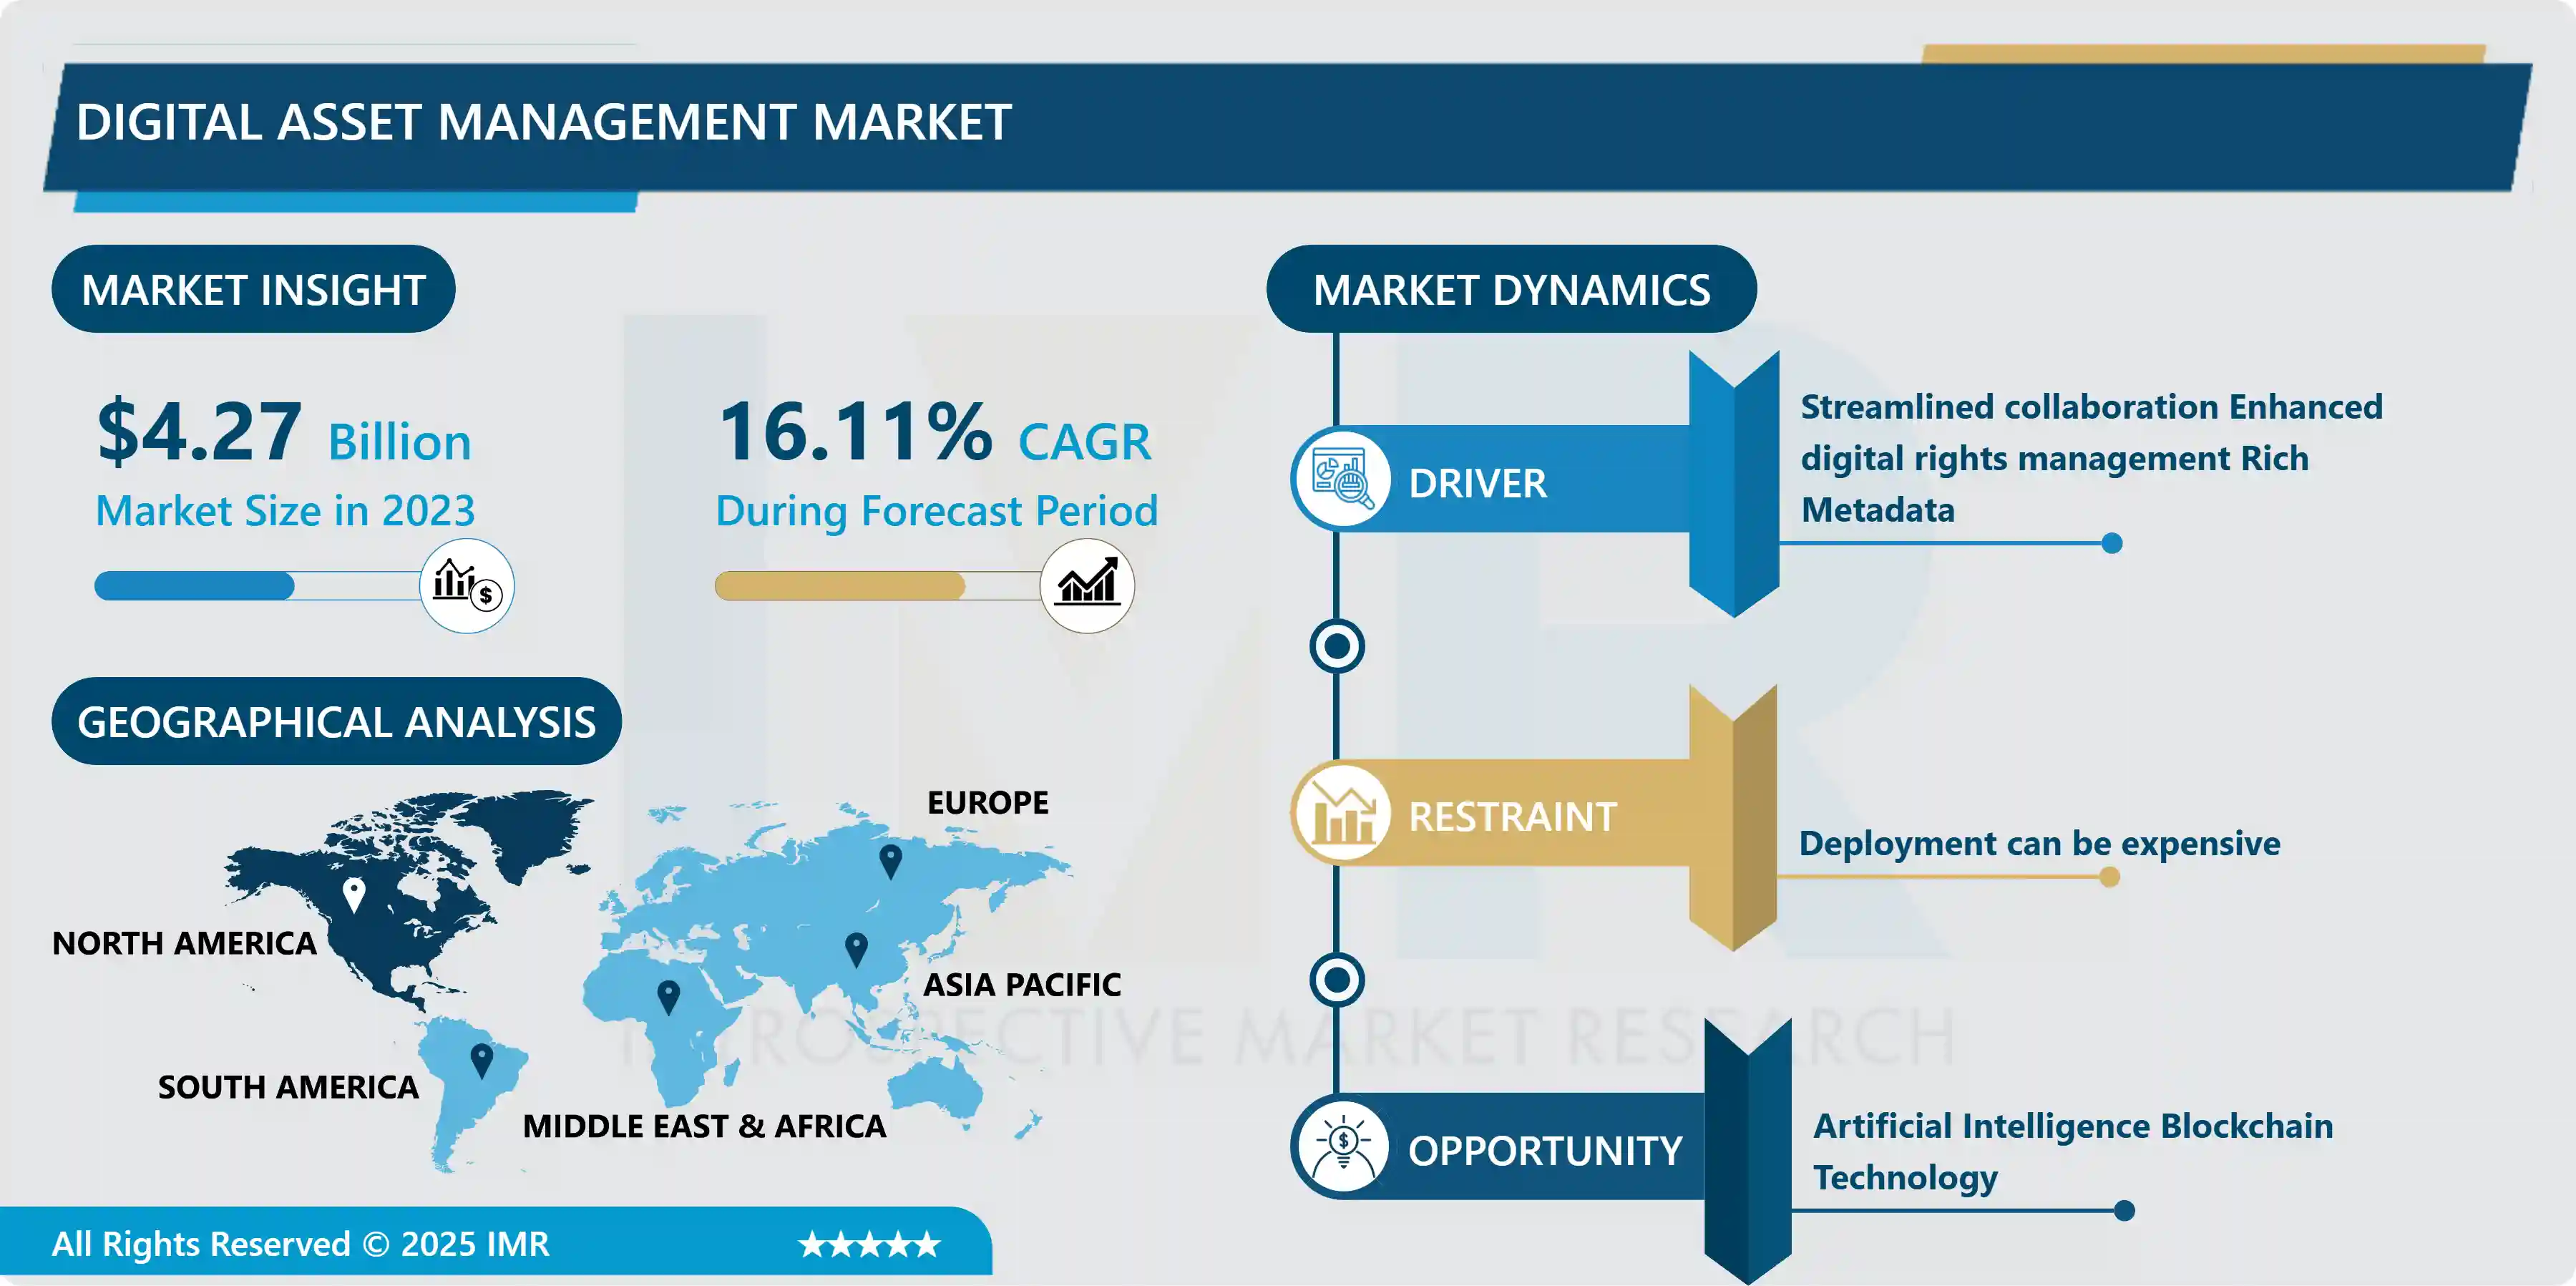
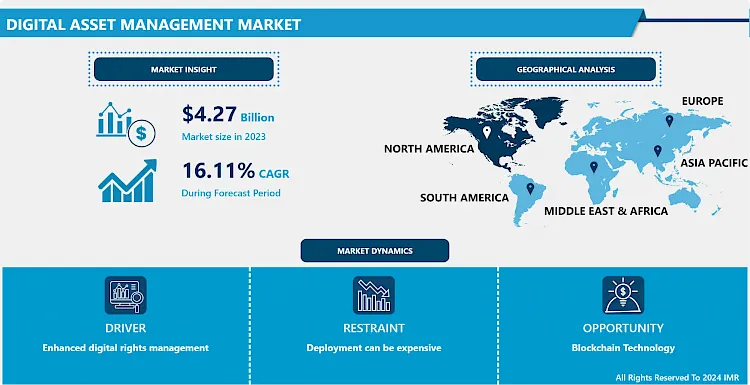
Global market for Digital Asset Management Market was estimated at USD 4.27 Billion in 2023 and is projected to reach USD 16.38 Billion by 2032, growing at a CAGR of 16.11% over the analysis period.
In 1992, Canto Software launched Cumulus — regarded as the first DAM system. It was an on-premises, standalone solution, that offered metadata indexing, thumbnail previewing, and searches capabilities. Though early DAM solutions helped users to easily find, verify, and retrieve assets, however files were still not easy to share.
Digital asset management (DAM) systems assist businesses to store, find, assemble, retrieving, and sharing their complete digital content catalogue from a singular reliable place, i.e. a "single source of truth". Quick to deploy and easy to use, a centralized DAM system offers peers, employees, clients, contractors, and other key stakeholders-controlled access to their entire digital content library—including images, photos, creative files, video, audio, presentations, documents, and more. Depending on the organization's demands and specific use cases, digital asset management systems come in a variety of forms and sizes. A large retail organization may utilize a DAM system primarily for managing e-commerce product imagery, whereas a worldwide non-profit organization may use DAM primarily for storing and exchanging up-to-date documentation within its internal teams. The increase in the demand for a collaborative digital workflow especially for marketing and sales activities is the major driving factor for the growth of the digital asset management market over the forecasted timeframe.
Market Dynamics And Factors For Digital Asset Management Market
Drivers:
Streamlined collaboration
- To produce content, today's creative teams frequently collaborate across different departments inside an organization or with external partners. Without a centralized system for managing digital assets, they may have difficulty uploading the appropriate materials and ensuring that everyone is working from the same version of those files. A good DAM system allows multiple contributors to quickly share assets by using upload links and dedicated portals rather than passing content between several storage locations and delivery methods, which can slow down cooperation and cause confusion. Organizations may ensure that each task has all it needs for success by creating linear workflows, which include everything from quickly providing access to the relevant file to identifying everyone who should be working on the task from start to finish.
Enhanced Digital Rights Management
- Most companies make extensive use of licensed material, which often takes the form of stock images, videos, and icons. It's easy to assume that once assets are acquired, they may be saved in a folder and used everywhere. Unfortunately, this is not always the case. Copyright restrictions on the use of digital assets may be quite specific, and failing to track how that property is utilized can put a corporation in legal jeopardy. Fortunately, DAM software allows users to easily check the licensing status of all assets in any content collection using digital rights management (DRM) tools. This guarantees that licensed content is not abused and allows for the tracking of how copyrighted, proprietary materials are utilized and shared within the enterprise.
Rich Metadata
- Metadata is a necessary element for correctly classifying and categorizing information. Brands may use digital asset management tools to keep track of their information for improved tracking and analysis. One of the main advantages of DAM is the ease with which users may search across thousands of files. This is done by tagging assets with ‘metadata,' which is a descriptive annotation of a document that allows it to be searchable. Metadata is important for searching since it makes it easier to find specific details about a user's digital assets. The more precise the keywords associated with digital assets, the easier it is to find them. Using metadata to classify digital assets saves search time, providing staff more time to focus on what matters most, and thereby supporting the growth of the digital asset management market throughout the study.
Restraints:
Deployment Can Be Expensive
- Investing in DAM may not be the best option for a new business or any company with limited cash flow. The procedure of running a high-quality DAM software must be done by a professional, who will install it before managing it regularly. Even though the majority of the software is intended to be used daily and open to all, it will require tests and general care over time to remain operational. As a result, there are two expenses to consider: the cost of the program and the cost of the service offered. These factors increase the deployment cost thereby, hampering the growth of the digital asset management market over the projected timeframe.
Opportunities:
Artificial Intelligence
- DAMs are intended to improve efficiency and save time, and artificial intelligence (AI) is taking this concept to the next level. By integrating DAMs with AI, tedious actions that are necessary for business operations but take a long time to complete may be automated, sparing teams valuable time. Content teams, for instance, may use AI to automate the optimization of metadata fields for search. AI may also be used to color-tag files and add descriptions to meet accessibility standards. Organizations may open up their employees' time by integrating AI into their digital asset management system. This digital asset management trend may become much more common in the near future, although few companies with DAM systems have begun integrating their DAMs with AI just yet thus, creating a lucrative opportunity for market players in coming years.
Blockchain Technology
- Due to the increase of cryptocurrencies, blockchain technology has received a lot of attention. However, with the growth of digital currencies, this technology has not only become common but has also been used in digital asset management solutions. This type of digital technology is intended to decentralize management and transaction processes, returning control to the user rather than an unseen, all-encompassing system. Utilizing blockchain technology in digital asset management gives users full control over every change to a file and every piece of data shared. Thus, the integration of blockchain technology in digital asset management is expected to create profitable opportunities for market players.
Market Segmentation Analysis of Digital Asset Management Market
- By Deployment Type, the cloud segment is anticipated to develop at the highest CAGR over the studied period. Finding an image in an organized repository of thousands of images may be difficult and expensive. With effective asset management, cloud-based DAM makes it simple. Assets can be grouped, classified, and sorted into particular file folders and categories. Using folders to keep assets organized by team, campaign, or purpose reduces clutter and enables diverse teams to collaborate freely. Teams are more productive with less effort when assets are more visible. Furthermore, if an asset has to be shared with another team or individual team member, it may be done so via a link to the asset location. There is no need to upload the image again and create duplicates.
- By Business Function, the human resource (HR) segment is expected to lead the development of the digital asset management market in the projected period. Due to the extensive scope and functionalities of systems like a digital asset management platform and similar ones, human resources (HR) operations are greatly affected. File management is streamlined, which is one of a DAM system's most significant effects on a company's HR operations. The business may manage its many files, including its creative digital assets and resources, with the help of a DAM system. From the perspective of HR departments, this capability streamlines their duty of giving access to employees and verifying that they are abiding by the levels of permissions and limits on access to servers and files.
- By End Use Industry, the media and entertainment segment is anticipated to have the highest share of the digital asset management market over the projected timeframe. Companies in the media and entertainment industries rely on digital assets to generate income. Due to their quick pace of content creation, a significant number of files are generated, all of which need to be organized and made accessible to various stakeholders. Teams will be more productive and efficient when using digital asset management (DAM) system to create, manage, share, archive, and analyses massive amounts of digital assets from a central source of truth.
Regional Analysis of Digital Asset Management Market
- The North American region is anticipated to have the highest share of the digital asset management market over the projected timeframe. The growing adoption of digital asset management solutions by manufacturing businesses in the USA and Canada is the major driving force for the growth of the market. As of 2022, there were 6,38,583 Manufacturing companies in the US, a 1.4 % growth from 2021. Furthermore, market players in this region are launching new products to increase their market share. For instance, to promote cross-team cooperation, Adobe introduced Adobe Experience Manager Assets Essentials. Assets Essentials is a pared-down version of Adobe Experience Manager Assets that makes it easier for marketing and creative professional teams to store, discover, and share digital assets. All Experience Cloud apps will by default use Assets Essentials for asset management. All these factors are expected to support the growth of the digital asset management market in this region.
- The market in the European region is expected to have the second highest share of the digital asset management market in the analysis period. Water specialists in this region are utilizing these solutions to make data-driven decisions to manage drinking water, stormwater, and wastewater distribution systems. Data-driven decisions have significantly increased utility efficiency in the Nordic countries. For instance, Denmark's strict regulations have forced the water sector to adopt cutting-edge technologies over the last 30 years, making it one of the most effective and resilient nations in the world. Danish industry recently advanced from simply benchmarking operating costs to cleverly creating a full financial benchmarking model (TOTEX). This method compares the utilities' financial efficiency using both OPEX and CAPEX. These solutions have helped governments to bring down a planned 12-month process to only 1.5 months. Due to the above-mentioned factors, the digital asset management market in this region is anticipated to grow significantly over the forecasted timeframe.
- The digital asset management market in the APAC region is anticipated to register the highest CAGR during the studied period. One of the most dynamic regions in the digital asset management sector is quickly becoming the Asia-Pacific. With their influence expanding into the Asia Pacific and expanding their investments in visual content strategy, global companies are turning to DAM as a solution to help companies deal with the usual issues that exist when dealing with global teams, new expansion areas, and content explosion. As 99.7% of industries fall within the small and medium firm category, according to the Small and Medium Enterprise Agency of Japan, Japan is the best country in this region for digital asset management solutions. Additionally, SMEs have chosen low- to medium-cost solutions, such as digital access control software, over ERP solutions due to their limited budgets and weak IT infrastructure thus, supporting the growth of the market in this region.
COVID-19 Impact Analysis on Digital Asset Management Market
- The sudden emergence of COVID-19 highlighted the necessity for businesses to be ready for the unexpected. Due to digital, centralized processes and operations that allowed them to continue to service their professional demands despite the difficulties posed by the health crisis, marketing teams adopting Digital Asset Management were better prepared for turbulent times. DAM systems can help organizations and their employees’ transition from a reactive to a predictive model of resource use. Monitoring and analyzing assets allows enterprises to better plan for and react to unforeseen events, increasing their resilience. When creating a business continuity plan, which calls for management to identify who is operating where and with what kind of asset, analytics is very helpful. Additionally, a central repository itself functions as a form of business continuity plan: Today's businesses frequently have points of failure due to old procedures and methods. For instance, data that is contained on a single desktop and media files that suddenly disappear from a drive that they were kept on locally. As a single source of truth, making sure assets are uploaded to a centralized DAM protects users against catastrophic asset-related scenarios and is a future-proof strategy. To summarize, the COVID-19 pandemic has boosted the adoption rate of digital asset management solutions.
Key Players of the Digital Asset Management Market
- Acquia
- Brandfolder
- Adobe
- Canto
- Bynder
- OpenText
- Hyland
- Northplains
- Veeva
- Extensis
- Cloudinary
- MediaValet
- WoodWing
- Kontainer
- Other Major Players
Key Industry Development In The Digital Asset Management Market
- In December 2024, Dow announced a partnership with Macquarie Asset Management to form Diamond Infrastructure Solutions, selling a 40% equity stake in select U.S. Gulf Coast infrastructure assets for initial proceeds of $2.4 billion, with the potential to increase to $3.0 billion. The venture will leverage Dow’s operational excellence and Macquarie’s infrastructure expertise to enhance efficiencies and unlock growth by serving Dow and third-party industrial customers across five Texas and Louisiana sites. Closing is expected in the first half of 2025, subject to regulatory approvals.
- In August 2024, State Street Corporation announced a strategic partnership with Taurus SA to enhance its Digital Asset Solutions platform, offering tokenization, digital custody, and blockchain connectivity services for institutional investors. Leveraging Taurus’ industry-leading tools—Taurus-PROTECT, Taurus-CAPITAL, and Taurus-EXPLORER—State Street aims to automate the issuance and servicing of digital assets, including securities and fund vehicles, aligning with institutional standards. This collaboration reinforces State Street’s commitment to delivering cutting-edge solutions in the growing digital asset management space, subject to regulatory approvals.
- In September 2023, Canto, Inc. introduced an advanced solution called AI Visual Search. This cutting-edge technology allows users to efficiently locate assets within their entire content library using visual descriptions. By bridging the gap between visual content and metadata-driven searches, AI Visual Search offers a more precise and intuitive approach to managing and utilizing digital assets.
|
Global Digital Asset Management Market |
|||
|
Base Year: |
2023 |
Forecast Period: |
2024-2032 |
|
Historical Data: |
2017 to 2022 |
Market Size in 2023: |
USD 4.27 Bn. |
|
Forecast Period 2022-28 CAGR: |
16.11% |
Market Size in 2032: |
USD 16.38 Bn. |
|
Segments Covered: |
By Deployment Type |
|
|
|
By Business Function |
|
||
|
By End User Industry |
|
||
|
By Region |
|
||
|
Key Market Drivers: |
|
||
|
Key Market Restraints: |
|
||
|
Key Opportunities: |
|
||
|
Companies Covered in the report: |
|
||
Chapter 1: Introduction
1.1 Scope and Coverage
Chapter 2:Executive Summary
Chapter 3: Market Landscape
3.1 Market Dynamics
3.1.1 Drivers
3.1.2 Restraints
3.1.3 Opportunities
3.1.4 Challenges
3.2 Market Trend Analysis
3.3 PESTLE Analysis
3.4 Porter's Five Forces Analysis
3.5 Industry Value Chain Analysis
3.6 Ecosystem
3.7 Regulatory Landscape
3.8 Price Trend Analysis
3.9 Patent Analysis
3.10 Technology Evolution
3.11 Investment Pockets
3.12 Import-Export Analysis
Chapter 4: Digital Asset Management Market by Deployment Type (2018-2032)
4.1 Digital Asset Management Market Snapshot and Growth Engine
4.2 Market Overview
4.3 Cloud
4.3.1 Introduction and Market Overview
4.3.2 Historic and Forecasted Market Size in Value USD and Volume Units
4.3.3 Key Market Trends, Growth Factors, and Opportunities
4.3.4 Geographic Segmentation Analysis
4.4 On-Premises
Chapter 5: Digital Asset Management Market by Business Function (2018-2032)
5.1 Digital Asset Management Market Snapshot and Growth Engine
5.2 Market Overview
5.3 Human Resource
5.3.1 Introduction and Market Overview
5.3.2 Historic and Forecasted Market Size in Value USD and Volume Units
5.3.3 Key Market Trends, Growth Factors, and Opportunities
5.3.4 Geographic Segmentation Analysis
5.4 Sales and Marketing
5.5 Information Technology
5.6 Others
Chapter 6: Digital Asset Management Market by End User Industry (2018-2032)
6.1 Digital Asset Management Market Snapshot and Growth Engine
6.2 Market Overview
6.3 Manufacturing
6.3.1 Introduction and Market Overview
6.3.2 Historic and Forecasted Market Size in Value USD and Volume Units
6.3.3 Key Market Trends, Growth Factors, and Opportunities
6.3.4 Geographic Segmentation Analysis
6.4 IT & Telecom
6.5 BFSI
6.6 Media and Entertainment
6.7 Others
Chapter 7: Company Profiles and Competitive Analysis
7.1 Competitive Landscape
7.1.1 Competitive Benchmarking
7.1.2 Digital Asset Management Market Share by Manufacturer (2024)
7.1.3 Industry BCG Matrix
7.1.4 Heat Map Analysis
7.1.5 Mergers and Acquisitions
7.2 AMAZON WEB SERVICES INC. (UNITED STATES)
7.2.1 Company Overview
7.2.2 Key Executives
7.2.3 Company Snapshot
7.2.4 Role of the Company in the Market
7.2.5 Sustainability and Social Responsibility
7.2.6 Operating Business Segments
7.2.7 Product Portfolio
7.2.8 Business Performance
7.2.9 Key Strategic Moves and Recent Developments
7.2.10 SWOT Analysis
7.3 GOOGLE LLC (UNITED STATES)
7.4 MICROSOFT CORPORATION (UNITED STATES)
7.5 IBM CORPORATION (UNITED STATES)
7.6 ORACLE CORPORATION (UNITED STATES)
7.7 ALIBABA CLOUD (CHINA)
7.8 RACKSPACE INC. (UNITED STATES)
7.9 FUJITSU LIMITED (JAPAN)
7.10 CENTURYLINK INC. (UNITED STATES)
7.11 VMWARE INC. (UNITED STATES)
7.12 DXC TECHNOLOGY (UNITED STATES)
7.13 DIMENSION DATA (SOUTH AFRICA)
7.14 VERIZON WIRELESS (UNITED STATES)
7.15 TENCENT HOLDINGS LTD. (CHINA)
7.16 AT&T MOBILITY LLC (UNITED STATES)
7.17 NEC CORPORATION (JAPAN)
7.18 OTHERS
7.19
Chapter 8: Global Digital Asset Management Market By Region
8.1 Overview
8.2. North America Digital Asset Management Market
8.2.1 Key Market Trends, Growth Factors and Opportunities
8.2.2 Top Key Companies
8.2.3 Historic and Forecasted Market Size by Segments
8.2.4 Historic and Forecasted Market Size by Deployment Type
8.2.4.1 Cloud
8.2.4.2 On-Premises
8.2.5 Historic and Forecasted Market Size by Business Function
8.2.5.1 Human Resource
8.2.5.2 Sales and Marketing
8.2.5.3 Information Technology
8.2.5.4 Others
8.2.6 Historic and Forecasted Market Size by End User Industry
8.2.6.1 Manufacturing
8.2.6.2 IT & Telecom
8.2.6.3 BFSI
8.2.6.4 Media and Entertainment
8.2.6.5 Others
8.2.7 Historic and Forecast Market Size by Country
8.2.7.1 US
8.2.7.2 Canada
8.2.7.3 Mexico
8.3. Eastern Europe Digital Asset Management Market
8.3.1 Key Market Trends, Growth Factors and Opportunities
8.3.2 Top Key Companies
8.3.3 Historic and Forecasted Market Size by Segments
8.3.4 Historic and Forecasted Market Size by Deployment Type
8.3.4.1 Cloud
8.3.4.2 On-Premises
8.3.5 Historic and Forecasted Market Size by Business Function
8.3.5.1 Human Resource
8.3.5.2 Sales and Marketing
8.3.5.3 Information Technology
8.3.5.4 Others
8.3.6 Historic and Forecasted Market Size by End User Industry
8.3.6.1 Manufacturing
8.3.6.2 IT & Telecom
8.3.6.3 BFSI
8.3.6.4 Media and Entertainment
8.3.6.5 Others
8.3.7 Historic and Forecast Market Size by Country
8.3.7.1 Russia
8.3.7.2 Bulgaria
8.3.7.3 The Czech Republic
8.3.7.4 Hungary
8.3.7.5 Poland
8.3.7.6 Romania
8.3.7.7 Rest of Eastern Europe
8.4. Western Europe Digital Asset Management Market
8.4.1 Key Market Trends, Growth Factors and Opportunities
8.4.2 Top Key Companies
8.4.3 Historic and Forecasted Market Size by Segments
8.4.4 Historic and Forecasted Market Size by Deployment Type
8.4.4.1 Cloud
8.4.4.2 On-Premises
8.4.5 Historic and Forecasted Market Size by Business Function
8.4.5.1 Human Resource
8.4.5.2 Sales and Marketing
8.4.5.3 Information Technology
8.4.5.4 Others
8.4.6 Historic and Forecasted Market Size by End User Industry
8.4.6.1 Manufacturing
8.4.6.2 IT & Telecom
8.4.6.3 BFSI
8.4.6.4 Media and Entertainment
8.4.6.5 Others
8.4.7 Historic and Forecast Market Size by Country
8.4.7.1 Germany
8.4.7.2 UK
8.4.7.3 France
8.4.7.4 The Netherlands
8.4.7.5 Italy
8.4.7.6 Spain
8.4.7.7 Rest of Western Europe
8.5. Asia Pacific Digital Asset Management Market
8.5.1 Key Market Trends, Growth Factors and Opportunities
8.5.2 Top Key Companies
8.5.3 Historic and Forecasted Market Size by Segments
8.5.4 Historic and Forecasted Market Size by Deployment Type
8.5.4.1 Cloud
8.5.4.2 On-Premises
8.5.5 Historic and Forecasted Market Size by Business Function
8.5.5.1 Human Resource
8.5.5.2 Sales and Marketing
8.5.5.3 Information Technology
8.5.5.4 Others
8.5.6 Historic and Forecasted Market Size by End User Industry
8.5.6.1 Manufacturing
8.5.6.2 IT & Telecom
8.5.6.3 BFSI
8.5.6.4 Media and Entertainment
8.5.6.5 Others
8.5.7 Historic and Forecast Market Size by Country
8.5.7.1 China
8.5.7.2 India
8.5.7.3 Japan
8.5.7.4 South Korea
8.5.7.5 Malaysia
8.5.7.6 Thailand
8.5.7.7 Vietnam
8.5.7.8 The Philippines
8.5.7.9 Australia
8.5.7.10 New Zealand
8.5.7.11 Rest of APAC
8.6. Middle East & Africa Digital Asset Management Market
8.6.1 Key Market Trends, Growth Factors and Opportunities
8.6.2 Top Key Companies
8.6.3 Historic and Forecasted Market Size by Segments
8.6.4 Historic and Forecasted Market Size by Deployment Type
8.6.4.1 Cloud
8.6.4.2 On-Premises
8.6.5 Historic and Forecasted Market Size by Business Function
8.6.5.1 Human Resource
8.6.5.2 Sales and Marketing
8.6.5.3 Information Technology
8.6.5.4 Others
8.6.6 Historic and Forecasted Market Size by End User Industry
8.6.6.1 Manufacturing
8.6.6.2 IT & Telecom
8.6.6.3 BFSI
8.6.6.4 Media and Entertainment
8.6.6.5 Others
8.6.7 Historic and Forecast Market Size by Country
8.6.7.1 Turkiye
8.6.7.2 Bahrain
8.6.7.3 Kuwait
8.6.7.4 Saudi Arabia
8.6.7.5 Qatar
8.6.7.6 UAE
8.6.7.7 Israel
8.6.7.8 South Africa
8.7. South America Digital Asset Management Market
8.7.1 Key Market Trends, Growth Factors and Opportunities
8.7.2 Top Key Companies
8.7.3 Historic and Forecasted Market Size by Segments
8.7.4 Historic and Forecasted Market Size by Deployment Type
8.7.4.1 Cloud
8.7.4.2 On-Premises
8.7.5 Historic and Forecasted Market Size by Business Function
8.7.5.1 Human Resource
8.7.5.2 Sales and Marketing
8.7.5.3 Information Technology
8.7.5.4 Others
8.7.6 Historic and Forecasted Market Size by End User Industry
8.7.6.1 Manufacturing
8.7.6.2 IT & Telecom
8.7.6.3 BFSI
8.7.6.4 Media and Entertainment
8.7.6.5 Others
8.7.7 Historic and Forecast Market Size by Country
8.7.7.1 Brazil
8.7.7.2 Argentina
8.7.7.3 Rest of SA
Chapter 9 Analyst Viewpoint and Conclusion
9.1 Recommendations and Concluding Analysis
9.2 Potential Market Strategies
Chapter 10 Research Methodology
10.1 Research Process
10.2 Primary Research
10.3 Secondary Research
|
Global Digital Asset Management Market |
|||
|
Base Year: |
2023 |
Forecast Period: |
2024-2032 |
|
Historical Data: |
2017 to 2022 |
Market Size in 2023: |
USD 4.27 Bn. |
|
Forecast Period 2022-28 CAGR: |
16.11% |
Market Size in 2032: |
USD 16.38 Bn. |
|
Segments Covered: |
By Deployment Type |
|
|
|
By Business Function |
|
||
|
By End User Industry |
|
||
|
By Region |
|
||
|
Key Market Drivers: |
|
||
|
Key Market Restraints: |
|
||
|
Key Opportunities: |
|
||
|
Companies Covered in the report: |
|
||
Frequently Asked Questions :
Acquia, Brandfolder, Adobe , Canto, Bynder, OpenText, Hyland, Northplains, Veeva, Extensis, Cloudinary, MediaValet, WoodWing, Kontainer, Other Major Players.


