


Cranberry Extract Market Synopsis
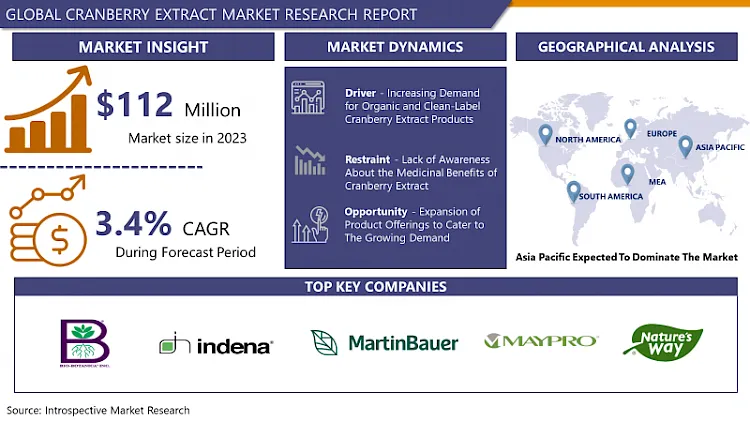
Cranberry Extract Market Size Was Valued at USD 115.81 Million in 2024, and is Projected to Reach USD 151.4 Million by 2032, Growing at a CAGR of 3.4% From 2025-2032.
Cranberry extract is an extract in concentrated form which is obtained from cranberry, the small, tart red fruit commonly associated with Thanksgiving dinner and urinary tract health. This initial step would be extraction of cranberries to isolate and concentrate their healthy components: antioxidants and flavonoids. Regarded as a source of many health benefits, cranberry extract is commonly found in both dietary supplements and juices, as well as in various health products. The most significant application of cranberry supplements is in improving urinary tract health. It is believed that these supplements prevent the binding of bacteria such as Escherichia coli to the urinary tract walls. Moreover, cranberry extract may have antioxidant properties which can help in dealing with oxidative stress and inflammation.
The market of cranberry extract has registered a constant growth in recent years, due to the fact that consumers became more and more informed about the wide range of health benefits that cranberries and their derivatives have. Among the major properties of cranberry extract is its high content of antioxidants and bioactive compounds, which are linked to several health benefits such as improved urinary tract health, reduced risk for developing urinary tract infections, and anti-inflammation.
Also, the increasing demand for organical and functional ingredients for food and beverage products has caused cranberry extract to evolve as well, being used in a wide range of products-from juices, to supplements, to snacks. Beyond that, the expanding interest of cranberry-based products in the pharmaceutical and cosmetic service for their claimed health and skin enhancing properties is also predicted to generalize the continued expansion and the diversification of the cranberry extract market in the near time to come.
Nevertheless, these constraints might act as limiting factors for market expansion because of the weather conditions which influence the amount of cranberry harvests and competition from other sources of antioxidants and health-promoting ingredients. Moreover, the pricing of cranberry extract, which is greatly affected by factors including crop yield and processing costs, may determine the affordable accessibility of cranberry products especially in emerging markets.
.webp)
Cranberry Extract Market Trend Analysis
Increasing demand for organic and clean-label cranberry extract products
- Nowadays consumers are more aware of what they eat and drink, choosing goods perceived as healthier and more natural. This is in line with the overall shift towards the slow food movement of clean eating and sustainable consumption.
- Consequently, cranberry extract manufacturers are coming up with products that are organic and are free from artificial additives, preservatives and pesticides as well as with clean-label formulation. This trend is an indicator that consumers are now looking for products from companies that are utilizing more transparent, eco-friendly sourcing and production methods meeting the requirement of health aware consumers for high quality natural ingredients with minimum processing.
Expansion of product offerings to cater to the growing demand
- Cranberry extract is rich in antioxidants and vitamins, making it an attractive ingredient for skin care products since it possesses potential anti-inflammatory and revitalizing properties. Creating skin-care items like moisturizers, serums, and masks with cranberry extract may provide benefits like skin hydration, protection against environmental factors, and rejuvenation of the skin.
- Moreover, the addition of cranberry extract to hair care products like shampoo and conditioners may serve as nutrients to the scalp and hair follicles, thus promoting hair growth. To capitalize on this, firms must invest in R&D to enhance formulations and efficacy of cranberry extract along with cosmetic manufacturers which can help to integrate cranberry extract into their product lines.
- By penetrating the beauty and personal care segment, cranberry extract suppliers will be able to diversify their revenue bases and take advantage of the rising focus on natural and organic beauty.
Cranberry Extract Market Segment Analysis:
Cranberry Extract Market is segmented on the basis of Type, Application and Region
By Type, Liquid segment is expected to dominate the market during the forecast period
- Cranberry extract market is anticipated to be dominated largely by the liquid segment during forecast period, mainly due to several factors. Liquid cranberry extract gives you the ease and flexibility to incorporate it across different industries such as food, pharmaceuticals, and cosmetics. In the food and beverage area liquid cranberry extract can be easily mixed with a variety of products like juices, smoothies, sauces, and dressings thus improving the taste and adding functional benefits.
- In addition, the pharmaceutical industry prefers liquid form of cranberry extract for ease of administration and possible efficacy in the prevention of urinary tract infections (UTIs) and improvement of urinary tract health. Cranberry formulations in the form of syrups, suspensions, and tinctures that are believed to be antibacterial and anti-inflammatory, are commercially available. On top of this, the liquid cranberry extract can be added to cosmetic and personal care products which enhance antioxidant protection, hydration and anti-aging benefits.
- Leading position of liquid segment implies that the focus on product formulation and delivery methods is imperative to increase bioavailability and efficacy of cranberry extract. Providers and manufacturers in this market can take advantage of this phenomenon by creating interesting, liquid formulas that meet the unique needs and preferences of the various customer groups. Moreover, strategic marketing efforts that emphasize the convenience, versatility and health benefits of liquid cranberry extract may help to boost demand and market growth.
By Application, Food and Beverages segment expected to held the largest share in 2024
- The outstanding role that the food and beverages portion of the cranberry extract market has in the market offers more room for growth and innovation within this particular sector. The growing number of health-conscious consumers who are aware of the beneficial properties of cranberry extract is behind the growing demand of having this ingredient in many foods and beverages. Manufacturers can take advantage of this by developing new formulations as well as applications that match the increasing demand for natural and functional ingredients.
- One potential growth area for the food and beverages segment is the creation of cranberry-infused products that focus on addressing particular health issues, including urinary tract problems or boosting immunity. Take for instance, manufacturers can formulate cranberry-flavored juices, smoothies as well as functional beverages that have added vitamins and minerals to enhance the nutritional value of the drink and appeal to the health-conscious consumers. In the same vein, adding the cranberry extract in the snacks, candies, and bakery items will provide consumers with an opportunity to relish the health effects of the cranberries as they bite into the products they enjoy.
- Further, being known for its versatility, manufacturers can also try out various culinary applications of the extract in savory dishes, condiments, and sauces to enhance the taste and nutritional value. Through partnership with chefs and culinary professionals to create new recipes and menu items, businesses can access the rising need for interesting and healthy food in restaurants, cafes and other eating places.
Cranberry Extract Market Regional Insights:
Asia Pacific is Expected to Dominate the Market Over the Forecast period
- The forecast period will witness the dominance of the Asia Pacific region in the market for cranberry extracts and this provides a very big opportunity for the players in the industry. The portentous growth is due to many factors, which include the rise in health and wellness concerns among consumers, the increase in disposable incomes, and the shift in dietary preferences to natural and functional ingredients. In addition to the other factors, the large population in this region, notably in the countries of China, India, and Japan, is a significant consumer market for cranberry extract products.
- To move ahead, companies can work on increasing their presence across Asia, including expanding their distribution channels, making their products more suitable to local demands. This might mean developing cranberry extract novel formulations aimed at markets with certain consumer segments and collaborations with local stores to increase market penetration.
- Hence, marketing and promotional activities used to educate the consumers regarding the health benefits of cranberry extract and its application in different food, beverages, and dietary supplements can have a significant influence on the demand and market growth. Not only that, by working in partnership with food and beverage manufacturers to add cranberry extract in Asian cuisine and traditional herbal medicines, the market reach and popularity can be increased as well.
Active Key Players in the Cranberry Extract Market
- Bio-Botanica (United States)
- Maypro (United States)
- Nutrativa (United States)
- Theralogix (United States)
- Maypro (United States)
- Fruit d'Or Nutraceuticals (Canada)
- Indena (Italy)
- Biosfered (Italy)
- Martin Bauer (Germany)
- Natural Field (Switzerland)
- Nexira (France)
- Naturex (France)
- Diana Food (France)
- Zhejiang Jianfeng Health (China)
- Hunan Huacheng (China)
- Other Active players
Key Industry Developments in the Cranberry Extract Market:
- In January 2024, Theralogix announces Mannose One, the only independently tested and content-certified d-mannose supplement. Manufactured in a GMP-compliant USA facility, Mannose One provides 2,000 mg of d-mannose per serving to help flush bacteria from the urinary tract. It's dye-free, gluten-free, and vegan-friendly, and complements Theralogix’s TheraCran One for optimal urinary tract health.
- In June 2024, Nutrativa Global and Palmer Holland, Inc. partnered to distribute cranberry ingredients across the U.S., covering Human Health, Wellness, and Nutrition exclusively, and Pet Nutrition non-exclusively. Products include Cranberry Fiber, Protein Powder, Powder, Whole Extract Powder, and Seed Oil, all upcycled at Northern Lights Food Processing, LLC, in Nekoosa, WI.
|
Global Cranberry Extract Market |
|||
|
Base Year: |
2024 |
Forecast Period: |
2025-2032 |
|
Historical Data: |
2018 to 2023 |
Market Size in 2024: |
USD 115.81 Mn. |
|
Forecast Period 2025-32 CAGR: |
3.4 % |
Market Size in 2032: |
USD 151.32 Mn. |
|
Segments Covered: |
By Type |
|
|
|
By Application |
|
||
|
By Region |
|
||
|
Key Market Drivers: |
|
||
|
Key Market Restraints: |
|
||
|
Key Opportunities: |
|
||
|
Companies Covered in the report: |
|
||
Chapter 1: Introduction
1.1 Scope and Coverage
Chapter 2:Executive Summary
Chapter 3: Market Landscape
3.1 Market Dynamics
3.1.1 Drivers
3.1.2 Restraints
3.1.3 Opportunities
3.1.4 Challenges
3.2 Market Trend Analysis
3.3 PESTLE Analysis
3.4 Porter's Five Forces Analysis
3.5 Industry Value Chain Analysis
3.6 Ecosystem
3.7 Regulatory Landscape
3.8 Price Trend Analysis
3.9 Patent Analysis
3.10 Technology Evolution
3.11 Investment Pockets
3.12 Import-Export Analysis
Chapter 4: Cranberry Extract Market by Type (2018-2032)
4.1 Cranberry Extract Market Snapshot and Growth Engine
4.2 Market Overview
4.3 Liquid
4.3.1 Introduction and Market Overview
4.3.2 Historic and Forecasted Market Size in Value USD and Volume Units
4.3.3 Key Market Trends, Growth Factors, and Opportunities
4.3.4 Geographic Segmentation Analysis
4.4 Dried
4.5 Powder
Chapter 5: Cranberry Extract Market by Application (2018-2032)
5.1 Cranberry Extract Market Snapshot and Growth Engine
5.2 Market Overview
5.3 Food and Beverages
5.3.1 Introduction and Market Overview
5.3.2 Historic and Forecasted Market Size in Value USD and Volume Units
5.3.3 Key Market Trends, Growth Factors, and Opportunities
5.3.4 Geographic Segmentation Analysis
5.4 Pharmaceuticals
5.5 Nutraceuticals
5.6 Confectionary
5.7 Personal Care
5.8 Beauty Products
5.9 Others
Chapter 6: Company Profiles and Competitive Analysis
6.1 Competitive Landscape
6.1.1 Competitive Benchmarking
6.1.2 Cranberry Extract Market Share by Manufacturer (2024)
6.1.3 Industry BCG Matrix
6.1.4 Heat Map Analysis
6.1.5 Mergers and Acquisitions
6.2 ACTIVE HERB TECHNOLOGY (UNITED STATES)
6.2.1 Company Overview
6.2.2 Key Executives
6.2.3 Company Snapshot
6.2.4 Role of the Company in the Market
6.2.5 Sustainability and Social Responsibility
6.2.6 Operating Business Segments
6.2.7 Product Portfolio
6.2.8 Business Performance
6.2.9 Key Strategic Moves and Recent Developments
6.2.10 SWOT Analysis
6.3 BARLOWE’S HERBAL ELIXIRS (UNITED STATES)
6.4 BRISTOL BOTANICALS (UNITED KINGDOM)
6.5 NATURE'S WAY PRODUCTS
6.6 LLC (UNITED STATES)
6.7 NUTRA GREEN BIOTECHNOLOGY (CHINA)
6.8 STAKICH (UNITED STATES)
6.9 OTHER KEY PLAYERS
6.10
Chapter 7: Global Cranberry Extract Market By Region
7.1 Overview
7.2. North America Cranberry Extract Market
7.2.1 Key Market Trends, Growth Factors and Opportunities
7.2.2 Top Key Companies
7.2.3 Historic and Forecasted Market Size by Segments
7.2.4 Historic and Forecasted Market Size by Type
7.2.4.1 Liquid
7.2.4.2 Dried
7.2.4.3 Powder
7.2.5 Historic and Forecasted Market Size by Application
7.2.5.1 Food and Beverages
7.2.5.2 Pharmaceuticals
7.2.5.3 Nutraceuticals
7.2.5.4 Confectionary
7.2.5.5 Personal Care
7.2.5.6 Beauty Products
7.2.5.7 Others
7.2.6 Historic and Forecast Market Size by Country
7.2.6.1 US
7.2.6.2 Canada
7.2.6.3 Mexico
7.3. Eastern Europe Cranberry Extract Market
7.3.1 Key Market Trends, Growth Factors and Opportunities
7.3.2 Top Key Companies
7.3.3 Historic and Forecasted Market Size by Segments
7.3.4 Historic and Forecasted Market Size by Type
7.3.4.1 Liquid
7.3.4.2 Dried
7.3.4.3 Powder
7.3.5 Historic and Forecasted Market Size by Application
7.3.5.1 Food and Beverages
7.3.5.2 Pharmaceuticals
7.3.5.3 Nutraceuticals
7.3.5.4 Confectionary
7.3.5.5 Personal Care
7.3.5.6 Beauty Products
7.3.5.7 Others
7.3.6 Historic and Forecast Market Size by Country
7.3.6.1 Russia
7.3.6.2 Bulgaria
7.3.6.3 The Czech Republic
7.3.6.4 Hungary
7.3.6.5 Poland
7.3.6.6 Romania
7.3.6.7 Rest of Eastern Europe
7.4. Western Europe Cranberry Extract Market
7.4.1 Key Market Trends, Growth Factors and Opportunities
7.4.2 Top Key Companies
7.4.3 Historic and Forecasted Market Size by Segments
7.4.4 Historic and Forecasted Market Size by Type
7.4.4.1 Liquid
7.4.4.2 Dried
7.4.4.3 Powder
7.4.5 Historic and Forecasted Market Size by Application
7.4.5.1 Food and Beverages
7.4.5.2 Pharmaceuticals
7.4.5.3 Nutraceuticals
7.4.5.4 Confectionary
7.4.5.5 Personal Care
7.4.5.6 Beauty Products
7.4.5.7 Others
7.4.6 Historic and Forecast Market Size by Country
7.4.6.1 Germany
7.4.6.2 UK
7.4.6.3 France
7.4.6.4 The Netherlands
7.4.6.5 Italy
7.4.6.6 Spain
7.4.6.7 Rest of Western Europe
7.5. Asia Pacific Cranberry Extract Market
7.5.1 Key Market Trends, Growth Factors and Opportunities
7.5.2 Top Key Companies
7.5.3 Historic and Forecasted Market Size by Segments
7.5.4 Historic and Forecasted Market Size by Type
7.5.4.1 Liquid
7.5.4.2 Dried
7.5.4.3 Powder
7.5.5 Historic and Forecasted Market Size by Application
7.5.5.1 Food and Beverages
7.5.5.2 Pharmaceuticals
7.5.5.3 Nutraceuticals
7.5.5.4 Confectionary
7.5.5.5 Personal Care
7.5.5.6 Beauty Products
7.5.5.7 Others
7.5.6 Historic and Forecast Market Size by Country
7.5.6.1 China
7.5.6.2 India
7.5.6.3 Japan
7.5.6.4 South Korea
7.5.6.5 Malaysia
7.5.6.6 Thailand
7.5.6.7 Vietnam
7.5.6.8 The Philippines
7.5.6.9 Australia
7.5.6.10 New Zealand
7.5.6.11 Rest of APAC
7.6. Middle East & Africa Cranberry Extract Market
7.6.1 Key Market Trends, Growth Factors and Opportunities
7.6.2 Top Key Companies
7.6.3 Historic and Forecasted Market Size by Segments
7.6.4 Historic and Forecasted Market Size by Type
7.6.4.1 Liquid
7.6.4.2 Dried
7.6.4.3 Powder
7.6.5 Historic and Forecasted Market Size by Application
7.6.5.1 Food and Beverages
7.6.5.2 Pharmaceuticals
7.6.5.3 Nutraceuticals
7.6.5.4 Confectionary
7.6.5.5 Personal Care
7.6.5.6 Beauty Products
7.6.5.7 Others
7.6.6 Historic and Forecast Market Size by Country
7.6.6.1 Turkiye
7.6.6.2 Bahrain
7.6.6.3 Kuwait
7.6.6.4 Saudi Arabia
7.6.6.5 Qatar
7.6.6.6 UAE
7.6.6.7 Israel
7.6.6.8 South Africa
7.7. South America Cranberry Extract Market
7.7.1 Key Market Trends, Growth Factors and Opportunities
7.7.2 Top Key Companies
7.7.3 Historic and Forecasted Market Size by Segments
7.7.4 Historic and Forecasted Market Size by Type
7.7.4.1 Liquid
7.7.4.2 Dried
7.7.4.3 Powder
7.7.5 Historic and Forecasted Market Size by Application
7.7.5.1 Food and Beverages
7.7.5.2 Pharmaceuticals
7.7.5.3 Nutraceuticals
7.7.5.4 Confectionary
7.7.5.5 Personal Care
7.7.5.6 Beauty Products
7.7.5.7 Others
7.7.6 Historic and Forecast Market Size by Country
7.7.6.1 Brazil
7.7.6.2 Argentina
7.7.6.3 Rest of SA
Chapter 8 Analyst Viewpoint and Conclusion
8.1 Recommendations and Concluding Analysis
8.2 Potential Market Strategies
Chapter 9 Research Methodology
9.1 Research Process
9.2 Primary Research
9.3 Secondary Research
|
Global Cranberry Extract Market |
|||
|
Base Year: |
2024 |
Forecast Period: |
2025-2032 |
|
Historical Data: |
2018 to 2023 |
Market Size in 2024: |
USD 115.81 Mn. |
|
Forecast Period 2025-32 CAGR: |
3.4 % |
Market Size in 2032: |
USD 151.32 Mn. |
|
Segments Covered: |
By Type |
|
|
|
By Application |
|
||
|
By Region |
|
||
|
Key Market Drivers: |
|
||
|
Key Market Restraints: |
|
||
|
Key Opportunities: |
|
||
|
Companies Covered in the report: |
|
||


