


Connected Retail Market Synopsis
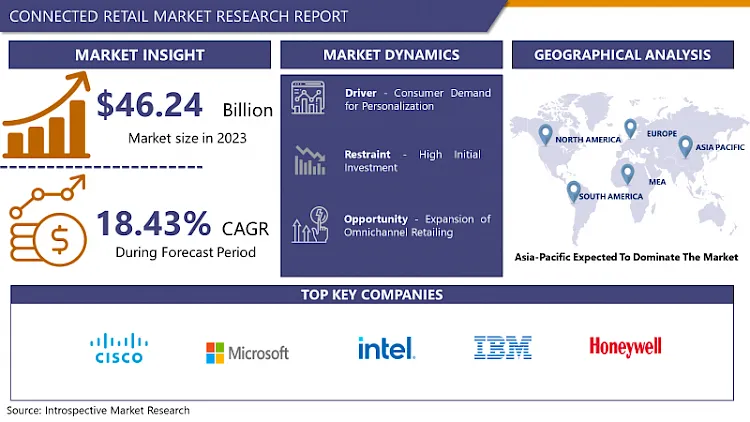
Connected Retail Market Size Was Valued at USD 54.77 Billion in 2024, and is Projected to Reach USD 211.91 Billion by 2032, Growing at a CAGR of 18.43% From 2025-2032.
The connected retail market refers to a dynamic sector within the retail industry where physical and digital shopping experiences are seamlessly integrated using advanced technologies. This integration leverages Internet of Things (IoT) devices, data analytics, mobile applications, and cloud computing to enhance customer engagement, streamline operations, and provide a personalized, omnichannel shopping experience. By connecting in-store and online platforms, retailers can offer real-time inventory updates, targeted marketing, and efficient customer service, ultimately driving sales and improving customer satisfaction. The connected retail market embodies the convergence of traditional retail practices with innovative digital solutions to meet the evolving demands of consumers.
The connected retail market is another market that is advancing rapidly due to the impact of technology that is reinventing the conventional Retail business. Web of things, being an advanced form of technologies like IoT, AI and big data analytics is improving customer’s purchasing experience along with improving the supply chain management systems. Many retailers have started adopting these technologies as tools to offer customer-centric experiences, reduce business costs, and optimize inventory. Some of the benefits include real-time and precise tracking of products and or customers’ interactions to help in stock and or marketing strategies improvement based on the determination of customer preferences from their interactions with IoT devices.
The competition shifts to the intensified consumer expectations due to convenience and instant delivery by e-commerce firms. Hence, this change is forcing the traditional retailers to look for newer solutions and proactively implementing connected retail solutions to survive. Retailers have made it their business model to integrate physical shopping with online and virtual in what is referred to as omnichannel shopping. This not only serves the needs of the customer, but also gives the retailer valuable feedback that can be used to add more possible ways to attract more consumers.
The effects of Covid-19 inspired organisations to expand their connected retail industry in response to the lockdowns and social distancing. Thus, self-checkout kiosks, contactless payments, pickup and delivery services without contact, virtual fitting rooms became more common due to increasing concern for safety and convenience. This meant that those retailers who opted for the technologies had an added advantage owing to the fact that they were possibly better placed to weather the shocks readily occasioned by the pandemic and or the shift in consumerism.
Future outlook for the connected retail is promising as it has been in this current year. Some of the advancements that are expected to develop the shopping experience even more are Augmented Reality (AR) and Virtual Reality (VR), consumer engaging and exciting technologies that will physically allow customers to touch the products. Also, innovations within AI promise improved understanding of consumer tastes trends, further refining of targeting and individualization. Thus, the connected retail remains a work in progress that the digital marketplace will continually undergo changes as technology advances forcing progressive retailers to capitalize on the opportunity to post higher efficiency and sales figures.

Connected Retail Market Trend Analysis
The Impact of AI and Machine Learning on the Connected Retail Market
- One of the more pressing issues affecting the cont, connected retail market today is how to harness AI and machine learning across different areas of the retailers’ operations. These technologies are swiftly changing the way business enterprises selling goods on the market communicates with its valued clients. AI can understand patterns of buyers’ behavior based on the available data, which can be used to recommend separate items to every single buyer. This level of personalization also finds its expression in marketing at this level such that Promotion activities such as the use of adverts and coupons can be designed specifically to appeal to users at this level. Also, with use of materials such as artificial neural networks, price optimization can be achieved through use of real time market data to optimize on sales to customers and competitors.
- Away from personalization, AI and machine learning are also making their ways into inventory management, and customer relations. It also showed how through the use of AI, retailers can better understand demand forecasting, and stock keeping issues such as overstock and stock outs, and supply chain issues. This particular characteristic is especially useful in dealing with fluctuations and particular cycles, such as with the changing of seasons or at certain unknown periods in the marketplace. Concerning efficiency, robotic and self-service options such as AI-powered chatbots and virtual or voice assistants are increasingly effective and multifunctional by empowered to perform a broad range of customer inquiries, orders and service requests 24/7. These virtual agents do contribute in creating a positive image towards consumers through a timely response as well as relieving human agents from handling minor questions that can easily be answered. In conclusion, it can observed that the application of the AI and machine learning in retailing is increasing the productivity and effectiveness of the processes, better customer experience, and therefore a better Return on Investment.
The Rise of Omnichannel Retailing and Immersive Technologies in the Connected Retail Market
- Another key factor that is emerging to transform the connected retail market is the growing popularity of omnichannel retailing which refers to a concept that supports supply chain operations between channel and store interfaces for all channels to appear as seamless and synchronized to the customer. This approach meets the current generation consumer’s expectation whereby they are able to cover a one stop shopping where they are able to physically engage with products and physically shop through visits to actual stores, engage in virtual shopping whereby they shop over the internet using the company’s website, or even through mobile app shopping whereby they shop using their mobile devices. It has now become the norm to see retailers spending their resources in doing any everything possible to deliver a consistent brand experience where customers can get a path that commenced on one touch point to end on another completely different touch point. For instance, concepts like, click-and-collect, a service that allows customers to buy products online and collect them in physical stores or returning products bought online in physical stores have become normative services that increase the ease with which customer can shop.
- Augmented realities and virtual reality technologies are playing a great role in augmenting the Omnichannel retail concept, thereby making a blend between online and retail shopping experiences. AR applications can assist customers in identifying how they can integrate a certain product into their requirements by displaying the product in their environment before actually getting it such as using a smartphone application to see an appearance of a particular piece of furniture in living room or glasses on their face. By enhancing the attendance of the messages, this entertaining and stimulating method minimizes uncertainty and raises comfort levels concerning the purchasing choices. On the same note VR provides customers with a true-to-life digital simulation of a store visit which saves their time and energy allowing them to explore products to their convenience. They not only bring convenience for consumers while shopping but also offer the retailer numerous opportunities for understanding customers while improving the marketing-related and operational strategies. Consequently, the incorporation of both AR and VR into omnibuye retailing is enhancing engaged, customized, and proficient shopping experiences that meet the contemporary customer requirements.
Connected Retail Market Segment Analysis:
Connected Retail Market is Segmented based on Component and Technology
By Component, Hardware segment is expected to dominate the market during the forecast period
- As widely recognized, there is nothing more crucial to IoT than hardware – this all-pervasive piece commands a lion’s share of the business and assumes the strategic importance that defines the overall system. To its core, hardware defines the physical next nature of IoT as it comprises a broad range of items such as sensors, actuators, connectors, etc. These elements act as the feelers and brain of IoT networks whereby they facilitate an efficient flow of information or commands between entities and the surrounding ambiance. Right from the concept of smart home applications such as the smart thermostat to the world of industrial applications like smart factories, the essential core is in the hardware in IoT.
- The constant demand for the Internet of Things solutions in industrial automation, healthcare service delivery, electronics among other is propelling the never-ending growth of the hardware. Companies interested in making their operations more efficient to achieve better results use IoT hardware to expand the use of intellectural analytics in their sphere. Likewise, the buyers remain fixated on smart things that are valued for the comfort, convenience, and the opportunity to save energy. This coming together of the industrialist requirement and the consumer expectations puts hardware at a commanding position in the IoT Market. However, as the IoT expands and becomes more diverse, it becomes vital to acknowledge the importance of the dependable and suitable hardware solutions which stand as the foundation of IoT development.
By Technology, NFC segment held the largest share
- NFC technology, even though it occupies a less extensive class of functions in contrast with other systems of wireless communication, possesses the largest percentages in precise fields because it is radically more effective in some activities. First of all, there is a sphere of contactless payment systems, where NFC has been established as the industry standard. These include and are not limited to; They offer a smooth and secure transaction processing, which involves making a tap using the right compatible device or card on the payment terminals. The simplicity that comes with using NFC coupled with effective measures including tokenization and encryption definitely fosters high levels of acceptance of NFC payment solutions by individuals and business across the world. The popularity of the m-commerce is growing steadily, and thus, despite the abundance of different possibilities for cashless payments, NFC remains the leader in the important and rapidly developing sector of contactless payment methods.
- Using NFC is predominantly scalable in access control because of its inherent safety – the primary purpose of the technology is identification and authentication. Whether as a smart door lock for hotels and corporate offices, or as an identification card in an organization, NFC technology helps to facilitate or control access to a premise. Again, it is very easy and convenient to simply place your card, or your smartphone with NFC solution for easy access, on the SF Reader to gain entry while the secure codes that protect information guarantee secure authentication. Concerning the access control security and organizational efficiency, NFC has a tendency to remain the leading technology in these areas and dominate the market, making it the preferred short-range communication technology in access management.
Connected Retail Market Regional Insights:
Asia-Pacific is Expected to Dominate the Market Over the Forecast period
- With the premise that the Asia-Pacific region of connected retail is becoming shaped anew, one must acknowledge that several important aspects are converging to fuel this change. High on this list is the exponential advancement in digital economy as a key driver across the region. China, Japan and South Korea have led this evolution due to sound and advanced online backbone over the supporting connected retail schemes as a growing consumer base utilizing advanced technologies such as the internet. This digitalization is not only confined, however, to large metropolitan areas but is also rapidly spreading throughout the suburbs and even rural tracts creating new opportunities for retailers to tap into new markets of diverse customers.
- Furthermore, continuously rising the middle-class populace along with the purchasing power of the consumers within Anglo Asia-Pacific regions has been a driving force for connected retail technologies. That is because today’s consumers care about the quality of the products and services they buy, therefore, omnichannel retailing is the answer to the dilemma of meeting the customer on the internet then physically selling to him. This has been a shot-in-the-arm for smart retail activities across the region, with firms concentrating on the adoption of digital technologies such as Smart checkout, RFID, and AI for analysis to improve operational parameter and for delivery of personalized service to the customers. After explaining the consequent steps, Swank points out that ‘’retail innovation in stores without cashiers, based on artificial intelligence’ in China, Japan, and South Korea has increased due to the high competitiveness of the market.
Active Key Players in the Connected Retail Market
- Cisco Systems Inc.
- Microsoft Corporation
- Intel Corporation
- IBM Corporation
- Honeywell International Inc.
- Other Active Players
Key Industry Developments in the Connected Retail Market:
- In November 2022, Tesco, a major retail service provider, announced the expansion of its GetGo cashless stores to more locations in London and Birmingham. The expansion enables customers to shop without scanning products or using a checkout while offering self-service and attended checkout options.
|
Global Connected Retail Market |
|||
|
Base Year: |
2024 |
Forecast Period: |
2025-2032 |
|
Historical Data: |
2018 to 2023 |
Market Size in 2025: |
USD 54.77 Bn. |
|
Forecast Period 202-32 CAGR: |
18.43% |
Market Size in 2032: |
USD 211.94 Bn. |
|
Segments Covered: |
By Component |
|
|
|
By Technology |
|
||
|
By Region |
|
||
|
Key Market Drivers: |
|
||
|
Key Market Restraints: |
|
||
|
Key Opportunities: |
|
||
|
Companies Covered in the report: |
|
||
Chapter 1: Introduction
1.1 Scope and Coverage
Chapter 2:Executive Summary
Chapter 3: Market Landscape
3.1 Market Dynamics
3.1.1 Drivers
3.1.2 Restraints
3.1.3 Opportunities
3.1.4 Challenges
3.2 Market Trend Analysis
3.3 PESTLE Analysis
3.4 Porter's Five Forces Analysis
3.5 Industry Value Chain Analysis
3.6 Ecosystem
3.7 Regulatory Landscape
3.8 Price Trend Analysis
3.9 Patent Analysis
3.10 Technology Evolution
3.11 Investment Pockets
3.12 Import-Export Analysis
Chapter 4: Connected Retail Market by Component (2018-2032)
4.1 Connected Retail Market Snapshot and Growth Engine
4.2 Market Overview
4.3 Hardware
4.3.1 Introduction and Market Overview
4.3.2 Historic and Forecasted Market Size in Value USD and Volume Units
4.3.3 Key Market Trends, Growth Factors, and Opportunities
4.3.4 Geographic Segmentation Analysis
4.4 Software
4.5 Service
Chapter 5: Connected Retail Market by Technology (2018-2032)
5.1 Connected Retail Market Snapshot and Growth Engine
5.2 Market Overview
5.3 ZigBee
5.3.1 Introduction and Market Overview
5.3.2 Historic and Forecasted Market Size in Value USD and Volume Units
5.3.3 Key Market Trends, Growth Factors, and Opportunities
5.3.4 Geographic Segmentation Analysis
5.4 NFC
5.5 Bluetooth Low Energy
5.6 Wi-Fi
5.7 Other Technologies
Chapter 6: Company Profiles and Competitive Analysis
6.1 Competitive Landscape
6.1.1 Competitive Benchmarking
6.1.2 Connected Retail Market Share by Manufacturer (2024)
6.1.3 Industry BCG Matrix
6.1.4 Heat Map Analysis
6.1.5 Mergers and Acquisitions
6.2 KIMICA
6.2.1 Company Overview
6.2.2 Key Executives
6.2.3 Company Snapshot
6.2.4 Role of the Company in the Market
6.2.5 Sustainability and Social Responsibility
6.2.6 Operating Business Segments
6.2.7 Product Portfolio
6.2.8 Business Performance
6.2.9 Key Strategic Moves and Recent Developments
6.2.10 SWOT Analysis
6.3 IRO ALGINATE INDUSTRY CO LTD
6.4 CEAMSA ALGAE
6.5 SNAP NATURAL & ALGINATE PRODUCT PVT. LTD
6.6 ALGAIA
6.7 MARINE BIOPOLYMERS LIMITED (MBL)
6.8 DUPONT DE NEMOURS INC
6.9 INGREDIENTS SOLUTIONS INC
6.10 SHANDONG JIEJING GROUP CORPORATION
6.11 OTHER KEY PLAYERS
6.12
Chapter 7: Global Connected Retail Market By Region
7.1 Overview
7.2. North America Connected Retail Market
7.2.1 Key Market Trends, Growth Factors and Opportunities
7.2.2 Top Key Companies
7.2.3 Historic and Forecasted Market Size by Segments
7.2.4 Historic and Forecasted Market Size by Component
7.2.4.1 Hardware
7.2.4.2 Software
7.2.4.3 Service
7.2.5 Historic and Forecasted Market Size by Technology
7.2.5.1 ZigBee
7.2.5.2 NFC
7.2.5.3 Bluetooth Low Energy
7.2.5.4 Wi-Fi
7.2.5.5 Other Technologies
7.2.6 Historic and Forecast Market Size by Country
7.2.6.1 US
7.2.6.2 Canada
7.2.6.3 Mexico
7.3. Eastern Europe Connected Retail Market
7.3.1 Key Market Trends, Growth Factors and Opportunities
7.3.2 Top Key Companies
7.3.3 Historic and Forecasted Market Size by Segments
7.3.4 Historic and Forecasted Market Size by Component
7.3.4.1 Hardware
7.3.4.2 Software
7.3.4.3 Service
7.3.5 Historic and Forecasted Market Size by Technology
7.3.5.1 ZigBee
7.3.5.2 NFC
7.3.5.3 Bluetooth Low Energy
7.3.5.4 Wi-Fi
7.3.5.5 Other Technologies
7.3.6 Historic and Forecast Market Size by Country
7.3.6.1 Russia
7.3.6.2 Bulgaria
7.3.6.3 The Czech Republic
7.3.6.4 Hungary
7.3.6.5 Poland
7.3.6.6 Romania
7.3.6.7 Rest of Eastern Europe
7.4. Western Europe Connected Retail Market
7.4.1 Key Market Trends, Growth Factors and Opportunities
7.4.2 Top Key Companies
7.4.3 Historic and Forecasted Market Size by Segments
7.4.4 Historic and Forecasted Market Size by Component
7.4.4.1 Hardware
7.4.4.2 Software
7.4.4.3 Service
7.4.5 Historic and Forecasted Market Size by Technology
7.4.5.1 ZigBee
7.4.5.2 NFC
7.4.5.3 Bluetooth Low Energy
7.4.5.4 Wi-Fi
7.4.5.5 Other Technologies
7.4.6 Historic and Forecast Market Size by Country
7.4.6.1 Germany
7.4.6.2 UK
7.4.6.3 France
7.4.6.4 The Netherlands
7.4.6.5 Italy
7.4.6.6 Spain
7.4.6.7 Rest of Western Europe
7.5. Asia Pacific Connected Retail Market
7.5.1 Key Market Trends, Growth Factors and Opportunities
7.5.2 Top Key Companies
7.5.3 Historic and Forecasted Market Size by Segments
7.5.4 Historic and Forecasted Market Size by Component
7.5.4.1 Hardware
7.5.4.2 Software
7.5.4.3 Service
7.5.5 Historic and Forecasted Market Size by Technology
7.5.5.1 ZigBee
7.5.5.2 NFC
7.5.5.3 Bluetooth Low Energy
7.5.5.4 Wi-Fi
7.5.5.5 Other Technologies
7.5.6 Historic and Forecast Market Size by Country
7.5.6.1 China
7.5.6.2 India
7.5.6.3 Japan
7.5.6.4 South Korea
7.5.6.5 Malaysia
7.5.6.6 Thailand
7.5.6.7 Vietnam
7.5.6.8 The Philippines
7.5.6.9 Australia
7.5.6.10 New Zealand
7.5.6.11 Rest of APAC
7.6. Middle East & Africa Connected Retail Market
7.6.1 Key Market Trends, Growth Factors and Opportunities
7.6.2 Top Key Companies
7.6.3 Historic and Forecasted Market Size by Segments
7.6.4 Historic and Forecasted Market Size by Component
7.6.4.1 Hardware
7.6.4.2 Software
7.6.4.3 Service
7.6.5 Historic and Forecasted Market Size by Technology
7.6.5.1 ZigBee
7.6.5.2 NFC
7.6.5.3 Bluetooth Low Energy
7.6.5.4 Wi-Fi
7.6.5.5 Other Technologies
7.6.6 Historic and Forecast Market Size by Country
7.6.6.1 Turkiye
7.6.6.2 Bahrain
7.6.6.3 Kuwait
7.6.6.4 Saudi Arabia
7.6.6.5 Qatar
7.6.6.6 UAE
7.6.6.7 Israel
7.6.6.8 South Africa
7.7. South America Connected Retail Market
7.7.1 Key Market Trends, Growth Factors and Opportunities
7.7.2 Top Key Companies
7.7.3 Historic and Forecasted Market Size by Segments
7.7.4 Historic and Forecasted Market Size by Component
7.7.4.1 Hardware
7.7.4.2 Software
7.7.4.3 Service
7.7.5 Historic and Forecasted Market Size by Technology
7.7.5.1 ZigBee
7.7.5.2 NFC
7.7.5.3 Bluetooth Low Energy
7.7.5.4 Wi-Fi
7.7.5.5 Other Technologies
7.7.6 Historic and Forecast Market Size by Country
7.7.6.1 Brazil
7.7.6.2 Argentina
7.7.6.3 Rest of SA
Chapter 8 Analyst Viewpoint and Conclusion
8.1 Recommendations and Concluding Analysis
8.2 Potential Market Strategies
Chapter 9 Research Methodology
9.1 Research Process
9.2 Primary Research
9.3 Secondary Research
|
Global Connected Retail Market |
|||
|
Base Year: |
2024 |
Forecast Period: |
2025-2032 |
|
Historical Data: |
2018 to 2023 |
Market Size in 2025: |
USD 54.77 Bn. |
|
Forecast Period 202-32 CAGR: |
18.43% |
Market Size in 2032: |
USD 211.94 Bn. |
|
Segments Covered: |
By Component |
|
|
|
By Technology |
|
||
|
By Region |
|
||
|
Key Market Drivers: |
|
||
|
Key Market Restraints: |
|
||
|
Key Opportunities: |
|
||
|
Companies Covered in the report: |
|
||


