


Global Concentrated Solar Power Market Overview
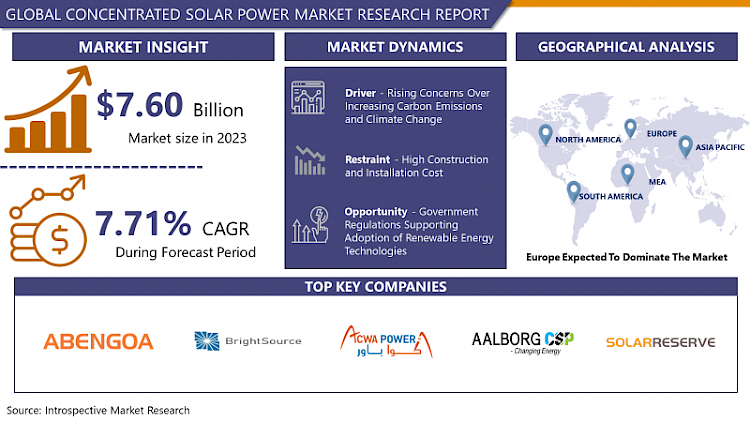
Global Concentrated Solar Power Market was valued at USD 7.60 billion in 2023 and is expected to reach USD 14.83 billion by the year 2032, at a CAGR of 7.71%
CSP technology uses mirrors to reflect sunlight and focus on the receiver. The concentrated solar energy heats the hot liquid in the receiver from heat is heat generated, also known as thermal energy, which can be used to turn turbines and drive engines to generate electricity. It can also be used in a variety of industrial applications, including Water desalination, improved oil recovery, food processing, chemical production, and mineral processing. Concentrated Solar Power plants are typically used for power plant projects. These utility-scale CSP systems can be configured in different ways. The electric pylon system places a mirror around the central tower that acts as a receiver. The linear system has a row of mirrors that focus sunlight on a parallel tube receiver placed on top of it. Small CSP systems can be placed directly where power is needed. For example, a single bowl-motor system can generate 5-25 kW of power per bowl and can be used in distributed applications. Growing need of clean energy is expected to boost the Concentrated Solar Pawer Market.
Market Dynamics And Factors For Solar Power Market
Drivers:
Demand for clean energy has grown significantly as leading developed countries pledged to reduce carbon emission to meet the goals of the zero-carbon economies. Solar energy outperforms biomass energy and is a major source of renewable energy, leading to investments in countries such as India, the United States, China, and Italy to install and generate electricity using solar power. The US market grew in 2019 as it supported government regulations and initiatives such as All concentrating solar projects recently built in the United States are funded by the US Department of Energy's Loan Guarantee Program (DOE). The global CSP market is expected to grow rapidly over the forecast period due to the need to reduce CO2 emissions in the troposphere. Photovoltaic power generation is used as an inexpensive power source, helping to reduce energy costs and carbon dioxide emissions. The SP is a highly capital-intensive technology. The components used in the parabolic trough are the power unit, solar field, heat transfer system, and thermal energy storage. The main components used in a solar tower are the receiver field, heliostat field, thermal energy storage, tower, and power block. The LCOE of a CSP plant is dependent on the project reserve cost. This is about four-fifths of the total cost. The rest are facility operation, maintenance, and insurance costs, which pose a to be costly.
Restraints:
Concentration Solar Power projects involve massive construction and installation. Concentration Solar Power requires customized and large high-performance equipment such as parabolic U mirrors, linear concentrator system, Heat transfer fluid tubes, steam turbines, and large open space which carries enormous construction and maintenance costs. Concentration Solar Power Projects are generally established with government supports and big conglomerates in the energy sector. Government grants and supports such as the U.S. Department of Energy are funding CSP research projects under its SunShot Initiative to drive down the cost of solar electricity and support solar adoption. Although Concentration Solar Power provides a clean energy alternative, high construction and installation cost restricts the entry for small players and developing countries.
Opportunities:
CSP has a significant competitive advantage over other renewable energies. As renewable energies that cannot be provided become more widespread, the grid becomes less flexible and the need for systems that can separate weather-dependent power generation from demand increases. Expansion of CSP systems with heat storage systems opens up new business opportunities for CSPs with TES to provide such services to network operators. If the power generation cost of a solar or onshore wind power plant includes an additional storage system with a large battery, this is because the heat storage of the CSP system has already been incorporated, so the power production cost of TES.
CSPs can be used to power the industry and process heat. In many industries, the manufacturing process requires a massive amount of heat. Current solar heat generators for industrial processes are concentrated in low to medium-temperature industries up to 400 ° C. Typical processes suitable for solar heat integration are drying, cleaning, fermentation, and steam generation of food or products. The high-temperature solar system paves the way for the use of concentrating solar heat (CSH), high-temperature industrial processes, or the preheating stage of high-temperature processes.
Challenges:
Concentration Solar Power projects require large disposable land at a remote location according to the spread of sunlight in the region. Availability of suitable land is a major challenge for the Concentrated Solar Power Market. Open space with a substantial amount of sunlight with installation space for parabolic panels and turbine installation area which need to be close by the panels. Also, energy storage facilities, as well as transportation, are a key factor for the concentrated Solar Power Market. Also, Thermal to electric technologies are insufficient to handle a heavy surge of electricity which can damage the equipment, Small steam turbines reduce efficiency, and Routinely start and shut down process reduces the lifespan of equipment and machinery. Moreover, Thermal turbines required heavy water usage which can lead to excessive water consumption.
Market Segmentation
Segmentation Analysis of Concentrated Solar Power Market:
By Technology, Parabolic Trough is dominating the Concentrated Solar Power Market. Parabolic Trough is a widely used technology in the Concentrated Solar Power Market. More than 80% of CSP plants use Parabolic Trough due to the low cost and currently the cheapest source. Parabolic troughs produce very high temperatures suitable for steam production. The heat storage in the insulation tank can supply electricity at night. Solar power is expensive and parabolic troughs with cheaper mirrors can cover more areas with minimal cost and high efficiency in the operation. The Power Tower is also widely used technology mainly in the United States. Power Tower provides economically valuable products, improved designs, and many other supports during the planning period. Installation power is expected to increase further. Power tower technology on the market is widely used, especially in countries where land is available. This is because a large area is a standard for installing a power tower.
By Operation Type, Standalone systems are dominating in the Concentrated Solar Power Market. Standalone systems are set up without the storage capacity of excess electricity. Mainly Concentrated Solar Power plants produce and transfer the power via high tension cables to nearby locations. Direct energy dispensing can save the additional cost of storage infrastructure and maintaining inventory costs in power stations. Most of the previously built power plants are based on standalone systems. As storage capacity infrastructure technology evolved, new generation storage enables the low cost of infrastructure set up and maximum storage capacity which are being integrated into new CSP plants. New business opportunity for thermal energy storage opens the doors for new entrants to provide high-end energy storage options to such power plants. Therefore, it reflects on the overall growth of the Concentrated Solar Power Market.
By Capacity, 100 MW above is dominating in the Concentrated Solar Power Market. There is an increasing need to focus on PV technology to meet renewable energy production and ongoing operational goals and create a market of 100 MW or more during the forecast period. There are around 50+ mega capacity 100 MW above plants are operational in Spain, South Africa, Morocco, China, India, Egypt, USA, and UAE. Projects like Noor Ouarzazate I, II, and III (510 megawatts) [MW] CSP), Noor Midelt (800 MW CSP-PV hybrid) in Morocco, Cerro Dominador (110 MW CSP) in Chile are among the highest dispensing energy plants which drive the growth of the Concentrated Solar Power Market globally.
By End User, Residential is the dominating segment in the Concentrated Solar Power Market. CSP projects are generally built at remote locations with ample open land and access to direct sunlight. Concentrated Solar Power projects generate around 50 – 800 MW of electricity which is transported to nearby towns and communities. Clean energy created a positive environmental impact and creates social value among local communities. CSP use in industrial applications is yet to be picked up due to high and constant demand from industries which can be a challenging factor for solar projects to provide at dusky weather. Hence Residential application is boosting the growth of the Concentrated Solar Power Market.
Regional Analysis of Concentrated Solar Power Market:
The European region is the dominating in the Concentrated Solar Power Market. According to the World Bank Report on CSP – clean power of demand, Spain contributes majorly in the European region in terms of operational Concentrated Solar Power plants. Spain occupies around 45 operational concentrated solar power plants with an averagely of 50 MW capacity which contributes majorly in terms of providing clean energy in most of Spain reducing energy cost and zero-emission. A Spanish project partner advised the government by providing scientific support for Spain's CSP expansion policy. Specifically, CIEMAT advised on the development of the energy planning tool TIMES- SINERGIA, which was used to develop the National Energy and Climate Program (NECP), and the incorporation of CSP technology. In addition, MUSTEC partner CSIC was requested by the government to advise on the design of renewable energy auctions, including special considerations for switchable power sources such as CSP. Therefore, healthy government and private player relationship and looking at the success of Spain, many European countries like Netherlands, Germany, France, and Belgium are investing in the development of such projects which is anticipated to boost the Concentrated Solar Power Market in European Region.
The Asia Pacific is one of the fastest-growing region Concentrated Solar Power Market. China is expected to grow significantly from 2020 to 2027. This is primarily due to increased investment in concentrating solar energy to ease network locations, which is driving the market. In addition, the need to continuously generate renewable energy to support tax increases is driving market growth in the region. India and China have more than 20 operational CSP plants with an average capacity of 50 MW. The growing need is of clean energy pushed the government to act on such projects boosting the market in Asia pacific.
North America also presents the bight opportunity for the Concentrated Solar Power Market as mega collar projects are being set up in the United States and Mexico. North America is having 14 high-capacity concentrated solar power plants with a capacity of more than 200 MW. Morocco, UAE, and SOUTH Africa are the fastest adopting countries of Concentrated Solar Power which is expected to boost the Concentrated Solar Power Market globally.
Players Covered in Concentrated Solar Power Market are:
- Abengoa
- BrightSource Energy
- ACWA Power
- Aalborg CSP
- and SolarReserve
- TSK Flagsol Engineering GmbH
- Alsolen
- Cobra Energia
- Torresol Energy
- Acciona Energy
- eSolar
- Enel Green Power
Key Industry Developments In Concentrated Solar Power Market
- May 2021, ACWA Power has led South Africa's largest renewable energy project Redstone CSP to a financial close which ensures 1.6 billion Redstone concentrated solar power (CSP) plant will power 200,000 households upon completion of a Commercial operation planned to start in Q4 2023.
- In May 2020, Abengoa formed a consortium with Acciona to build the Cerro Dominador solar thermal plant owned by EIG Global Energy Partners. The consortium has led the melting process of 46,000 tons of salts from the Chilean Atacama Desert having a capacity of 110 MW.
|
Global Concentrated Solar Power Market |
|||
|
Base Year: |
2023 |
Forecast Period: |
2024-2032 |
|
Historical Data: |
2016 to 2022 |
Market Size in 2023: |
USD 7.60 Bn. |
|
Forecast Period 2024-32 CAGR: |
7.71% |
Market Size in 2032: |
USD 14.83 Bn. |
|
Segments Covered: |
By Technology |
|
|
|
By Operation Type |
|
||
|
By Capacity |
|
||
|
By End-Users |
|
||
|
By Region |
|
||
|
Key Market Drivers: |
|
||
|
Key Market Restraints: |
|
||
|
Key Opportunities: |
|
||
|
Companies Covered in the report: |
|
||
Chapter 1: Introduction
1.1 Research Objectives
1.2 Research Methodology
1.3 Research Process
1.4 Scope and Coverage
1.4.1 Market Definition
1.4.2 Key Questions Answered
1.5 Market Segmentation
Chapter 2:Executive Summary
Chapter 3:Growth Opportunities By Segment
3.1 By Technology
3.2 By Operation Type
3.3 By Capacity
3.4 By End-User
Chapter 4: Market Landscape
4.1 Porter's Five Forces Analysis
4.1.1 Bargaining Power of Supplier
4.1.2 Threat of New Entrants
4.1.3 Threat of Substitutes
4.1.4 Competitive Rivalry
4.1.5 Bargaining Power Among Buyers
4.2 Industry Value Chain Analysis
4.3 Market Dynamics
4.3.1 Drivers
4.3.2 Restraints
4.3.3 Opportunities
4.5.4 Challenges
4.4 Pestle Analysis
4.5 Technological Roadmap
4.6 Regulatory Landscape
4.7 SWOT Analysis
4.8 Price Trend Analysis
4.9 Patent Analysis
4.10 Analysis of the Impact of Covid-19
4.10.1 Impact on the Overall Market
4.10.2 Impact on the Supply Chain
4.10.3 Impact on the Key Manufacturers
4.10.4 Impact on the Pricing
Chapter 5: Concentrated Solar Power Market by Technology
5.1 Concentrated Solar Power Market Overview Snapshot and Growth Engine
5.2 Concentrated Solar Power Market Overview
5.3 Solar Power Tower
5.3.1 Introduction and Market Overview
5.3.2 Historic and Forecasted Market Size (2016-2028F)
5.3.3 Key Market Trends, Growth Factors and Opportunities
5.3.4 Solar Power Tower: Grographic Segmentation
5.4 Linear Concentrating Systems
5.4.1 Introduction and Market Overview
5.4.2 Historic and Forecasted Market Size (2016-2028F)
5.4.3 Key Market Trends, Growth Factors and Opportunities
5.4.4 Linear Concentrating Systems: Grographic Segmentation
5.5 Stirling Dish Technology
5.5.1 Introduction and Market Overview
5.5.2 Historic and Forecasted Market Size (2016-2028F)
5.5.3 Key Market Trends, Growth Factors and Opportunities
5.5.4 Stirling Dish Technology: Grographic Segmentation
Chapter 6: Concentrated Solar Power Market by Operation Type
6.1 Concentrated Solar Power Market Overview Snapshot and Growth Engine
6.2 Concentrated Solar Power Market Overview
6.3 Stand-Alone Systems
6.3.1 Introduction and Market Overview
6.3.2 Historic and Forecasted Market Size (2016-2028F)
6.3.3 Key Market Trends, Growth Factors and Opportunities
6.3.4 Stand-Alone Systems: Grographic Segmentation
6.4 With Storage
6.4.1 Introduction and Market Overview
6.4.2 Historic and Forecasted Market Size (2016-2028F)
6.4.3 Key Market Trends, Growth Factors and Opportunities
6.4.4 With Storage: Grographic Segmentation
Chapter 7: Concentrated Solar Power Market by Capacity
7.1 Concentrated Solar Power Market Overview Snapshot and Growth Engine
7.2 Concentrated Solar Power Market Overview
7.3 Less Than 50 Mw
7.3.1 Introduction and Market Overview
7.3.2 Historic and Forecasted Market Size (2016-2028F)
7.3.3 Key Market Trends, Growth Factors and Opportunities
7.3.4 Less Than 50 Mw: Grographic Segmentation
7.4 50 Mw To 99 Mw
7.4.1 Introduction and Market Overview
7.4.2 Historic and Forecasted Market Size (2016-2028F)
7.4.3 Key Market Trends, Growth Factors and Opportunities
7.4.4 50 Mw To 99 Mw: Grographic Segmentation
7.5 100 Mw & Above
7.5.1 Introduction and Market Overview
7.5.2 Historic and Forecasted Market Size (2016-2028F)
7.5.3 Key Market Trends, Growth Factors and Opportunities
7.5.4 100 Mw & Above: Grographic Segmentation
Chapter 8: Concentrated Solar Power Market by End-User
8.1 Concentrated Solar Power Market Overview Snapshot and Growth Engine
8.2 Concentrated Solar Power Market Overview
8.3 Residential
8.3.1 Introduction and Market Overview
8.3.2 Historic and Forecasted Market Size (2016-2028F)
8.3.3 Key Market Trends, Growth Factors and Opportunities
8.3.4 Residential: Grographic Segmentation
8.4 Industrial
8.4.1 Introduction and Market Overview
8.4.2 Historic and Forecasted Market Size (2016-2028F)
8.4.3 Key Market Trends, Growth Factors and Opportunities
8.4.4 Industrial: Grographic Segmentation
Chapter 9: Company Profiles and Competitive Analysis
9.1 Competitive Landscape
9.1.1 Competitive Positioning
9.1.2 Concentrated Solar Power Sales and Market Share By Players
9.1.3 Industry BCG Matrix
9.1.4 Ansoff Matrix
9.1.5 Concentrated Solar Power Industry Concentration Ratio (CR5 and HHI)
9.1.6 Top 5 Concentrated Solar Power Players Market Share
9.1.7 Mergers and Acquisitions
9.1.8 Business Strategies By Top Players
9.2 ABENGOA
9.2.1 Company Overview
9.2.2 Key Executives
9.2.3 Company Snapshot
9.2.4 Operating Business Segments
9.2.5 Product Portfolio
9.2.6 Business Performance
9.2.7 Key Strategic Moves and Recent Developments
9.2.8 SWOT Analysis
9.3 BRIGHTSOURCE ENERGY
9.4 ACWA POWER
9.5 AALBORG CSP
9.6 SOLARRESERVE
9.7 TSK FLAGSOL ENGINEERING GMBH
9.8 ALSOLEN
9.9 COBRA ENERGIA
9.10 TORRESOL ENERGY
9.11 ACCIONA ENERGY
9.12 ESOLAR
9.13 ENEL GREEN POWER
9.14 OTHER MAJOR PLAYERS
Chapter 10: Global Concentrated Solar Power Market Analysis, Insights and Forecast, 2016-2028
10.1 Market Overview
10.2 Historic and Forecasted Market Size By Technology
10.2.1 Solar Power Tower
10.2.2 Linear Concentrating Systems
10.2.3 Stirling Dish Technology
10.3 Historic and Forecasted Market Size By Operation Type
10.3.1 Stand-Alone Systems
10.3.2 With Storage
10.4 Historic and Forecasted Market Size By Capacity
10.4.1 Less Than 50 Mw
10.4.2 50 Mw To 99 Mw
10.4.3 100 Mw & Above
10.5 Historic and Forecasted Market Size By End-User
10.5.1 Residential
10.5.2 Industrial
Chapter 11: North America Concentrated Solar Power Market Analysis, Insights and Forecast, 2016-2028
11.1 Key Market Trends, Growth Factors and Opportunities
11.2 Impact of Covid-19
11.3 Key Players
11.4 Key Market Trends, Growth Factors and Opportunities
11.4 Historic and Forecasted Market Size By Technology
11.4.1 Solar Power Tower
11.4.2 Linear Concentrating Systems
11.4.3 Stirling Dish Technology
11.5 Historic and Forecasted Market Size By Operation Type
11.5.1 Stand-Alone Systems
11.5.2 With Storage
11.6 Historic and Forecasted Market Size By Capacity
11.6.1 Less Than 50 Mw
11.6.2 50 Mw To 99 Mw
11.6.3 100 Mw & Above
11.7 Historic and Forecasted Market Size By End-User
11.7.1 Residential
11.7.2 Industrial
11.8 Historic and Forecast Market Size by Country
11.8.1 U.S.
11.8.2 Canada
11.8.3 Mexico
Chapter 12: Europe Concentrated Solar Power Market Analysis, Insights and Forecast, 2016-2028
12.1 Key Market Trends, Growth Factors and Opportunities
12.2 Impact of Covid-19
12.3 Key Players
12.4 Key Market Trends, Growth Factors and Opportunities
12.4 Historic and Forecasted Market Size By Technology
12.4.1 Solar Power Tower
12.4.2 Linear Concentrating Systems
12.4.3 Stirling Dish Technology
12.5 Historic and Forecasted Market Size By Operation Type
12.5.1 Stand-Alone Systems
12.5.2 With Storage
12.6 Historic and Forecasted Market Size By Capacity
12.6.1 Less Than 50 Mw
12.6.2 50 Mw To 99 Mw
12.6.3 100 Mw & Above
12.7 Historic and Forecasted Market Size By End-User
12.7.1 Residential
12.7.2 Industrial
12.8 Historic and Forecast Market Size by Country
12.8.1 Germany
12.8.2 U.K.
12.8.3 France
12.8.4 Italy
12.8.5 Russia
12.8.6 Spain
12.8.7 Rest of Europe
Chapter 13: Asia-Pacific Concentrated Solar Power Market Analysis, Insights and Forecast, 2016-2028
13.1 Key Market Trends, Growth Factors and Opportunities
13.2 Impact of Covid-19
13.3 Key Players
13.4 Key Market Trends, Growth Factors and Opportunities
13.4 Historic and Forecasted Market Size By Technology
13.4.1 Solar Power Tower
13.4.2 Linear Concentrating Systems
13.4.3 Stirling Dish Technology
13.5 Historic and Forecasted Market Size By Operation Type
13.5.1 Stand-Alone Systems
13.5.2 With Storage
13.6 Historic and Forecasted Market Size By Capacity
13.6.1 Less Than 50 Mw
13.6.2 50 Mw To 99 Mw
13.6.3 100 Mw & Above
13.7 Historic and Forecasted Market Size By End-User
13.7.1 Residential
13.7.2 Industrial
13.8 Historic and Forecast Market Size by Country
13.8.1 China
13.8.2 India
13.8.3 Japan
13.8.4 Singapore
13.8.5 Australia
13.8.6 New Zealand
13.8.7 Rest of APAC
Chapter 14: Middle East & Africa Concentrated Solar Power Market Analysis, Insights and Forecast, 2016-2028
14.1 Key Market Trends, Growth Factors and Opportunities
14.2 Impact of Covid-19
14.3 Key Players
14.4 Key Market Trends, Growth Factors and Opportunities
14.4 Historic and Forecasted Market Size By Technology
14.4.1 Solar Power Tower
14.4.2 Linear Concentrating Systems
14.4.3 Stirling Dish Technology
14.5 Historic and Forecasted Market Size By Operation Type
14.5.1 Stand-Alone Systems
14.5.2 With Storage
14.6 Historic and Forecasted Market Size By Capacity
14.6.1 Less Than 50 Mw
14.6.2 50 Mw To 99 Mw
14.6.3 100 Mw & Above
14.7 Historic and Forecasted Market Size By End-User
14.7.1 Residential
14.7.2 Industrial
14.8 Historic and Forecast Market Size by Country
14.8.1 Turkey
14.8.2 Saudi Arabia
14.8.3 Iran
14.8.4 UAE
14.8.5 Africa
14.8.6 Rest of MEA
Chapter 15: South America Concentrated Solar Power Market Analysis, Insights and Forecast, 2016-2028
15.1 Key Market Trends, Growth Factors and Opportunities
15.2 Impact of Covid-19
15.3 Key Players
15.4 Key Market Trends, Growth Factors and Opportunities
15.4 Historic and Forecasted Market Size By Technology
15.4.1 Solar Power Tower
15.4.2 Linear Concentrating Systems
15.4.3 Stirling Dish Technology
15.5 Historic and Forecasted Market Size By Operation Type
15.5.1 Stand-Alone Systems
15.5.2 With Storage
15.6 Historic and Forecasted Market Size By Capacity
15.6.1 Less Than 50 Mw
15.6.2 50 Mw To 99 Mw
15.6.3 100 Mw & Above
15.7 Historic and Forecasted Market Size By End-User
15.7.1 Residential
15.7.2 Industrial
15.8 Historic and Forecast Market Size by Country
15.8.1 Brazil
15.8.2 Argentina
15.8.3 Rest of SA
Chapter 16 Investment Analysis
Chapter 17 Analyst Viewpoint and Conclusion
|
Global Concentrated Solar Power Market |
|||
|
Base Year: |
2023 |
Forecast Period: |
2024-2032 |
|
Historical Data: |
2016 to 2022 |
Market Size in 2023: |
USD 7.60 Bn. |
|
Forecast Period 2024-32 CAGR: |
7.71% |
Market Size in 2032: |
USD 14.83 Bn. |
|
Segments Covered: |
By Technology |
|
|
|
By Operation Type |
|
||
|
By Capacity |
|
||
|
By End-Users |
|
||
|
By Region |
|
||
|
Key Market Drivers: |
|
||
|
Key Market Restraints: |
|
||
|
Key Opportunities: |
|
||
|
Companies Covered in the report: |
|
||
LIST OF TABLES
TABLE 001. EXECUTIVE SUMMARY
TABLE 002. CONCENTRATED SOLAR POWER MARKET BARGAINING POWER OF SUPPLIERS
TABLE 003. CONCENTRATED SOLAR POWER MARKET BARGAINING POWER OF CUSTOMERS
TABLE 004. CONCENTRATED SOLAR POWER MARKET COMPETITIVE RIVALRY
TABLE 005. CONCENTRATED SOLAR POWER MARKET THREAT OF NEW ENTRANTS
TABLE 006. CONCENTRATED SOLAR POWER MARKET THREAT OF SUBSTITUTES
TABLE 007. CONCENTRATED SOLAR POWER MARKET BY TECHNOLOGY
TABLE 008. SOLAR POWER TOWER MARKET OVERVIEW (2016-2028)
TABLE 009. LINEAR CONCENTRATING SYSTEMS MARKET OVERVIEW (2016-2028)
TABLE 010. STIRLING DISH TECHNOLOGY MARKET OVERVIEW (2016-2028)
TABLE 011. CONCENTRATED SOLAR POWER MARKET BY OPERATION TYPE
TABLE 012. STAND-ALONE SYSTEMS MARKET OVERVIEW (2016-2028)
TABLE 013. WITH STORAGE MARKET OVERVIEW (2016-2028)
TABLE 014. CONCENTRATED SOLAR POWER MARKET BY CAPACITY
TABLE 015. LESS THAN 50 MW MARKET OVERVIEW (2016-2028)
TABLE 016. 50 MW TO 99 MW MARKET OVERVIEW (2016-2028)
TABLE 017. 100 MW & ABOVE MARKET OVERVIEW (2016-2028)
TABLE 018. CONCENTRATED SOLAR POWER MARKET BY END-USER
TABLE 019. RESIDENTIAL MARKET OVERVIEW (2016-2028)
TABLE 020. INDUSTRIAL MARKET OVERVIEW (2016-2028)
TABLE 021. NORTH AMERICA CONCENTRATED SOLAR POWER MARKET, BY TECHNOLOGY (2016-2028)
TABLE 022. NORTH AMERICA CONCENTRATED SOLAR POWER MARKET, BY OPERATION TYPE (2016-2028)
TABLE 023. NORTH AMERICA CONCENTRATED SOLAR POWER MARKET, BY CAPACITY (2016-2028)
TABLE 024. NORTH AMERICA CONCENTRATED SOLAR POWER MARKET, BY END-USER (2016-2028)
TABLE 025. N CONCENTRATED SOLAR POWER MARKET, BY COUNTRY (2016-2028)
TABLE 026. EUROPE CONCENTRATED SOLAR POWER MARKET, BY TECHNOLOGY (2016-2028)
TABLE 027. EUROPE CONCENTRATED SOLAR POWER MARKET, BY OPERATION TYPE (2016-2028)
TABLE 028. EUROPE CONCENTRATED SOLAR POWER MARKET, BY CAPACITY (2016-2028)
TABLE 029. EUROPE CONCENTRATED SOLAR POWER MARKET, BY END-USER (2016-2028)
TABLE 030. CONCENTRATED SOLAR POWER MARKET, BY COUNTRY (2016-2028)
TABLE 031. ASIA PACIFIC CONCENTRATED SOLAR POWER MARKET, BY TECHNOLOGY (2016-2028)
TABLE 032. ASIA PACIFIC CONCENTRATED SOLAR POWER MARKET, BY OPERATION TYPE (2016-2028)
TABLE 033. ASIA PACIFIC CONCENTRATED SOLAR POWER MARKET, BY CAPACITY (2016-2028)
TABLE 034. ASIA PACIFIC CONCENTRATED SOLAR POWER MARKET, BY END-USER (2016-2028)
TABLE 035. CONCENTRATED SOLAR POWER MARKET, BY COUNTRY (2016-2028)
TABLE 036. MIDDLE EAST & AFRICA CONCENTRATED SOLAR POWER MARKET, BY TECHNOLOGY (2016-2028)
TABLE 037. MIDDLE EAST & AFRICA CONCENTRATED SOLAR POWER MARKET, BY OPERATION TYPE (2016-2028)
TABLE 038. MIDDLE EAST & AFRICA CONCENTRATED SOLAR POWER MARKET, BY CAPACITY (2016-2028)
TABLE 039. MIDDLE EAST & AFRICA CONCENTRATED SOLAR POWER MARKET, BY END-USER (2016-2028)
TABLE 040. CONCENTRATED SOLAR POWER MARKET, BY COUNTRY (2016-2028)
TABLE 041. SOUTH AMERICA CONCENTRATED SOLAR POWER MARKET, BY TECHNOLOGY (2016-2028)
TABLE 042. SOUTH AMERICA CONCENTRATED SOLAR POWER MARKET, BY OPERATION TYPE (2016-2028)
TABLE 043. SOUTH AMERICA CONCENTRATED SOLAR POWER MARKET, BY CAPACITY (2016-2028)
TABLE 044. SOUTH AMERICA CONCENTRATED SOLAR POWER MARKET, BY END-USER (2016-2028)
TABLE 045. CONCENTRATED SOLAR POWER MARKET, BY COUNTRY (2016-2028)
TABLE 046. ABENGOA: SNAPSHOT
TABLE 047. ABENGOA: BUSINESS PERFORMANCE
TABLE 048. ABENGOA: PRODUCT PORTFOLIO
TABLE 049. ABENGOA: KEY STRATEGIC MOVES AND DEVELOPMENTS
TABLE 049. BRIGHTSOURCE ENERGY: SNAPSHOT
TABLE 050. BRIGHTSOURCE ENERGY: BUSINESS PERFORMANCE
TABLE 051. BRIGHTSOURCE ENERGY: PRODUCT PORTFOLIO
TABLE 052. BRIGHTSOURCE ENERGY: KEY STRATEGIC MOVES AND DEVELOPMENTS
TABLE 052. ACWA POWER: SNAPSHOT
TABLE 053. ACWA POWER: BUSINESS PERFORMANCE
TABLE 054. ACWA POWER: PRODUCT PORTFOLIO
TABLE 055. ACWA POWER: KEY STRATEGIC MOVES AND DEVELOPMENTS
TABLE 055. AALBORG CSP: SNAPSHOT
TABLE 056. AALBORG CSP: BUSINESS PERFORMANCE
TABLE 057. AALBORG CSP: PRODUCT PORTFOLIO
TABLE 058. AALBORG CSP: KEY STRATEGIC MOVES AND DEVELOPMENTS
TABLE 058. SOLARRESERVE: SNAPSHOT
TABLE 059. SOLARRESERVE: BUSINESS PERFORMANCE
TABLE 060. SOLARRESERVE: PRODUCT PORTFOLIO
TABLE 061. SOLARRESERVE: KEY STRATEGIC MOVES AND DEVELOPMENTS
TABLE 061. TSK FLAGSOL ENGINEERING GMBH: SNAPSHOT
TABLE 062. TSK FLAGSOL ENGINEERING GMBH: BUSINESS PERFORMANCE
TABLE 063. TSK FLAGSOL ENGINEERING GMBH: PRODUCT PORTFOLIO
TABLE 064. TSK FLAGSOL ENGINEERING GMBH: KEY STRATEGIC MOVES AND DEVELOPMENTS
TABLE 064. ALSOLEN: SNAPSHOT
TABLE 065. ALSOLEN: BUSINESS PERFORMANCE
TABLE 066. ALSOLEN: PRODUCT PORTFOLIO
TABLE 067. ALSOLEN: KEY STRATEGIC MOVES AND DEVELOPMENTS
TABLE 067. COBRA ENERGIA: SNAPSHOT
TABLE 068. COBRA ENERGIA: BUSINESS PERFORMANCE
TABLE 069. COBRA ENERGIA: PRODUCT PORTFOLIO
TABLE 070. COBRA ENERGIA: KEY STRATEGIC MOVES AND DEVELOPMENTS
TABLE 070. TORRESOL ENERGY: SNAPSHOT
TABLE 071. TORRESOL ENERGY: BUSINESS PERFORMANCE
TABLE 072. TORRESOL ENERGY: PRODUCT PORTFOLIO
TABLE 073. TORRESOL ENERGY: KEY STRATEGIC MOVES AND DEVELOPMENTS
TABLE 073. ACCIONA ENERGY: SNAPSHOT
TABLE 074. ACCIONA ENERGY: BUSINESS PERFORMANCE
TABLE 075. ACCIONA ENERGY: PRODUCT PORTFOLIO
TABLE 076. ACCIONA ENERGY: KEY STRATEGIC MOVES AND DEVELOPMENTS
TABLE 076. ESOLAR: SNAPSHOT
TABLE 077. ESOLAR: BUSINESS PERFORMANCE
TABLE 078. ESOLAR: PRODUCT PORTFOLIO
TABLE 079. ESOLAR: KEY STRATEGIC MOVES AND DEVELOPMENTS
TABLE 079. ENEL GREEN POWER: SNAPSHOT
TABLE 080. ENEL GREEN POWER: BUSINESS PERFORMANCE
TABLE 081. ENEL GREEN POWER: PRODUCT PORTFOLIO
TABLE 082. ENEL GREEN POWER: KEY STRATEGIC MOVES AND DEVELOPMENTS
TABLE 082. OTHER MAJOR PLAYERS: SNAPSHOT
TABLE 083. OTHER MAJOR PLAYERS: BUSINESS PERFORMANCE
TABLE 084. OTHER MAJOR PLAYERS: PRODUCT PORTFOLIO
TABLE 085. OTHER MAJOR PLAYERS: KEY STRATEGIC MOVES AND DEVELOPMENTS
LIST OF FIGURES
FIGURE 001. YEARS CONSIDERED FOR ANALYSIS
FIGURE 002. SCOPE OF THE STUDY
FIGURE 003. CONCENTRATED SOLAR POWER MARKET OVERVIEW BY REGIONS
FIGURE 004. PORTER'S FIVE FORCES ANALYSIS
FIGURE 005. BARGAINING POWER OF SUPPLIERS
FIGURE 006. COMPETITIVE RIVALRYFIGURE 007. THREAT OF NEW ENTRANTS
FIGURE 008. THREAT OF SUBSTITUTES
FIGURE 009. VALUE CHAIN ANALYSIS
FIGURE 010. PESTLE ANALYSIS
FIGURE 011. CONCENTRATED SOLAR POWER MARKET OVERVIEW BY TECHNOLOGY
FIGURE 012. SOLAR POWER TOWER MARKET OVERVIEW (2016-2028)
FIGURE 013. LINEAR CONCENTRATING SYSTEMS MARKET OVERVIEW (2016-2028)
FIGURE 014. STIRLING DISH TECHNOLOGY MARKET OVERVIEW (2016-2028)
FIGURE 015. CONCENTRATED SOLAR POWER MARKET OVERVIEW BY OPERATION TYPE
FIGURE 016. STAND-ALONE SYSTEMS MARKET OVERVIEW (2016-2028)
FIGURE 017. WITH STORAGE MARKET OVERVIEW (2016-2028)
FIGURE 018. CONCENTRATED SOLAR POWER MARKET OVERVIEW BY CAPACITY
FIGURE 019. LESS THAN 50 MW MARKET OVERVIEW (2016-2028)
FIGURE 020. 50 MW TO 99 MW MARKET OVERVIEW (2016-2028)
FIGURE 021. 100 MW & ABOVE MARKET OVERVIEW (2016-2028)
FIGURE 022. CONCENTRATED SOLAR POWER MARKET OVERVIEW BY END-USER
FIGURE 023. RESIDENTIAL MARKET OVERVIEW (2016-2028)
FIGURE 024. INDUSTRIAL MARKET OVERVIEW (2016-2028)
FIGURE 025. NORTH AMERICA CONCENTRATED SOLAR POWER MARKET OVERVIEW BY COUNTRY (2016-2028)
FIGURE 026. EUROPE CONCENTRATED SOLAR POWER MARKET OVERVIEW BY COUNTRY (2016-2028)
FIGURE 027. ASIA PACIFIC CONCENTRATED SOLAR POWER MARKET OVERVIEW BY COUNTRY (2016-2028)
FIGURE 028. MIDDLE EAST & AFRICA CONCENTRATED SOLAR POWER MARKET OVERVIEW BY COUNTRY (2016-2028)
FIGURE 029. SOUTH AMERICA CONCENTRATED SOLAR POWER MARKET OVERVIEW BY COUNTRY (2016-2028)
Frequently Asked Questions :
The forecast period in the Concentrated Solar Power Market research report is 2024-2032.
Abengoa, BrightSource Energy, ACWA Power, Aalborg CSP, SolarReserve, TSK Flagsol Engineering GmbH, Alsolen, Cobra Energia, Torresol Energy, Acciona Energy, eSolar, Enel Green Power, and other major players.
The Concentrated Solar Power Market is segmented into Technology, Operation Type, Capacity, End-Users, and region. By Technology, the market is categorized into Solar Power Tower, Linear Concentrating Systems, and Stirling Dish Technology. By Operation Type, the market is categorized into Stand-Alone Systems, With Storage. By Capacity, the market is categorized into Less Than 50 Mw, 50 Mw To 99 Mw, 100 Mw, & Above. By End-Users, the market is categorized into Residential, Industrial. By region, it is analyzed across North America (U.S.; Canada; Mexico), Europe (Germany; U.K.; France; Italy; Russia; Spain, etc.), Asia-Pacific (China; India; Japan; Southeast Asia, etc.), South America (Brazil; Argentina, etc.), Middle East & Africa (Saudi Arabia; South Africa, etc.).
CSP technology uses mirrors to reflect sunlight and focus on the receiver. The concentrated solar energy heats the hot liquid in the receiver from heat is heat generated, also known as thermal energy, which can be used to turn turbines and drive engines to generate electricity.
Global Concentrated Solar Power Market was valued at USD 7.60 billion in 2023 and is expected to reach USD 14.83 billion by the year 2032, at a CAGR of 7.71%


