


Cluster Computing Market Synopsis
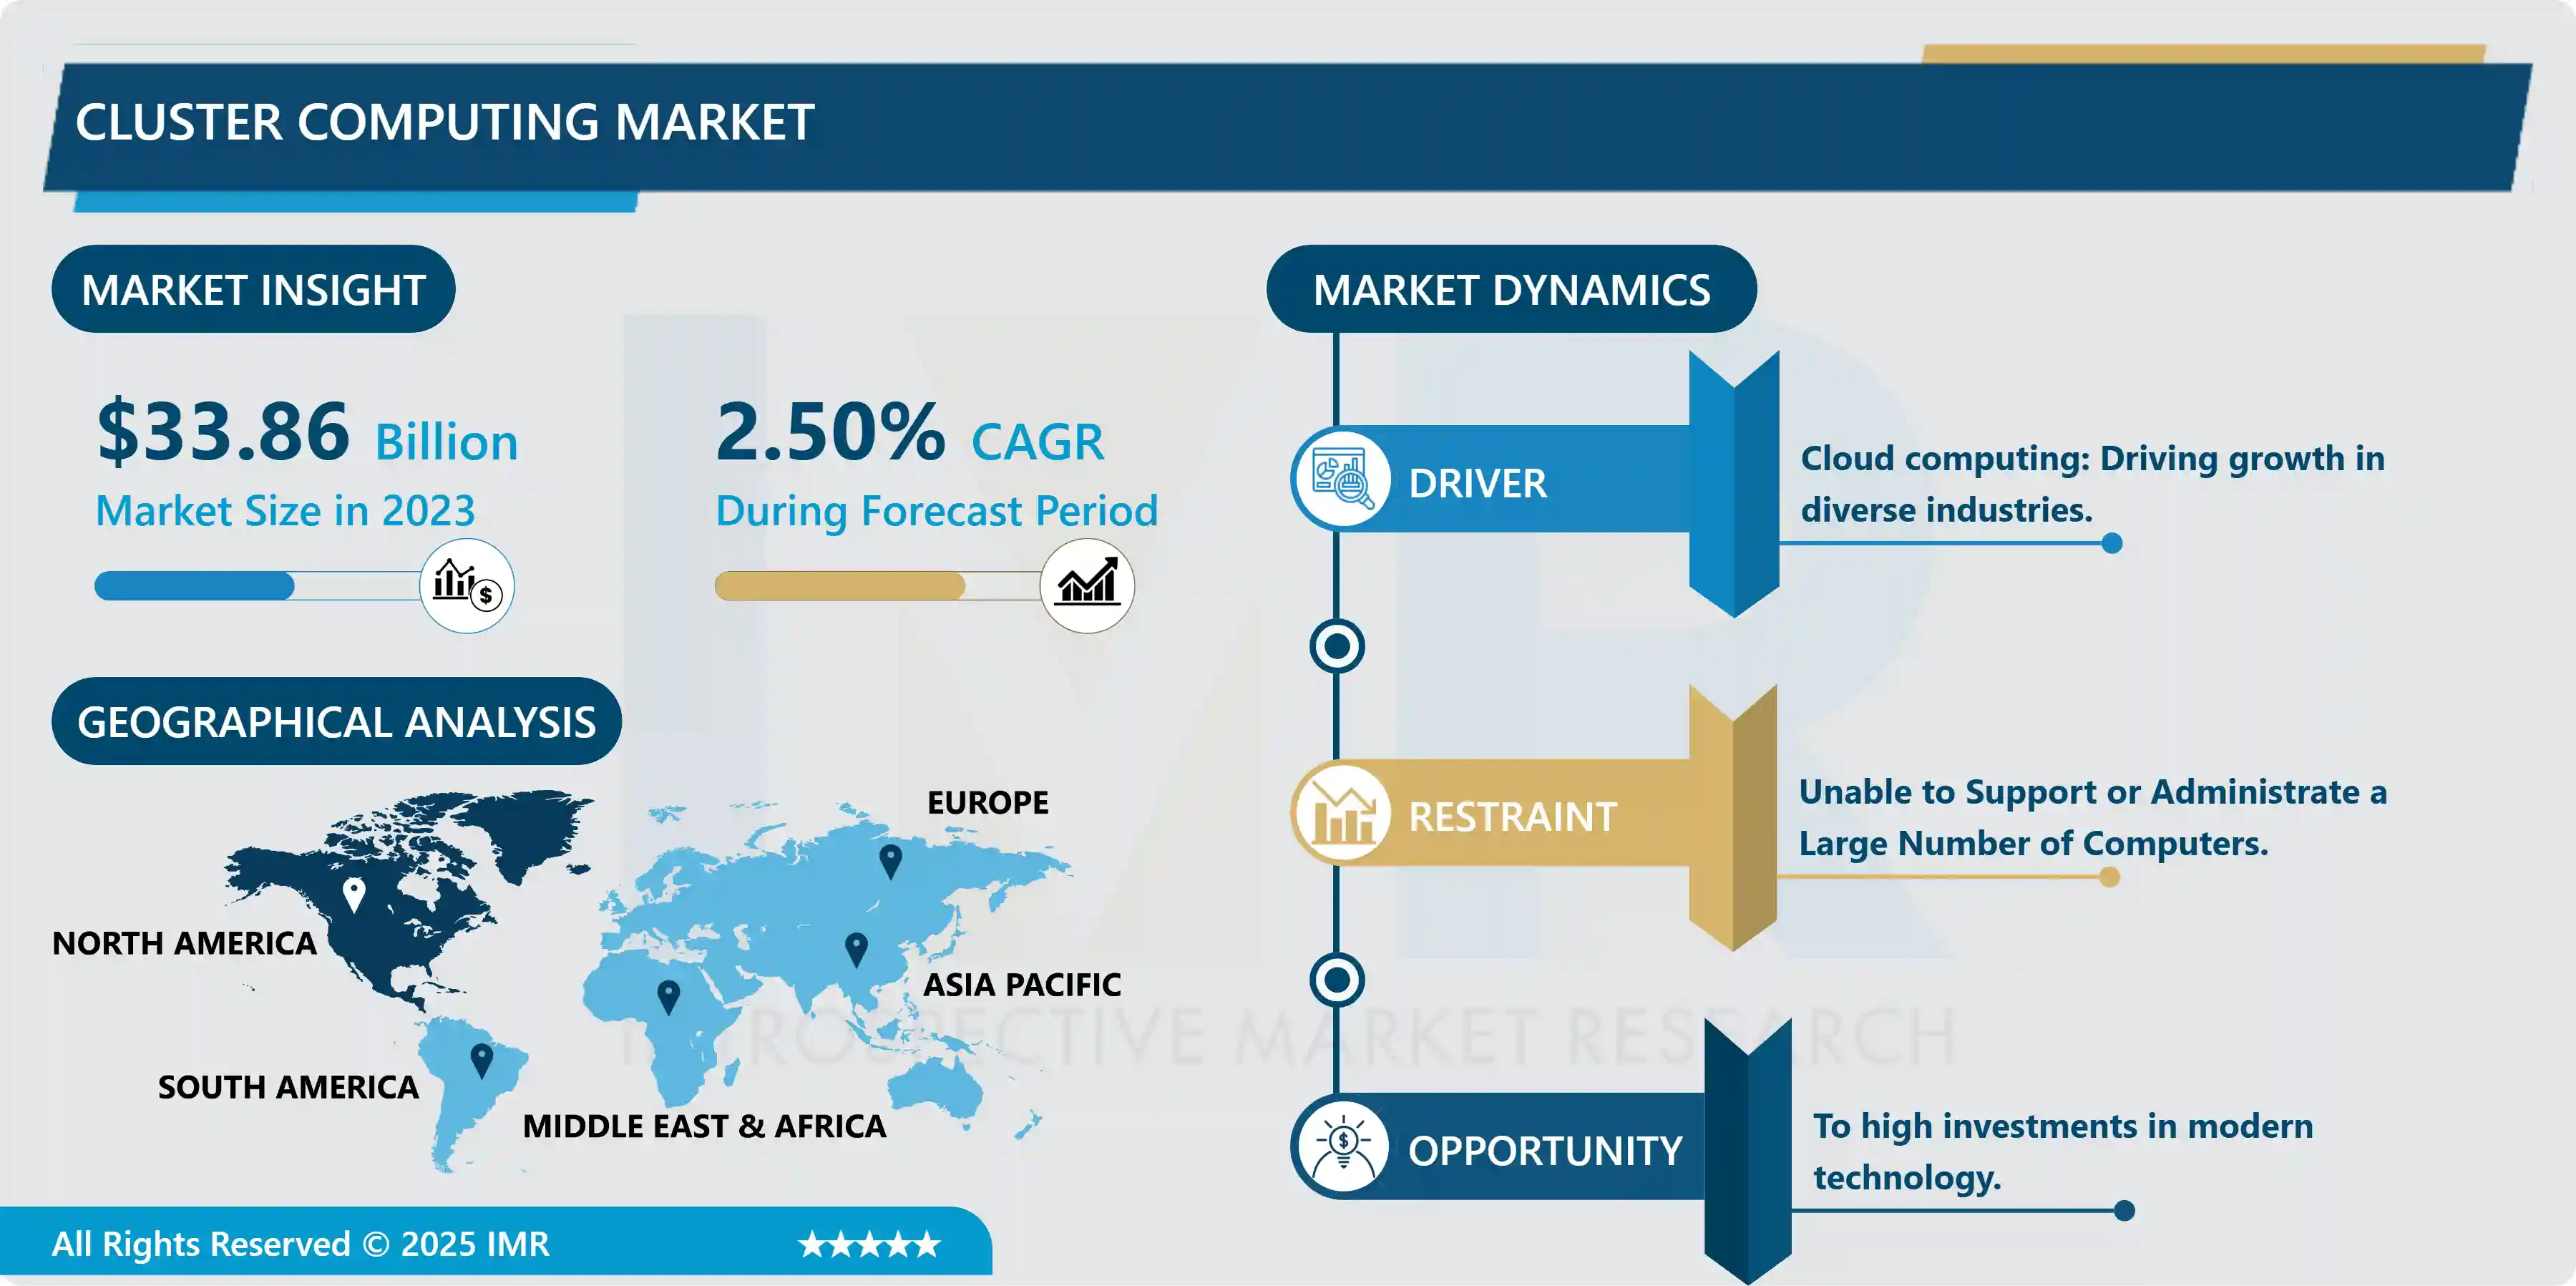
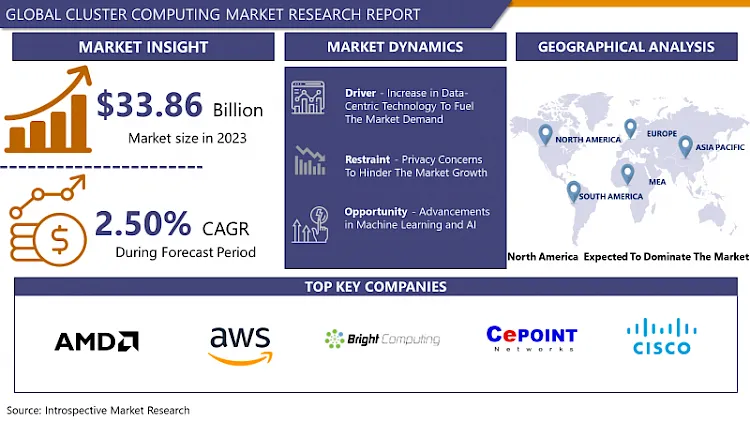
Cluster Computing Market Size is Valued at USD 33.86 Billion in 2023, and is Projected to Reach USD 41.26 Billion by 2032, Growing at a CAGR of 2.50% From 2024-2032.
Solutions for parallel processing of computers connected over the network and further co-working on a particular task; Cluster Computer market. Due to the fact that it uses multiple machines compared to one machine for a certain task; this method is faster than the other one and also has greater scalability and fault tolerance. One of the main drivers is the need for high-performance computing in areas such as healthcare and finance, but fears of complex and expensive HPC systems are another major driver. Nevertheless, there are certain factors that may hinder the market growth in the near future, but the growth prospects remain bright owing to increasing need of big data analytics and technological advancements.
The rapid market growth for cluster computing is mainly based on the demand for HPC infrastructure in a number of industries. Such deep complex processes to generate results have to be carried out by such industries with the processing capacity like the healthcare, finance, and science. It is then at this point where cluster computing comes in.
Another important driver is the growing use of big data analytics and cloud computing which do require effective and scalable computing approaches. It is possible to distribute data in a cluster computing to provide performance and scalability for data processing as well as for real-time analytics.
Technological advancements such as the high-speed networks and better processors are the major drivers behind growth of the cluster computing market. Such enhancements enable clusters to compute data faster as well as process growing workloads.
Additionally, cluster computing is on an increase as a result of increasing adoption of ML and AI applications. HPC systems are the right choice for the ML and AI application because of the heavy computing requirements for training and execution tasks.
Cluster Computing Market Trend Analysis
The Dual Modality of Clusters: Efficiency and Scalability.
-
There are certain trends in the cluster computing market that are driving its growth and industry development. Among these we can probably focus on cluster computing and especially on the use of cloud-based cluster computing solutions. Cluster computing services provide organizations access to high-performance computing in a way that is more economical than building and maintaining their own high-performance computing systems.
- Another trend has been the increased deployment of cluster computing in the fields of AI and ML. These technologies demand a lot of computational capacity and cluster computing is crucial in carrying out training enormous AI models and in running these systems.
- Moreover, a popular trend is the usage of middle environments – hybrid cluster computing environments, when some resources are hosted locally, on-premise, while others are hosted on the cloud. This enhances the way organizations make use of both environments to access some of the benefits that are obtained from on-premises resources or cloud resources such as the security and the control that one gets by using on premises resources as well as the innate scalability and the flexibility that cloud resources present.
- Cluster computing is also a fast-rising in the market due to better energy efficient and conservation efforts. The power consumption of cluster computing systems is high due to the continuous processing of tasks in the system so that designing energy-efficient system and the importance of sustainable practices gain prominence in this field.
Promising Trends for the Cluster Computing Market
- A number of significant trends are fueling the growth of the cluster-computing market and it has significant opportunities. One of the main opportunities is the increasing demand for HPC systems in various sectors. The ultimate performance of industries such as health, finance, and science that are responsible for processing great amounts of metrics and running complex calculations requires the use of cluster computing, which ensures better clustering power and scalability.
- Another possibility who pose is the increasing application of big data analytics and cloud computing. The requirement for cluster computing for these applications is high because cluster computing has the capacity to provide a solution to these applications.
- New technology is emerging such as the introduction of high-speed networks; the fabrication of faster processors, and the expanding opportunities ushered in by cluster computing. These strategies are making computers and clusters efficient thus giving way to application of ways and means in solving problems.
- it is expected that the demand for the cluster computing technologies will be on the upswing since various organizations are expected to generate more and more volumes of data. This provides organisations the opportunity to develop and offer modern cluster-based computing products that meet the evolving requirements of customers within diverse industries.
Cluster Computing Market Segment Analysis:
Cluster Computing Market is Segmented on the basis of Deployment mode, By Cluster Type, and end-users.
By Cluster Type, Load Balancing segment is expected to dominate the market during the forecast period
- Types of cluster computing can be grouped into several classes based on the type and the architecture being used.
- Failover cluster systems are specifically designed to provide uninterrupted service to end-users by migrating the work load from a failure system to active one. This type is an important type for application of cluster services because it can work without interruption around business services.
- The Load Balancing clusters cluster involves providing an application with load balancing function across a number of nodes in order to use limited resources optimally. These clusters are necessary for applications that have different numbers of jobs to be processed by different nodes at each time to avoid one node bearing the entire load.
- High Availability and Load Balancing however present a scenario where both features are required in order to achieve maximum system uptime and at the same time maximize performance. This type of the cluster is suitable for critical applications that are so crucial that it cannot be unavailable.
- Complex computing situations where there exist measurable and parallelizable tasks can utilize Distributed and Parallel Processing clusters. These clusters are designed for and are able to deal with large data and particularly process it faster through the utilization of a number of nodes concurrently.
- Cluster type two and three have different advantages and are suitable for various applications; the ability of clusters to perform a wide range of computing tasks provides an excellent example of the versatility and scalability of cluster computing.
By Deployment Model, Cloud Based segment held the largest share in 2023
- Cluster computing deployment can be categorized into two main models: enterprises to web or on-premise.
- Cluster computing is the physical process of installing and operating a center of computing within an organization’s premises. This model gives the organizations full power over its computing resources and allows the organizations to set the cluster according to their needs. On-premises clusters are often targeted for sensitive data or mission/critical applications which need utmost security and regulatory compliance.
- Cluster computing deployment in this case is done through the use of cloud-based services for deployment and management of cluster computing. We have the scalability and flexibility of cloud which enable organizations to scale up or contract the use of computing resources. The cloud-based clusters are also economical in terms of money as they save the organization from the initial procurement of hardware and maintenance costs associated with them when using the cluster computing services.
- The two deployment models have both their merits and disadvantages and can be applied in the environments that demand for such models. Organizations may choose from on-premises use and/or cloud-based use to meet their respective field requirements. The decision for choosing either of the two is characterized by the level of security and susceptibility to cyberattacks required, the amount of money available and the application’s expandability and extensibility.
Cluster Computing Market Regional Insights:
North America is Expected to Dominate the Market Over the Forecast period
- IT/ICT research on the Cluster Computing Market in North American and the analysis of key players shows that the market is highly concentrated with leading players owning advanced technological tools, and a high level of R&D investments. The region is today one of the pioneer clusters in the uptake of such computational solutions across the IT and health and science sectors among other industries.
- The dominant country for the North American market is the United States due to the fact that it houses a majority of the major vendors of cluster computing services and other more advanced forms of computing solutions. Canada is also another country that is a big stakeholder in the market expansion with its increased investments in the supercomputing and the related HPC technologies.
- The market also sees an increase in the use of cluster computing technologies based on cloud-based interface as they try to be more scalable and flexible as well as cost efficient in the market. Furthermore, the market is also gaining traction due to the rising implementation of AI and ML technologies, which are areas that require a high-performance computing infrastructure, and this is also propelling the demand in North America.
Active Key Players in the Cluster Computing Market
- Advanced Micro Devices (USA)
- Amazon Web Services (USA)
- Bright Computing (USA)
- Cepoint Networks (USA)
- Cisco Systems (USA)
- Cray (USA)
- Dell (USA)
- Google (USA)
- Hewlett Packard (USA)
- IBM (USA)
- Intel (USA)
- Lenovo (China)
- Microsoft (USA)
- Nor-Tech (USA)
- Penguin Computing (USA)
- PSSC Labs (USA)
- RackMountPro (USA)
- Silicon Graphics International (SGI) (USA)
- TotalCAE (USA)
- Others
|
Global Cluster Computing Market |
|||
|
Base Year: |
2023 |
Forecast Period: |
2024-2032 |
|
Historical Data: |
2017 to 2023 |
Market Size in 2023: |
USD 33.86 Bn. |
|
Forecast Period 2023-30 CAGR: |
2.50% |
Market Size in 2032: |
USD 41.26 Bn. |
|
Segments Covered: |
By Deployment Model |
|
|
|
By Cluster Type |
|
||
|
By End-User |
|
||
|
By Region |
|
||
|
Key Market Drivers: |
|
||
|
Key Market Restraints: |
|
||
|
Key Opportunities: |
|
||
|
Companies Covered in the report: |
|
||
Chapter 1: Introduction
1.1 Scope and Coverage
Chapter 2:Executive Summary
Chapter 3: Market Landscape
3.1 Market Dynamics
3.1.1 Drivers
3.1.2 Restraints
3.1.3 Opportunities
3.1.4 Challenges
3.2 Market Trend Analysis
3.3 PESTLE Analysis
3.4 Porter's Five Forces Analysis
3.5 Industry Value Chain Analysis
3.6 Ecosystem
3.7 Regulatory Landscape
3.8 Price Trend Analysis
3.9 Patent Analysis
3.10 Technology Evolution
3.11 Investment Pockets
3.12 Import-Export Analysis
Chapter 4: Cluster Computing Market by Deployment Model (2018-2032)
4.1 Cluster Computing Market Snapshot and Growth Engine
4.2 Market Overview
4.3 On-Premises
4.3.1 Introduction and Market Overview
4.3.2 Historic and Forecasted Market Size in Value USD and Volume Units
4.3.3 Key Market Trends, Growth Factors, and Opportunities
4.3.4 Geographic Segmentation Analysis
4.4 Cloud Based
Chapter 5: Cluster Computing Market by Cluster Type (2018-2032)
5.1 Cluster Computing Market Snapshot and Growth Engine
5.2 Market Overview
5.3 High Availability (HA) and Failover
5.3.1 Introduction and Market Overview
5.3.2 Historic and Forecasted Market Size in Value USD and Volume Units
5.3.3 Key Market Trends, Growth Factors, and Opportunities
5.3.4 Geographic Segmentation Analysis
5.4 Load Balancing
5.5 HA & Load Balancing
5.6 Distributed & Parallel Processing
Chapter 6: Cluster Computing Market by End-User (2018-2032)
6.1 Cluster Computing Market Snapshot and Growth Engine
6.2 Market Overview
6.3 Life Science
6.3.1 Introduction and Market Overview
6.3.2 Historic and Forecasted Market Size in Value USD and Volume Units
6.3.3 Key Market Trends, Growth Factors, and Opportunities
6.3.4 Geographic Segmentation Analysis
6.4 Industrial Manufacturing
6.5 Banking
6.6 Defense
6.7 Gaming Industry
6.8 Retail
6.9 Others
Chapter 7: Company Profiles and Competitive Analysis
7.1 Competitive Landscape
7.1.1 Competitive Benchmarking
7.1.2 Cluster Computing Market Share by Manufacturer (2024)
7.1.3 Industry BCG Matrix
7.1.4 Heat Map Analysis
7.1.5 Mergers and Acquisitions
7.2 SALESFORCE (USA)
7.2.1 Company Overview
7.2.2 Key Executives
7.2.3 Company Snapshot
7.2.4 Role of the Company in the Market
7.2.5 Sustainability and Social Responsibility
7.2.6 Operating Business Segments
7.2.7 Product Portfolio
7.2.8 Business Performance
7.2.9 Key Strategic Moves and Recent Developments
7.2.10 SWOT Analysis
7.3 ORACLE (USA)
7.4 SAP (GERMANY)
7.5 ADOBE SYSTEMS (USA)
7.6 GENESYS TELECOMMUNICATIONS LABORATORIES (USA)
7.7 MICROSOFT (USA)
7.8 NICE SYSTEMS (ISRAEL)
7.9 VERINT SYSTEMS INC. (USA)
7.10 PEGASYSTEMS (USA)
7.11 IQVIA (USA)
7.12 OTHERS
7.13
Chapter 8: Global Cluster Computing Market By Region
8.1 Overview
8.2. North America Cluster Computing Market
8.2.1 Key Market Trends, Growth Factors and Opportunities
8.2.2 Top Key Companies
8.2.3 Historic and Forecasted Market Size by Segments
8.2.4 Historic and Forecasted Market Size by Deployment Model
8.2.4.1 On-Premises
8.2.4.2 Cloud Based
8.2.5 Historic and Forecasted Market Size by Cluster Type
8.2.5.1 High Availability (HA) and Failover
8.2.5.2 Load Balancing
8.2.5.3 HA & Load Balancing
8.2.5.4 Distributed & Parallel Processing
8.2.6 Historic and Forecasted Market Size by End-User
8.2.6.1 Life Science
8.2.6.2 Industrial Manufacturing
8.2.6.3 Banking
8.2.6.4 Defense
8.2.6.5 Gaming Industry
8.2.6.6 Retail
8.2.6.7 Others
8.2.7 Historic and Forecast Market Size by Country
8.2.7.1 US
8.2.7.2 Canada
8.2.7.3 Mexico
8.3. Eastern Europe Cluster Computing Market
8.3.1 Key Market Trends, Growth Factors and Opportunities
8.3.2 Top Key Companies
8.3.3 Historic and Forecasted Market Size by Segments
8.3.4 Historic and Forecasted Market Size by Deployment Model
8.3.4.1 On-Premises
8.3.4.2 Cloud Based
8.3.5 Historic and Forecasted Market Size by Cluster Type
8.3.5.1 High Availability (HA) and Failover
8.3.5.2 Load Balancing
8.3.5.3 HA & Load Balancing
8.3.5.4 Distributed & Parallel Processing
8.3.6 Historic and Forecasted Market Size by End-User
8.3.6.1 Life Science
8.3.6.2 Industrial Manufacturing
8.3.6.3 Banking
8.3.6.4 Defense
8.3.6.5 Gaming Industry
8.3.6.6 Retail
8.3.6.7 Others
8.3.7 Historic and Forecast Market Size by Country
8.3.7.1 Russia
8.3.7.2 Bulgaria
8.3.7.3 The Czech Republic
8.3.7.4 Hungary
8.3.7.5 Poland
8.3.7.6 Romania
8.3.7.7 Rest of Eastern Europe
8.4. Western Europe Cluster Computing Market
8.4.1 Key Market Trends, Growth Factors and Opportunities
8.4.2 Top Key Companies
8.4.3 Historic and Forecasted Market Size by Segments
8.4.4 Historic and Forecasted Market Size by Deployment Model
8.4.4.1 On-Premises
8.4.4.2 Cloud Based
8.4.5 Historic and Forecasted Market Size by Cluster Type
8.4.5.1 High Availability (HA) and Failover
8.4.5.2 Load Balancing
8.4.5.3 HA & Load Balancing
8.4.5.4 Distributed & Parallel Processing
8.4.6 Historic and Forecasted Market Size by End-User
8.4.6.1 Life Science
8.4.6.2 Industrial Manufacturing
8.4.6.3 Banking
8.4.6.4 Defense
8.4.6.5 Gaming Industry
8.4.6.6 Retail
8.4.6.7 Others
8.4.7 Historic and Forecast Market Size by Country
8.4.7.1 Germany
8.4.7.2 UK
8.4.7.3 France
8.4.7.4 The Netherlands
8.4.7.5 Italy
8.4.7.6 Spain
8.4.7.7 Rest of Western Europe
8.5. Asia Pacific Cluster Computing Market
8.5.1 Key Market Trends, Growth Factors and Opportunities
8.5.2 Top Key Companies
8.5.3 Historic and Forecasted Market Size by Segments
8.5.4 Historic and Forecasted Market Size by Deployment Model
8.5.4.1 On-Premises
8.5.4.2 Cloud Based
8.5.5 Historic and Forecasted Market Size by Cluster Type
8.5.5.1 High Availability (HA) and Failover
8.5.5.2 Load Balancing
8.5.5.3 HA & Load Balancing
8.5.5.4 Distributed & Parallel Processing
8.5.6 Historic and Forecasted Market Size by End-User
8.5.6.1 Life Science
8.5.6.2 Industrial Manufacturing
8.5.6.3 Banking
8.5.6.4 Defense
8.5.6.5 Gaming Industry
8.5.6.6 Retail
8.5.6.7 Others
8.5.7 Historic and Forecast Market Size by Country
8.5.7.1 China
8.5.7.2 India
8.5.7.3 Japan
8.5.7.4 South Korea
8.5.7.5 Malaysia
8.5.7.6 Thailand
8.5.7.7 Vietnam
8.5.7.8 The Philippines
8.5.7.9 Australia
8.5.7.10 New Zealand
8.5.7.11 Rest of APAC
8.6. Middle East & Africa Cluster Computing Market
8.6.1 Key Market Trends, Growth Factors and Opportunities
8.6.2 Top Key Companies
8.6.3 Historic and Forecasted Market Size by Segments
8.6.4 Historic and Forecasted Market Size by Deployment Model
8.6.4.1 On-Premises
8.6.4.2 Cloud Based
8.6.5 Historic and Forecasted Market Size by Cluster Type
8.6.5.1 High Availability (HA) and Failover
8.6.5.2 Load Balancing
8.6.5.3 HA & Load Balancing
8.6.5.4 Distributed & Parallel Processing
8.6.6 Historic and Forecasted Market Size by End-User
8.6.6.1 Life Science
8.6.6.2 Industrial Manufacturing
8.6.6.3 Banking
8.6.6.4 Defense
8.6.6.5 Gaming Industry
8.6.6.6 Retail
8.6.6.7 Others
8.6.7 Historic and Forecast Market Size by Country
8.6.7.1 Turkiye
8.6.7.2 Bahrain
8.6.7.3 Kuwait
8.6.7.4 Saudi Arabia
8.6.7.5 Qatar
8.6.7.6 UAE
8.6.7.7 Israel
8.6.7.8 South Africa
8.7. South America Cluster Computing Market
8.7.1 Key Market Trends, Growth Factors and Opportunities
8.7.2 Top Key Companies
8.7.3 Historic and Forecasted Market Size by Segments
8.7.4 Historic and Forecasted Market Size by Deployment Model
8.7.4.1 On-Premises
8.7.4.2 Cloud Based
8.7.5 Historic and Forecasted Market Size by Cluster Type
8.7.5.1 High Availability (HA) and Failover
8.7.5.2 Load Balancing
8.7.5.3 HA & Load Balancing
8.7.5.4 Distributed & Parallel Processing
8.7.6 Historic and Forecasted Market Size by End-User
8.7.6.1 Life Science
8.7.6.2 Industrial Manufacturing
8.7.6.3 Banking
8.7.6.4 Defense
8.7.6.5 Gaming Industry
8.7.6.6 Retail
8.7.6.7 Others
8.7.7 Historic and Forecast Market Size by Country
8.7.7.1 Brazil
8.7.7.2 Argentina
8.7.7.3 Rest of SA
Chapter 9 Analyst Viewpoint and Conclusion
9.1 Recommendations and Concluding Analysis
9.2 Potential Market Strategies
Chapter 10 Research Methodology
10.1 Research Process
10.2 Primary Research
10.3 Secondary Research
|
Global Cluster Computing Market |
|||
|
Base Year: |
2023 |
Forecast Period: |
2024-2032 |
|
Historical Data: |
2017 to 2023 |
Market Size in 2023: |
USD 33.86 Bn. |
|
Forecast Period 2023-30 CAGR: |
2.50% |
Market Size in 2032: |
USD 41.26 Bn. |
|
Segments Covered: |
By Deployment Model |
|
|
|
By Cluster Type |
|
||
|
By End-User |
|
||
|
By Region |
|
||
|
Key Market Drivers: |
|
||
|
Key Market Restraints: |
|
||
|
Key Opportunities: |
|
||
|
Companies Covered in the report: |
|
||


