


Ceramic Sand Screens Market Synopsis
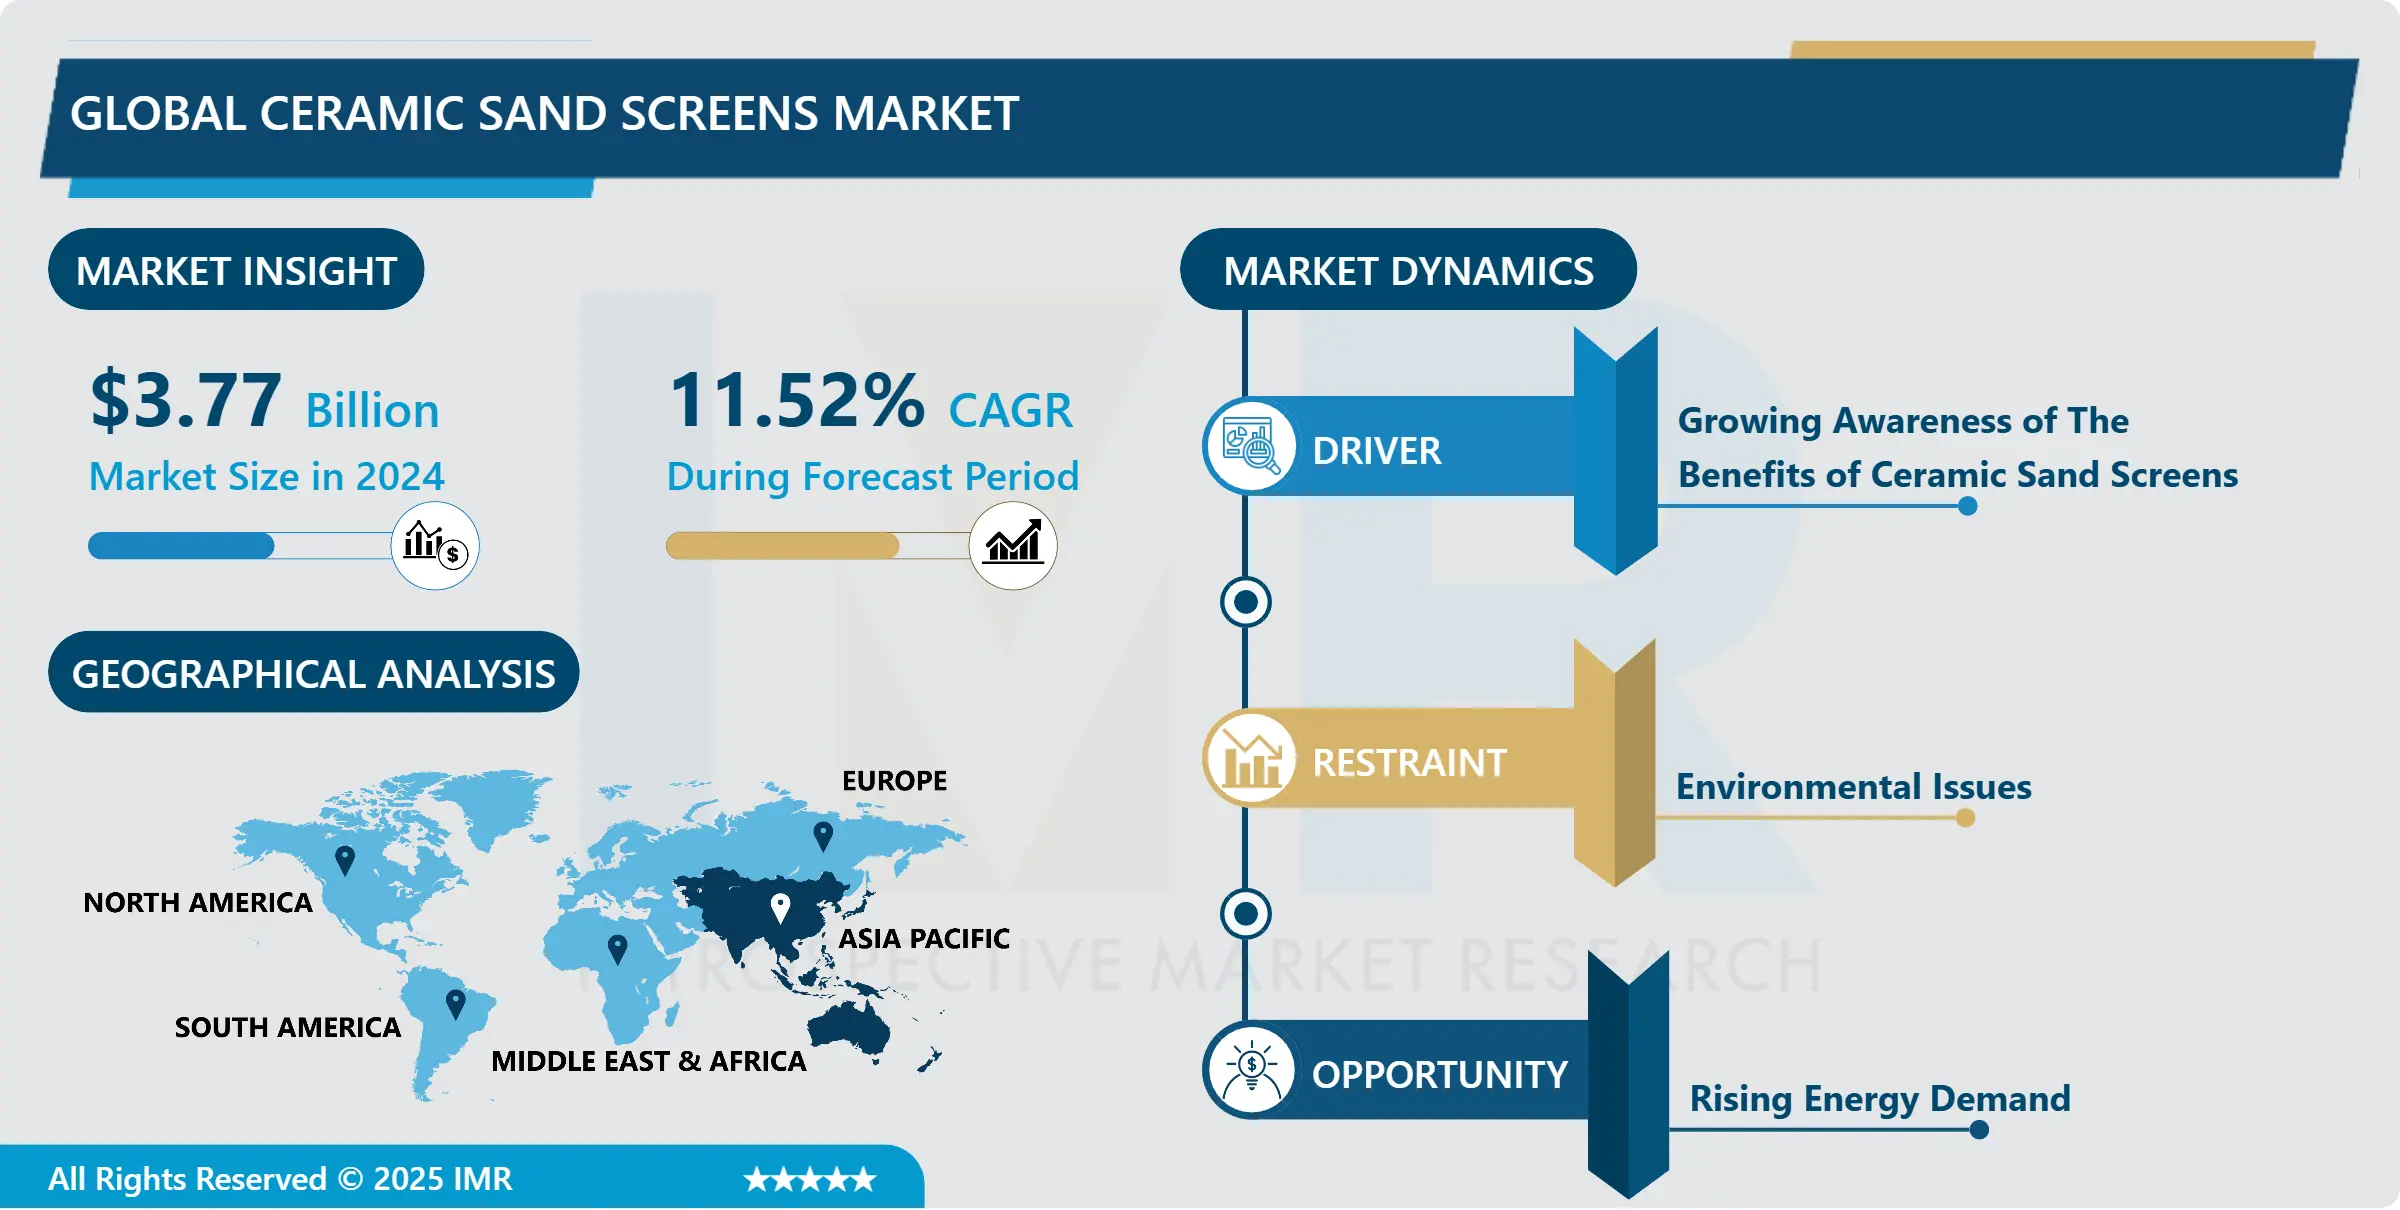
Global Ceramic Sand Screens Market Size Was Valued at USD 3.77 Billion in 2024, and is Projected to Reach USD 9.02 Billion by 2032, Growing at a CAGR of 11.52% From 2025-2032.
Ceramic sand screens serve as specialized filtration devices in oil and gas production wellbores. Designed from robust ceramic materials, these screens offer exceptional resistance to corrosion and erosion, ensuring durability in challenging downhole environments. They efficiently filter out sand and other solid particles, preventing their entry into the production stream. By sustaining optimal reservoir performance and minimizing the threat of damage caused by sand production, ceramic sand screens contribute to improved well productivity and longevity. These screens are strategically positioned within wellbores to filter out solid particles, such as sand, preventing their entry into the production stream. The incorporation of ceramic materials in these screens enhances their durability, making them well-suited for challenging downhole environments where erosion and corrosion are prevalent. Their primary advantage lies in their effective management of sand production, ensuring equipment integrity and maintaining reservoir performance.
Ceramic screens are resistant to abrasion and chemical deterioration, resulting in an extended operational lifespan. This leads to reduced maintenance needs and improved overall well productivity. By preventing the intrusion of abrasive particles, these screens contribute to the prolonged life of production equipment, reducing the risk of damage and associated downtime.Moreover, the efficient sand control offered by ceramic screens optimizes reservoir recovery, facilitating continuous oil and gas extraction. To sum up, the utilization of ceramic sand screens provides a dependable solution for handling sand production in oil and gas wells, resulting in enhanced operational efficiency, prolonged equipment life, and sustained reservoir performance.

Ceramic Sand Screens Market Trend Analysis:
Growing Awareness of The Benefits of Ceramic Sand Screens
- The market growth of ceramic sand screens is significantly influenced by the increasing recognition of their associated benefits. As stakeholders and operators in the industry gain a deeper understanding of the unique advantages offered by ceramic materials, there is a perceptible trend toward integrating ceramic sand screens into well-completion strategies. These screens not only showcase exceptional resistance to erosion and corrosion but also play a crucial role in sand control, ensuring the protection of production equipment and the enhancement of good productivity.
- The rising awareness of ceramic sand screens is shaping decision-making in the oil and gas sector, particularly as operators seek solutions that combine durability and efficiency. The knowledge that ceramic materials can withstand challenging downhole conditions, including corrosive fluids and abrasive substances, instils confidence in their application.
- Additionally, the preventive measures against sand production provided by ceramic sand screens contribute to minimizing formation damage and sustaining reservoir performance. This heightened awareness-driven adoption is reinforced by ongoing industry efforts to disseminate information about technological advancements, case studies, and best practices related to ceramic sand screens. This approach fosters a more informed and proactive stance toward sand control in oil and gas well completions, resulting in the growing acceptance and market expansion of these screens.
Rising Energy Demand
- The growing global demand for energy presents a significant opportunity for the expansion of the ceramic sand screens market. With the continuous rise in the world's energy requirements, there is a simultaneous increase in oil and gas exploration and production activities. This upsurge in activity creates openings for technologies that optimize well performance and prolong the operational lifespan of production wells.
- The opportunity lies in aligning the applications of ceramic sand screens with the escalating exploration efforts in various geographical locations, including those characterized by challenging downhole conditions. The pursuit of deeper offshore drilling and unconventional resource extraction, motivated by the need to meet growing energy demands, requires robust sand control measures. Ceramic sand screens, crafted to endure harsh environments, provide a strategic solution to enhance well completions and sustain production levels. The market for ceramic sand screens can capitalize on this global energy demand as a driving force for increased adoption, positioning these screens as essential components in the quest for efficient and sustainable oil and gas production to fulfill the world's rising energy needs.
Ceramic Sand Screens Market Segment Analysis:
Ceramic Sand Screens Market Segmented on the basis of Type and Application.
By Type, Roller Ceramic Sand Screens Segment is Expected to Dominate the Market During the Forecast Period
- The Roller Ceramic Sand Screens segment is positioned to assert itself as the leading force in the market, displaying a trajectory marked by substantial growth and innovation. As industries increasingly prioritize efficiency and longevity, the distinctive features of roller ceramic sand screens position them as frontrunners in the market landscape. These screens, known for their exceptional wear resistance, thermal stability, and corrosion resilience, present a superior alternative to conventional materials.
- The roller ceramic technology ensures an extended operational life, reduced maintenance costs, and enhanced performance in challenging environments. With industries such as oil and gas, mining, and water treatment seeking state-of-the-art solutions, the Roller Ceramic sand screens segment is anticipated to play a crucial role in reshaping industry standards, solidifying its dominance in the market through unparalleled durability and efficiency.
By Application, Oil and Gas Industry Segment Held the Largest Share in 2024
- The Oil and Gas industry segment has firmly established its dominance, holding the largest share of the market. This commanding presence is driven by the industry's constant need for advanced technologies and solutions to optimize exploration, extraction, and production processes. With the global energy landscape heavily reliant on fossil fuels, the demand for efficient tools and equipment within the Oil and Gas sector is crucial.
- The market's response to this demand is evident in the continuous development and adoption of cutting-edge technologies, including state-of-the-art drilling equipment, sophisticated reservoir management systems, and advanced sensing technologies. As the industry addresses the challenges of maximizing reserves and minimizing environmental impact, the substantial market share of the Oil and Gas industry underscores its pivotal role in driving innovation and shaping the future of the energy sector.
Ceramic Sand Screens Market Regional Insights:
Asia Pacific is Expected to Dominate the Market Over the Forecast Period
- The Asia Pacific region is positioned to establish dominance in the market, emerging as a powerhouse driving economic growth and technological innovation. The market landscape is undergoing a transformative shift, with Asia Pacific leading the way due to its dynamic economies, expanding industrial sectors, and rapidly growing consumer base. The region's prominence is further strengthened by robust infrastructural development and increased investments in key industries such as manufacturing, technology, and energy. Government initiatives that promote innovation and entrepreneurship contribute to this momentum.
- As the Asia Pacific region experiences unprecedented urbanization and industrialization, the demand for a diverse range of products and services is on the rise, solidifying its dominance in the market. The convergence of these factors positions Asia Pacific as a pivotal player, influencing market trends and shaping the global economic landscape.
Key Players Covered in Ceramic Sand Screens Market:
- 3M(U.S.)
- Dana Holding (U.S.)
- Federal-Mogul (U.S.)
- Henniges Automotive (U.S.)
- John Deere (U.S.)
- Caterpillar (U.S.)
- SKF (Sweden)
- Sandvik (Sweden)
- Freudenberg Sealing Technologies (Germany)
- Dichtungstechnik (Germany)
- Wirtgen Group (Germany)
- Liebherr-International AG (Switzerland)
- JCB (UK)
- Sany (China)
- XCMG (China)
- Zoomlion (China)
- Komatsu (Japan)
- Hitachi (Japan)
- Doosan infracore (South Korea), and Other Active Players.
|
Global Ceramic Sand Screens Market |
|||
|
Base Year: |
2024 |
Forecast Period: |
2025-2032 |
|
Historical Data: |
2018 to 2023 |
Market Size in 2024: |
USD 3.77 Bn. |
|
Forecast Period 2024-32 CAGR: |
11.52% |
Market Size in 2032: |
USD 9.02 Bn. |
|
Segments Covered: |
By Type |
|
|
|
By Application |
|
||
|
By Region |
|
||
|
Key Market Drivers: |
|
||
|
Key Market Restraints: |
|
||
|
Key Opportunities: |
|
||
|
Companies Covered in the report: |
|
||
Chapter 1: Introduction
1.1 Scope and Coverage
Chapter 2:Executive Summary
Chapter 3: Market Landscape
3.1 Market Dynamics
3.1.1 Drivers
3.1.2 Restraints
3.1.3 Opportunities
3.1.4 Challenges
3.2 Market Trend Analysis
3.3 PESTLE Analysis
3.4 Porter's Five Forces Analysis
3.5 Industry Value Chain Analysis
3.6 Ecosystem
3.7 Regulatory Landscape
3.8 Price Trend Analysis
3.9 Patent Analysis
3.10 Technology Evolution
3.11 Investment Pockets
3.12 Import-Export Analysis
Chapter 4: Ceramic Sand Screens Market by Type (2018-2032)
4.1 Ceramic Sand Screens Market Snapshot and Growth Engine
4.2 Market Overview
4.3 Roller Ceramic Sand Screens
4.3.1 Introduction and Market Overview
4.3.2 Historic and Forecasted Market Size in Value USD and Volume Units
4.3.3 Key Market Trends, Growth Factors, and Opportunities
4.3.4 Geographic Segmentation Analysis
4.4 Water Washing Roller Ceramic Sand Screens
4.5 Vibro Ceramic Sand Screens
Chapter 5: Ceramic Sand Screens Market by Application (2018-2032)
5.1 Ceramic Sand Screens Market Snapshot and Growth Engine
5.2 Market Overview
5.3 Chemical Industry
5.3.1 Introduction and Market Overview
5.3.2 Historic and Forecasted Market Size in Value USD and Volume Units
5.3.3 Key Market Trends, Growth Factors, and Opportunities
5.3.4 Geographic Segmentation Analysis
5.4 Construction Industry
5.5 Oil and Gas Industry
Chapter 6: Company Profiles and Competitive Analysis
6.1 Competitive Landscape
6.1.1 Competitive Benchmarking
6.1.2 Ceramic Sand Screens Market Share by Manufacturer (2024)
6.1.3 Industry BCG Matrix
6.1.4 Heat Map Analysis
6.1.5 Mergers and Acquisitions
6.2 FANUC AMERICA CORPORATION (U.S.)
6.2.1 Company Overview
6.2.2 Key Executives
6.2.3 Company Snapshot
6.2.4 Role of the Company in the Market
6.2.5 Sustainability and Social Responsibility
6.2.6 Operating Business Segments
6.2.7 Product Portfolio
6.2.8 Business Performance
6.2.9 Key Strategic Moves and Recent Developments
6.2.10 SWOT Analysis
6.3 SHAPE PROCESS AUTOMATION (U.S.)
6.4 HYPERTHERM (U.S.)
6.5 IPG PHOTONICS (U.S.)
6.6 STAUBLI (SWITZERLAND)
6.7 BYSTRONIC (SWITZERLAND)
6.8 ABB (SWITZERLAND)
6.9 KUKA ROBOTICS (GERMANY)
6.10 TRUMPF (GERMANY)
6.11 JENOPTIK (GERMANY)
6.12 BLM GROUP (ITALY)
6.13 ESAB (SWEDEN)
6.14 YASKAWA (JAPAN)
6.15 AMADA (JAPAN)
6.16 MITSUBISHI ELECTRIC CORPORATION (JAPAN)
6.17 SCANTECH LASER PVT LTD. (AUSTRALIA)
6.18 HAN'S LASER SMART EQUIPMENT (CHINA)
6.19 GWEIKE (CHINA)
6.20 SHENZHEN LEI KANG MACHINERY EQUIPMENT COLTD (CHINA)
6.21
Chapter 7: Global Ceramic Sand Screens Market By Region
7.1 Overview
7.2. North America Ceramic Sand Screens Market
7.2.1 Key Market Trends, Growth Factors and Opportunities
7.2.2 Top Key Companies
7.2.3 Historic and Forecasted Market Size by Segments
7.2.4 Historic and Forecasted Market Size by Type
7.2.4.1 Roller Ceramic Sand Screens
7.2.4.2 Water Washing Roller Ceramic Sand Screens
7.2.4.3 Vibro Ceramic Sand Screens
7.2.5 Historic and Forecasted Market Size by Application
7.2.5.1 Chemical Industry
7.2.5.2 Construction Industry
7.2.5.3 Oil and Gas Industry
7.2.6 Historic and Forecast Market Size by Country
7.2.6.1 US
7.2.6.2 Canada
7.2.6.3 Mexico
7.3. Eastern Europe Ceramic Sand Screens Market
7.3.1 Key Market Trends, Growth Factors and Opportunities
7.3.2 Top Key Companies
7.3.3 Historic and Forecasted Market Size by Segments
7.3.4 Historic and Forecasted Market Size by Type
7.3.4.1 Roller Ceramic Sand Screens
7.3.4.2 Water Washing Roller Ceramic Sand Screens
7.3.4.3 Vibro Ceramic Sand Screens
7.3.5 Historic and Forecasted Market Size by Application
7.3.5.1 Chemical Industry
7.3.5.2 Construction Industry
7.3.5.3 Oil and Gas Industry
7.3.6 Historic and Forecast Market Size by Country
7.3.6.1 Russia
7.3.6.2 Bulgaria
7.3.6.3 The Czech Republic
7.3.6.4 Hungary
7.3.6.5 Poland
7.3.6.6 Romania
7.3.6.7 Rest of Eastern Europe
7.4. Western Europe Ceramic Sand Screens Market
7.4.1 Key Market Trends, Growth Factors and Opportunities
7.4.2 Top Key Companies
7.4.3 Historic and Forecasted Market Size by Segments
7.4.4 Historic and Forecasted Market Size by Type
7.4.4.1 Roller Ceramic Sand Screens
7.4.4.2 Water Washing Roller Ceramic Sand Screens
7.4.4.3 Vibro Ceramic Sand Screens
7.4.5 Historic and Forecasted Market Size by Application
7.4.5.1 Chemical Industry
7.4.5.2 Construction Industry
7.4.5.3 Oil and Gas Industry
7.4.6 Historic and Forecast Market Size by Country
7.4.6.1 Germany
7.4.6.2 UK
7.4.6.3 France
7.4.6.4 The Netherlands
7.4.6.5 Italy
7.4.6.6 Spain
7.4.6.7 Rest of Western Europe
7.5. Asia Pacific Ceramic Sand Screens Market
7.5.1 Key Market Trends, Growth Factors and Opportunities
7.5.2 Top Key Companies
7.5.3 Historic and Forecasted Market Size by Segments
7.5.4 Historic and Forecasted Market Size by Type
7.5.4.1 Roller Ceramic Sand Screens
7.5.4.2 Water Washing Roller Ceramic Sand Screens
7.5.4.3 Vibro Ceramic Sand Screens
7.5.5 Historic and Forecasted Market Size by Application
7.5.5.1 Chemical Industry
7.5.5.2 Construction Industry
7.5.5.3 Oil and Gas Industry
7.5.6 Historic and Forecast Market Size by Country
7.5.6.1 China
7.5.6.2 India
7.5.6.3 Japan
7.5.6.4 South Korea
7.5.6.5 Malaysia
7.5.6.6 Thailand
7.5.6.7 Vietnam
7.5.6.8 The Philippines
7.5.6.9 Australia
7.5.6.10 New Zealand
7.5.6.11 Rest of APAC
7.6. Middle East & Africa Ceramic Sand Screens Market
7.6.1 Key Market Trends, Growth Factors and Opportunities
7.6.2 Top Key Companies
7.6.3 Historic and Forecasted Market Size by Segments
7.6.4 Historic and Forecasted Market Size by Type
7.6.4.1 Roller Ceramic Sand Screens
7.6.4.2 Water Washing Roller Ceramic Sand Screens
7.6.4.3 Vibro Ceramic Sand Screens
7.6.5 Historic and Forecasted Market Size by Application
7.6.5.1 Chemical Industry
7.6.5.2 Construction Industry
7.6.5.3 Oil and Gas Industry
7.6.6 Historic and Forecast Market Size by Country
7.6.6.1 Turkiye
7.6.6.2 Bahrain
7.6.6.3 Kuwait
7.6.6.4 Saudi Arabia
7.6.6.5 Qatar
7.6.6.6 UAE
7.6.6.7 Israel
7.6.6.8 South Africa
7.7. South America Ceramic Sand Screens Market
7.7.1 Key Market Trends, Growth Factors and Opportunities
7.7.2 Top Key Companies
7.7.3 Historic and Forecasted Market Size by Segments
7.7.4 Historic and Forecasted Market Size by Type
7.7.4.1 Roller Ceramic Sand Screens
7.7.4.2 Water Washing Roller Ceramic Sand Screens
7.7.4.3 Vibro Ceramic Sand Screens
7.7.5 Historic and Forecasted Market Size by Application
7.7.5.1 Chemical Industry
7.7.5.2 Construction Industry
7.7.5.3 Oil and Gas Industry
7.7.6 Historic and Forecast Market Size by Country
7.7.6.1 Brazil
7.7.6.2 Argentina
7.7.6.3 Rest of SA
Chapter 8 Analyst Viewpoint and Conclusion
8.1 Recommendations and Concluding Analysis
8.2 Potential Market Strategies
Chapter 9 Research Methodology
9.1 Research Process
9.2 Primary Research
9.3 Secondary Research
|
Global Ceramic Sand Screens Market |
|||
|
Base Year: |
2024 |
Forecast Period: |
2025-2032 |
|
Historical Data: |
2018 to 2023 |
Market Size in 2024: |
USD 3.77 Bn. |
|
Forecast Period 2024-32 CAGR: |
11.52% |
Market Size in 2032: |
USD 9.02 Bn. |
|
Segments Covered: |
By Type |
|
|
|
By Application |
|
||
|
By Region |
|
||
|
Key Market Drivers: |
|
||
|
Key Market Restraints: |
|
||
|
Key Opportunities: |
|
||
|
Companies Covered in the report: |
|
||


