


Casino Gaming Market Synopsis
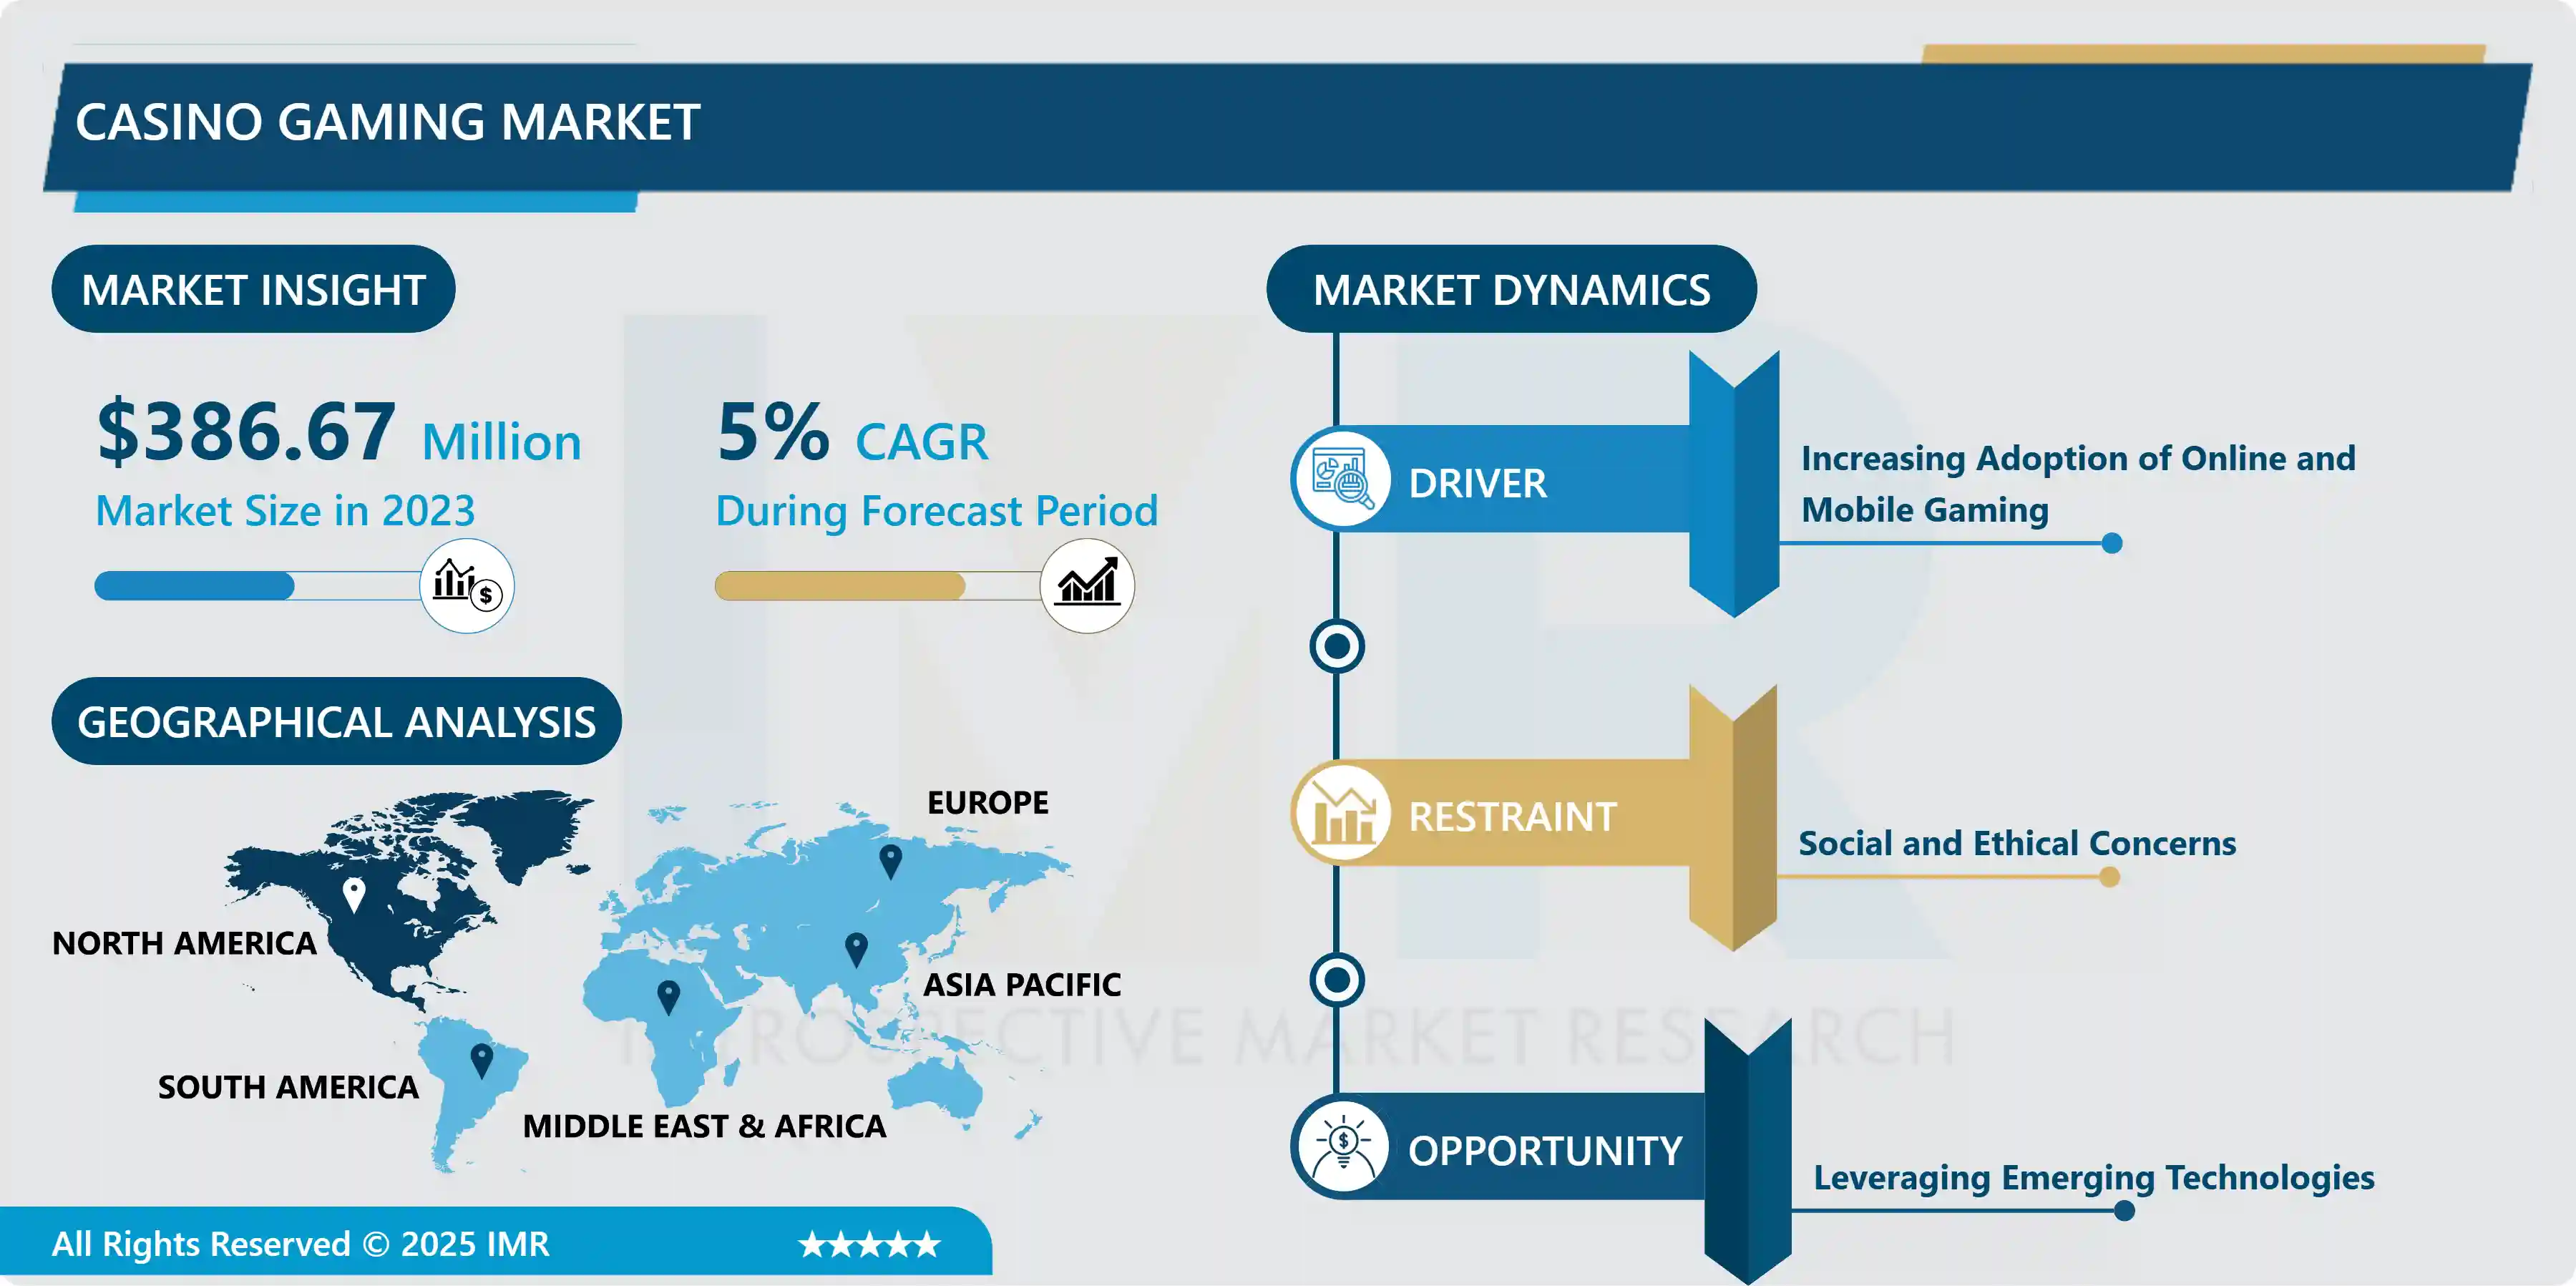
Casino Gaming Market Size Was Valued at USD 386.67 Million in 2023 and is Projected to Reach USD 599.86 Million by 2032, Growing at a CAGR of 5% From 2024-2032.
Casino operations could therefore be described as the assortment of gambling activities transacted within a casino. This is comprised of random games of chance that are played on the table like blackjack, roulette and poker among others; the electronic random games that include the slot games and virtual poker among others. It can be described as risking money on particular games with the intention of winning some amount of money or any other prize, achieved through a random outcome of the game, predicated on the given skills of players or a chance. There is certain measure in place to guarantee its fairness and to curb on the various unlawful actions taking place in the industry; it offers entertainment to the people and at the same time provides a huge source of income to the operators and tax compensation to the governments.
The casino gaming is a specific type of gambling and all of them classified in the specific area of commercial entertainment, which includes slot machines, Texas Hold ‘Em poker, blackjack, roulette, betting on sport events and more. This market is influenced by factors with the likes of; technology, policies, social structure, and the likes, which give a preference to certain products. Online gambling has come a long way in transforming the traditional approach, wherein customers can now gamble at their convenience either at home or on the move using tablet or smart phones. Besides expanding the geographic location accessibility, the advancement in technology and the internet have also improved the Real Money Casino games through live dealer games, virtual reality, and augmented reality games.
A strong factor that is likely to continue driving the casino gaming market is the continuously growing legal and regulation frameworks across different territories. North American and European markets, and Asia-Pacific as well is gradually moving towards liberal policies when it comes to gambling, which in turn are opening up more market opportunities. As an example, the United States experienced an inclination in the legalization of sports betting after the High Court’s ruling in 2018 to repeal the PASPA. This has sparked a huge interest from investors as serious casino companies and new entrants into the industry compete for market share. Moreover, the slots and live table games of the integrated resorts or the large—holistic buildings that can house casinos with hotels, shopping, entertainment and conventions—have fuelled the growth of the market through local and international travellers.
Macau and Singapore has been a core part of the global casino gaming industry and expectations are that it will remain so for long time. Macau has become the international gambling center and surpassed Las Vegas in terms of the gaming revenue, while the popularity mainly associated with wealthy people from Mainland China. Singapore, Marina Bay Sands and Resorts World Sentosa indicate that Singapore has positioned itself as a premier gambling and tourism hub with people visiting the country from all over the world. In addition, the future possibilities of penetrating the Japanese market with irs integrated resorts in cities such as Osaka and Yokohama hold much promise and is expected to fairly transform the industry.
Admittedly, this industry holds potential for growth, still it has several obstacles. Challenges often stem in the shape of difficult regulatory and legal frameworks that vary from one country to another with different levels of restrictions, and even some types of HPC banned. Moreover, the social and economic effects of gambling with regard to gambling disorder and the potential for the latter to lead to resumed spread for some individuals remain the subject of discussion. The industry has to overcome these difficulties by being always focused on endorsing proper gambling behavior and meeting the legal requirements.
Rise in incidences of technology is defining the future of casino gaming more than it is at present today. For example, the blockchain is being considered as a new approach that can increase the confidence of transactions’ parties. Further, both eSports betting and the shift towards creating fully immersive casino experiences are attracting younger customers and therefore spearheading a new wave of development. Nonetheless, the best way for the projected stakeholders is to reconsider consumer choices and behavior patterns on the market as well as use innovative technologies to remain beneficial.
The casino gaming market is a dynamic and growing market with much room for more growth and development supported by shifts in regulation, IT and implementation of measures that allow integration of casino resorts. However, despite the barriers including regulatory issues and social issues, the market in dispute remains exciting and viable more so through creating new and competitive market experiences across the global market. As with most industries, there are always risks involved and some sort of negative fallout to deal with; therefore, the direction that casino gaming industry should take in the future is to find the best balance of growth and responsible gaming.

Casino Gaming Market Trend Analysis
Rise of Skill-Based Gaming
- Introduction of skill based games as a type of games offered in casinos is a typical sociological change to the way gambling took place. In contrast to such games of chance as slots and roulette, a large number of games are now based on the skills and efforts of a player and do not depend on the lucky peek. This appeals to a new generation of gamers who are inclined more to the core and spectacular part of events, which are present in such games. Also, skill-based games add a degree of mastery in skills, making the actual gaming an enhanced or even more inspiring experience to the gamer.
- With this trend making the rounds, there has been an upsurge of casinos enhancing the levels of skill in their games. This not only helps attract a greater number of players, but can also assist casinos when dealing with a constantly shifting market, environment. Moreover, the adoption of SBG is more suitable since it offers ways for casino operators to embrace technology and innovation to enhance or design designs that thi appeal to the modern casino goer. In total, the phenomenon of skill-based gaming can be attributed to better tendencies of development and diversification on the good of the casino market.
Leveraging Emerging Technologies
- The casino gaming industry is now therefore at a crossroads where through the adaptation of new technologies a radical change is expected to happen. AR and VR are now taking gaming industry to another level through providing the players with virtual environments, that feels real. These technologies are being embraced by casinos to develop compelling games that will offer better user experience, leading to loyalty among players besides attracting other groups. Furthermore, there are profound changes happening in the online gambling as the industry embraces the so called blockchain technology that ensures the transparent and secure transactions between the operators and the players. Smart contracts allow high payout and are self-regulating to ensure that no one party can alter the results for their benefit.
- In addition, the newly-emerging technology, often known as artificial intelligence or AI, is already transforming customer relations support and individualisation of requests with representatives of the casino business. Martyn Prizment pointed out that round-the-clock support is provided through AI-powered chatbots capable of answering players’ queries and proposing relevant suggestions. Coupon information and user data from their past play allows software to predict which coupons they will like and use, and then helps casinos target the right coupons at the right customers. Consequently, the Internet of Things (Iot) is helping to improve a level of production and even the level of security by connecting different devices. The extremely intelligent security systems regulate operations on the casino floor in real time, identifying any unlawful behavior or regulatory violations. In general, the implementation of these emerging technologies has led to strategic advances in the modern casino gaming and the prediction of its future.
Casino Gaming Market Segment Analysis:
Casino Gaming Market is segmented based on Type, Game Type, and End-User.
By Type, Online Casino Gaming segment is expected to dominate the market during the forecast period
- The global casino gaming market can be dissected into two primary segments: The MGAC has provided recommendations on land-based and online gaming. This type of gambling operation has traditionally been an essential part of the gambling industry since it provides a fully-fledged environment for entertaining and engaging visitors. It is within these places that one is likely to be able to access a variety of games that include black-jack, poker and the ever popular roulette besides other new developments in games such as those involving electronic slots. However, current limitations and restrictions affecting land-based establishments like the regulations that have tightened on their operations among other changes in consumer tastes remain a major issue to their progress.
- On the other hand, online casino gaming has continued to gain impressive growth in recent years, mainly due to the enhancement of technology and the rise in the proportion of internet users globally. The major benefits of this type of gambling are the comfort and flexibility as it grants people the privilege to enjoy their favorite games at a preferred location whether online or through their mobile devices. The category presents itself in quite a few flavors, such as the web-based, the mobile, and the live dealer, to the interest of as many individuals as possible. Also, there are usually economic rewards these online casinos parade to customers such as bonuses and loyalty programs. The future trends in the development of the gaming industry is going to pave the way to shift the focus towards online gaming, which mean new opportunities and potential threats for the traditional ‘bricks and mortar’ operators.
By Game Type , Slot Machines segment held the largest share in 2023
- The casino gaming is one of the dynamic market because there are many types of games which fall in this category and all of them jointly and severally contribute to the expansion of the market and its acceptance among the populace. Slot machines remain the most popular game with high competitiveness with players as well as ease of playing. The fact that they are easily found, and complemented by latest developments in the world of video games such as the themed games together with the progressive jackpots mean that the sites will always be attractive. Roulette – this is a table with a wheel and numerous kinds of bets – also takes a substantial share, giving opportunities to win with the help of the chance and the use of skills for the newcomers and experienced players. Its rather low variability and ability to produce hefty prizes have ensured that the game remains a favorite both at live and online casinos.
- While games such as poker and blackjack fall into the category that will be more attractive to individuals who are interested in a skill based game. Thanks to poker’s multi-layered gameplay and social aspect, the game’s continuing popularity is evident by the fact that everyone from casual players to, pro competitors engage in poker’s tournaments and cash games. Likewise, the randomness coupled with skill to determine the outcome of the game makes blackjack one of the most popular casino games to this date, and an individual has the rare chance to actually apply some skills to outwit the dealer. While John has given more importance to poker and bingo, craps, though is comparatively less popular, the game is continuously played with much of dedication and lively play, fast moving and a collective effort. Even though these games belong the sphere of main offers, the list of other versions includes baccarat, bingo, and specialty games that expand the list of options for customers and make the world of casino even brighter and more diverse.
Casino Gaming Market Regional Insights:
Asia Pacific is Expected to Dominate the Market Over the Forecast period
- In this regard, several factors have been identified that will secure a victory for the Asia Pacific region through the forecast period in terms of its casino gaming market share. The opportunities to engage in casino entertainment are rising rapidly due to the rapid economic development and the increase in disposable income in many countries, such as China and India and many of the SEA nations. Moreover, it remains one of the most popular gambling destinations globally, encompassing such markets as Macau and Singapore. It is worth mentioning that Macau is familiar as the “Gambling capital of the world, it produces significantly more revenues from gambling than Las Vegas, which emphasizes the significance of this region in the global market. Moreover, the growth of integrated resort expansion projects comprising casinos and related services alongside accommodation, retail and amusement facilities increases tourist arrivals both from within and outside Nepal, consequently increasing the market.
- The third factor which has greatly contributed to the Easterization is the forthcoming liberalism of the legislation connected to gambling and considerable investments in casino and other related constructions. Singapore is preparing the foundation for having the first integrated resort while Japan could potentially generate an annual average of millions of visitors. However, to consumers, social networks and mobile applications and games, the market has been growing and is now targeting youth and young adults where most of them have their interests in the online an digital form of interaction or past time. Because governments of the region have seen that there are economic returns in terms of job creation and revenues from tourism, there is likelihood to find government supportive of growth of casino gaming in the region. The present legal framework and the high likelihood that locals and expatriates in most Asia Pacific countries embrace casino games due to cultural predispositions herald steady market control.
Active Key Players in the Casino Gaming Market
- Caesars Entertainment (US)
- Galaxy Entertainment ( Hong Kong)
- Las Vegas Sands (US)
- MGM Resorts (US)
- SJM Holdings ( Macau)
- 888 Holdings PLC (Gibraltar)
- Betfair Online Casino Games (UK)
- Boyd Gaming Corporation (US)
- City of Dreams Manila (Philippines)
- Delaware Park (US)
- BetAmerica (US)
- Foxwoods Resort Casino (US)
- INTRALOT SA (Greece)
- Palms Casino Resort (US)
- Penn National Gaming Inc (US)
- Wynn Resorts Ltd (US)
- Other Key Players
Key Industry Developments in the Casino Gaming Market
- In October 2023, the Fingy3D startup firm, managed by Mon Health's Intermed Labs, will continue to position West Virginia at the forefront of medical technology. The firm offers online purchasing of 3D-printed prosthetic fingers through Mon Health's Intermed Labs. The worldwide event received entries from 21 nations and states, with five finalists competing for a $350,000 prize.
- In September 2023, scientists at the Lawrence Livermore National Laboratory (LLNL) and Meta created a new form of 3D printed material for real-world wearable applications. These novel materials can replicate biological materials, which may have implications for the future of enhanced humanity.
|
Global Casino Gaming Market |
|||
|
Base Year: |
2023 |
Forecast Period: |
2024-2032 |
|
Historical Data: |
2017 to 2023 |
Market Size in 2023: |
USD 386.67 Mn. |
|
Forecast Period 2024-32 CAGR: |
5% |
Market Size in 2032: |
USD 599.86 Mn. |
|
Segments Covered: |
By Type |
|
|
|
By Game Type |
|
||
|
By End-User |
|
||
|
By Region |
|
||
|
Key Market Drivers: |
|
||
|
Key Market Restraints: |
|
||
|
Key Opportunities: |
|
||
|
Companies Covered in the report: |
|
||
Chapter 1: Introduction
1.1 Scope and Coverage
Chapter 2:Executive Summary
Chapter 3: Market Landscape
3.1 Market Dynamics
3.1.1 Drivers
3.1.2 Restraints
3.1.3 Opportunities
3.1.4 Challenges
3.2 Market Trend Analysis
3.3 PESTLE Analysis
3.4 Porter's Five Forces Analysis
3.5 Industry Value Chain Analysis
3.6 Ecosystem
3.7 Regulatory Landscape
3.8 Price Trend Analysis
3.9 Patent Analysis
3.10 Technology Evolution
3.11 Investment Pockets
3.12 Import-Export Analysis
Chapter 4: Casino Gaming Market by Type (2018-2032)
4.1 Casino Gaming Market Snapshot and Growth Engine
4.2 Market Overview
4.3 Land-Based Casino Gaming
4.3.1 Introduction and Market Overview
4.3.2 Historic and Forecasted Market Size in Value USD and Volume Units
4.3.3 Key Market Trends, Growth Factors, and Opportunities
4.3.4 Geographic Segmentation Analysis
4.4 Online Casino Gaming
Chapter 5: Casino Gaming Market by Game Type (2018-2032)
5.1 Casino Gaming Market Snapshot and Growth Engine
5.2 Market Overview
5.3 Slot Machines
5.3.1 Introduction and Market Overview
5.3.2 Historic and Forecasted Market Size in Value USD and Volume Units
5.3.3 Key Market Trends, Growth Factors, and Opportunities
5.3.4 Geographic Segmentation Analysis
5.4 Roulette
5.5 Poker
5.6 Blackjack
5.7 Craps
5.8 Others
Chapter 6: Casino Gaming Market by End-User (2018-2032)
6.1 Casino Gaming Market Snapshot and Growth Engine
6.2 Market Overview
6.3 Gambling Enthusiasts
6.3.1 Introduction and Market Overview
6.3.2 Historic and Forecasted Market Size in Value USD and Volume Units
6.3.3 Key Market Trends, Growth Factors, and Opportunities
6.3.4 Geographic Segmentation Analysis
6.4 Lottery Loyalists
6.5 Social Exuberant
6.6 Dabblers
6.7 Unengaged Audiences
Chapter 7: Company Profiles and Competitive Analysis
7.1 Competitive Landscape
7.1.1 Competitive Benchmarking
7.1.2 Casino Gaming Market Share by Manufacturer (2024)
7.1.3 Industry BCG Matrix
7.1.4 Heat Map Analysis
7.1.5 Mergers and Acquisitions
7.2 NEW BALANCE (US)
7.2.1 Company Overview
7.2.2 Key Executives
7.2.3 Company Snapshot
7.2.4 Role of the Company in the Market
7.2.5 Sustainability and Social Responsibility
7.2.6 Operating Business Segments
7.2.7 Product Portfolio
7.2.8 Business Performance
7.2.9 Key Strategic Moves and Recent Developments
7.2.10 SWOT Analysis
7.3 UNDER ARMOUR (US)
7.4 ADIDAS AMERICA INC. (US)
7.5 3D SYSTEMS INC. (US)
7.6 SHAPEWAYS INC. (US)
7.7 FORMLABS (US)
7.8 MATERIALISE (BELGIUM)
7.9 ZORTRAX (POLAND)
7.10 STRATASYS LTD. (US)
7.11 ENVISIONTEC (US)
7.12 CARBON INC. (US)
7.13 OTHER KEY PLAYERS
Chapter 8: Global Casino Gaming Market By Region
8.1 Overview
8.2. North America Casino Gaming Market
8.2.1 Key Market Trends, Growth Factors and Opportunities
8.2.2 Top Key Companies
8.2.3 Historic and Forecasted Market Size by Segments
8.2.4 Historic and Forecasted Market Size by Type
8.2.4.1 Land-Based Casino Gaming
8.2.4.2 Online Casino Gaming
8.2.5 Historic and Forecasted Market Size by Game Type
8.2.5.1 Slot Machines
8.2.5.2 Roulette
8.2.5.3 Poker
8.2.5.4 Blackjack
8.2.5.5 Craps
8.2.5.6 Others
8.2.6 Historic and Forecasted Market Size by End-User
8.2.6.1 Gambling Enthusiasts
8.2.6.2 Lottery Loyalists
8.2.6.3 Social Exuberant
8.2.6.4 Dabblers
8.2.6.5 Unengaged Audiences
8.2.7 Historic and Forecast Market Size by Country
8.2.7.1 US
8.2.7.2 Canada
8.2.7.3 Mexico
8.3. Eastern Europe Casino Gaming Market
8.3.1 Key Market Trends, Growth Factors and Opportunities
8.3.2 Top Key Companies
8.3.3 Historic and Forecasted Market Size by Segments
8.3.4 Historic and Forecasted Market Size by Type
8.3.4.1 Land-Based Casino Gaming
8.3.4.2 Online Casino Gaming
8.3.5 Historic and Forecasted Market Size by Game Type
8.3.5.1 Slot Machines
8.3.5.2 Roulette
8.3.5.3 Poker
8.3.5.4 Blackjack
8.3.5.5 Craps
8.3.5.6 Others
8.3.6 Historic and Forecasted Market Size by End-User
8.3.6.1 Gambling Enthusiasts
8.3.6.2 Lottery Loyalists
8.3.6.3 Social Exuberant
8.3.6.4 Dabblers
8.3.6.5 Unengaged Audiences
8.3.7 Historic and Forecast Market Size by Country
8.3.7.1 Russia
8.3.7.2 Bulgaria
8.3.7.3 The Czech Republic
8.3.7.4 Hungary
8.3.7.5 Poland
8.3.7.6 Romania
8.3.7.7 Rest of Eastern Europe
8.4. Western Europe Casino Gaming Market
8.4.1 Key Market Trends, Growth Factors and Opportunities
8.4.2 Top Key Companies
8.4.3 Historic and Forecasted Market Size by Segments
8.4.4 Historic and Forecasted Market Size by Type
8.4.4.1 Land-Based Casino Gaming
8.4.4.2 Online Casino Gaming
8.4.5 Historic and Forecasted Market Size by Game Type
8.4.5.1 Slot Machines
8.4.5.2 Roulette
8.4.5.3 Poker
8.4.5.4 Blackjack
8.4.5.5 Craps
8.4.5.6 Others
8.4.6 Historic and Forecasted Market Size by End-User
8.4.6.1 Gambling Enthusiasts
8.4.6.2 Lottery Loyalists
8.4.6.3 Social Exuberant
8.4.6.4 Dabblers
8.4.6.5 Unengaged Audiences
8.4.7 Historic and Forecast Market Size by Country
8.4.7.1 Germany
8.4.7.2 UK
8.4.7.3 France
8.4.7.4 The Netherlands
8.4.7.5 Italy
8.4.7.6 Spain
8.4.7.7 Rest of Western Europe
8.5. Asia Pacific Casino Gaming Market
8.5.1 Key Market Trends, Growth Factors and Opportunities
8.5.2 Top Key Companies
8.5.3 Historic and Forecasted Market Size by Segments
8.5.4 Historic and Forecasted Market Size by Type
8.5.4.1 Land-Based Casino Gaming
8.5.4.2 Online Casino Gaming
8.5.5 Historic and Forecasted Market Size by Game Type
8.5.5.1 Slot Machines
8.5.5.2 Roulette
8.5.5.3 Poker
8.5.5.4 Blackjack
8.5.5.5 Craps
8.5.5.6 Others
8.5.6 Historic and Forecasted Market Size by End-User
8.5.6.1 Gambling Enthusiasts
8.5.6.2 Lottery Loyalists
8.5.6.3 Social Exuberant
8.5.6.4 Dabblers
8.5.6.5 Unengaged Audiences
8.5.7 Historic and Forecast Market Size by Country
8.5.7.1 China
8.5.7.2 India
8.5.7.3 Japan
8.5.7.4 South Korea
8.5.7.5 Malaysia
8.5.7.6 Thailand
8.5.7.7 Vietnam
8.5.7.8 The Philippines
8.5.7.9 Australia
8.5.7.10 New Zealand
8.5.7.11 Rest of APAC
8.6. Middle East & Africa Casino Gaming Market
8.6.1 Key Market Trends, Growth Factors and Opportunities
8.6.2 Top Key Companies
8.6.3 Historic and Forecasted Market Size by Segments
8.6.4 Historic and Forecasted Market Size by Type
8.6.4.1 Land-Based Casino Gaming
8.6.4.2 Online Casino Gaming
8.6.5 Historic and Forecasted Market Size by Game Type
8.6.5.1 Slot Machines
8.6.5.2 Roulette
8.6.5.3 Poker
8.6.5.4 Blackjack
8.6.5.5 Craps
8.6.5.6 Others
8.6.6 Historic and Forecasted Market Size by End-User
8.6.6.1 Gambling Enthusiasts
8.6.6.2 Lottery Loyalists
8.6.6.3 Social Exuberant
8.6.6.4 Dabblers
8.6.6.5 Unengaged Audiences
8.6.7 Historic and Forecast Market Size by Country
8.6.7.1 Turkiye
8.6.7.2 Bahrain
8.6.7.3 Kuwait
8.6.7.4 Saudi Arabia
8.6.7.5 Qatar
8.6.7.6 UAE
8.6.7.7 Israel
8.6.7.8 South Africa
8.7. South America Casino Gaming Market
8.7.1 Key Market Trends, Growth Factors and Opportunities
8.7.2 Top Key Companies
8.7.3 Historic and Forecasted Market Size by Segments
8.7.4 Historic and Forecasted Market Size by Type
8.7.4.1 Land-Based Casino Gaming
8.7.4.2 Online Casino Gaming
8.7.5 Historic and Forecasted Market Size by Game Type
8.7.5.1 Slot Machines
8.7.5.2 Roulette
8.7.5.3 Poker
8.7.5.4 Blackjack
8.7.5.5 Craps
8.7.5.6 Others
8.7.6 Historic and Forecasted Market Size by End-User
8.7.6.1 Gambling Enthusiasts
8.7.6.2 Lottery Loyalists
8.7.6.3 Social Exuberant
8.7.6.4 Dabblers
8.7.6.5 Unengaged Audiences
8.7.7 Historic and Forecast Market Size by Country
8.7.7.1 Brazil
8.7.7.2 Argentina
8.7.7.3 Rest of SA
Chapter 9 Analyst Viewpoint and Conclusion
9.1 Recommendations and Concluding Analysis
9.2 Potential Market Strategies
Chapter 10 Research Methodology
10.1 Research Process
10.2 Primary Research
10.3 Secondary Research
|
Global Casino Gaming Market |
|||
|
Base Year: |
2023 |
Forecast Period: |
2024-2032 |
|
Historical Data: |
2017 to 2023 |
Market Size in 2023: |
USD 386.67 Mn. |
|
Forecast Period 2024-32 CAGR: |
5% |
Market Size in 2032: |
USD 599.86 Mn. |
|
Segments Covered: |
By Type |
|
|
|
By Game Type |
|
||
|
By End-User |
|
||
|
By Region |
|
||
|
Key Market Drivers: |
|
||
|
Key Market Restraints: |
|
||
|
Key Opportunities: |
|
||
|
Companies Covered in the report: |
|
||


