


Capsule Hotels Market Synopsis
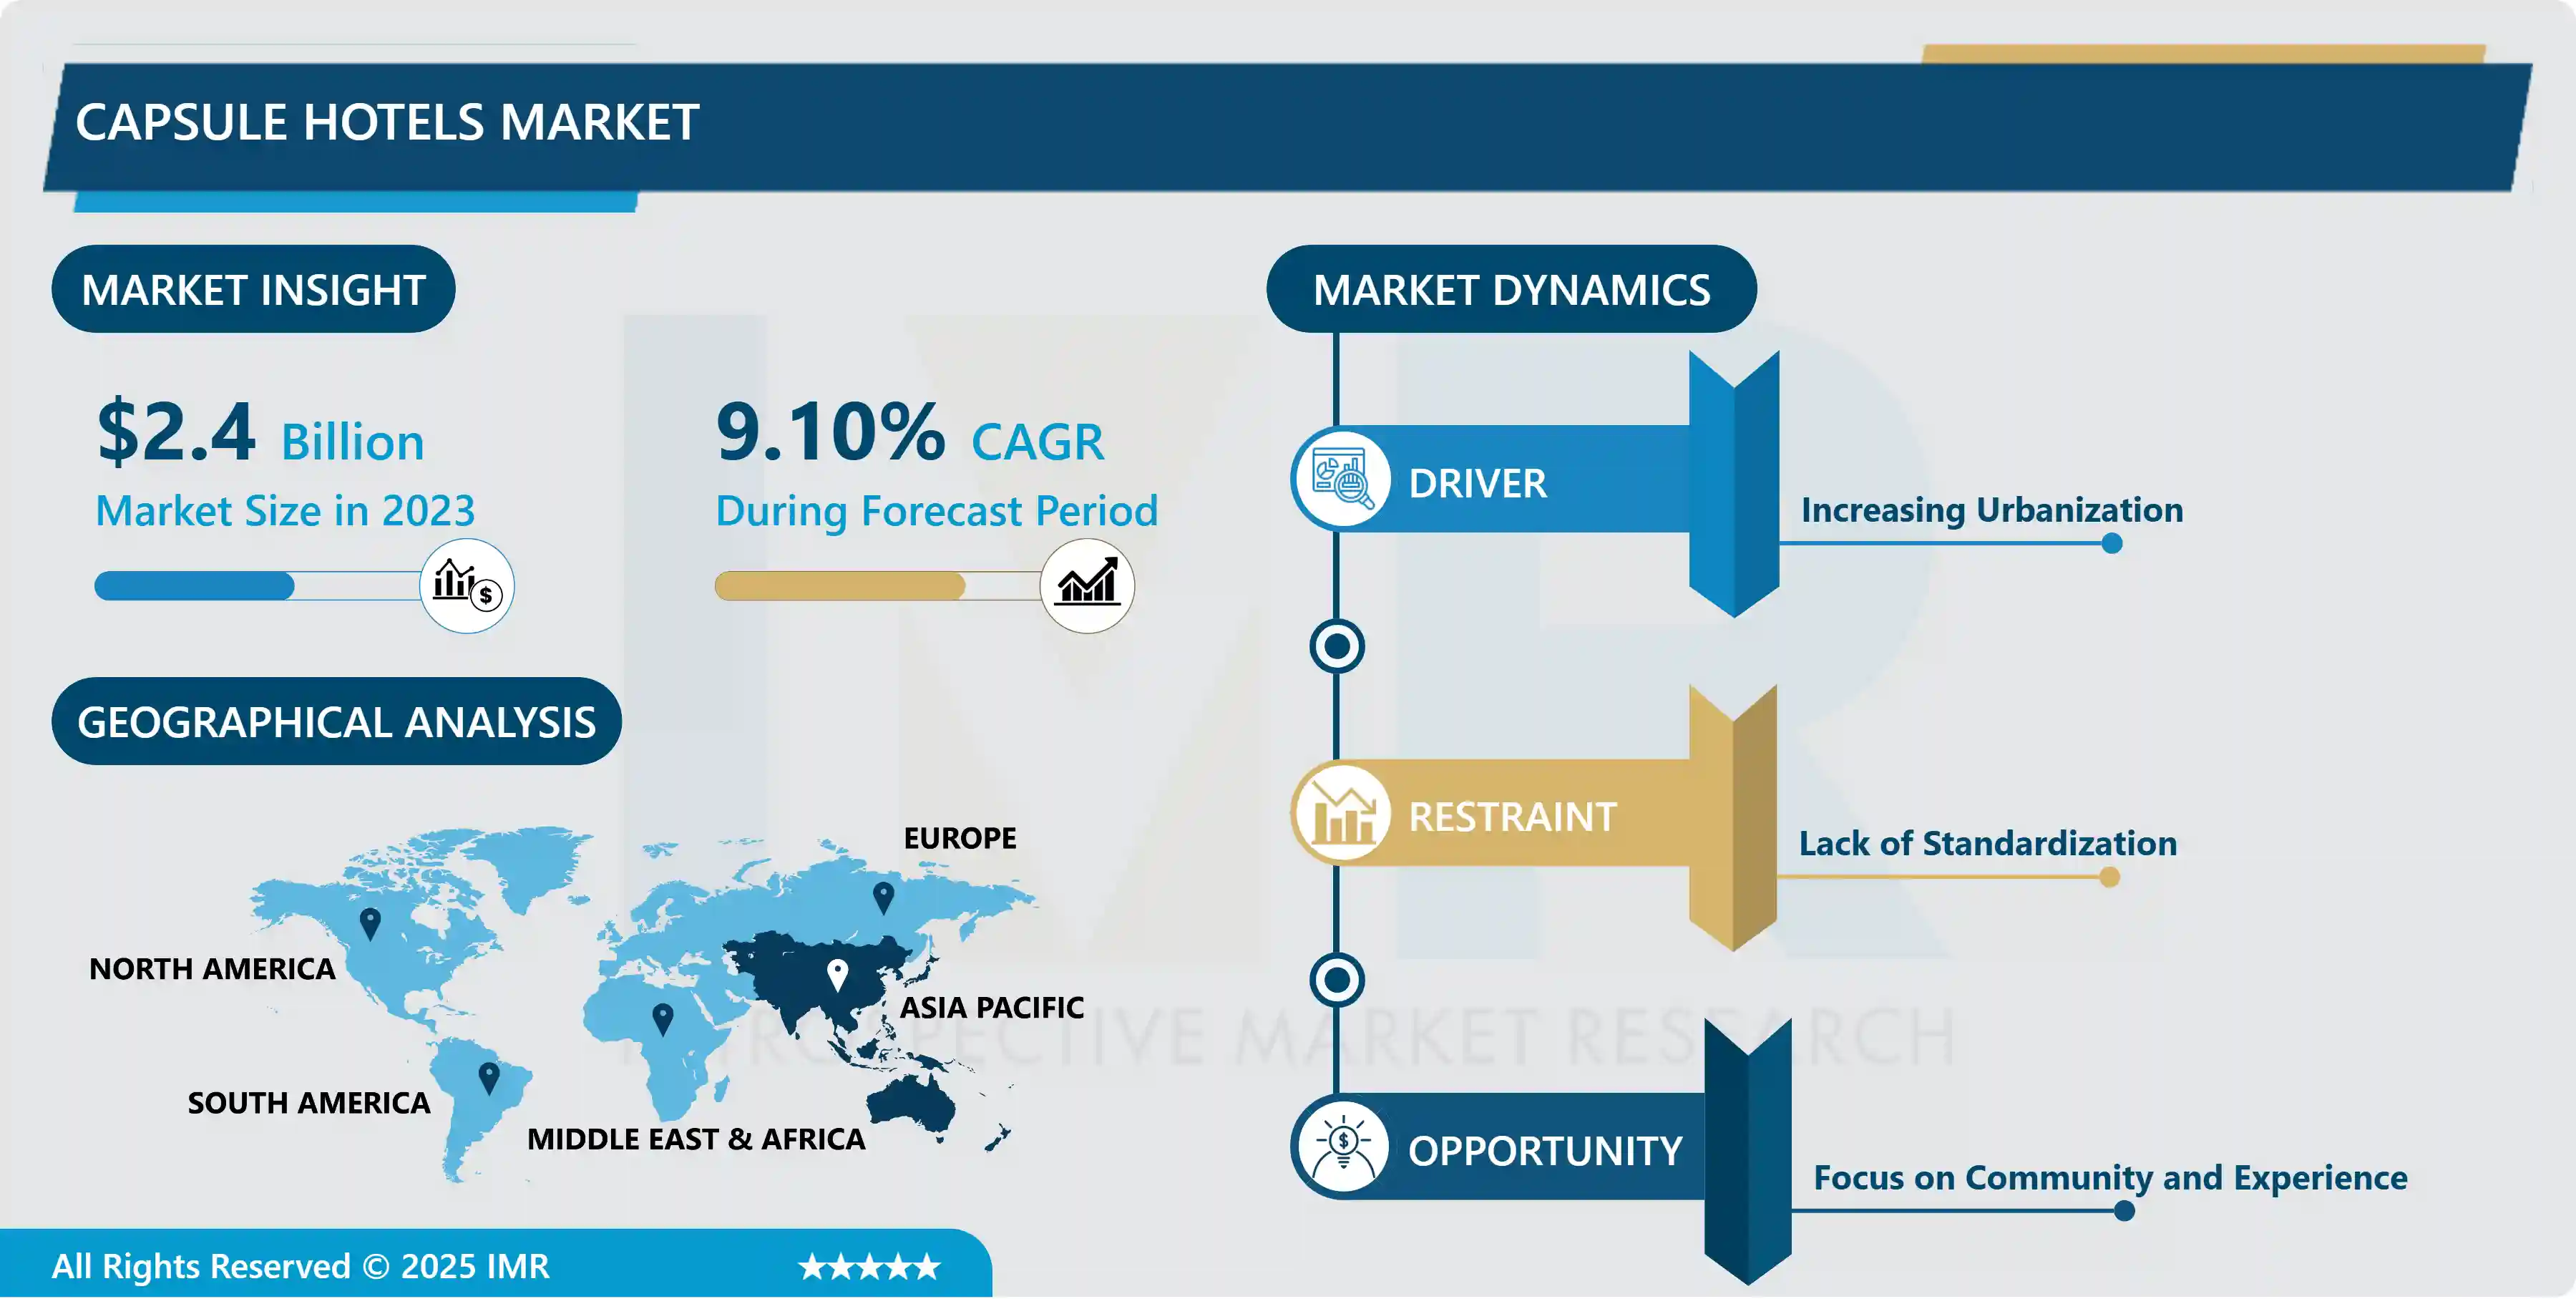
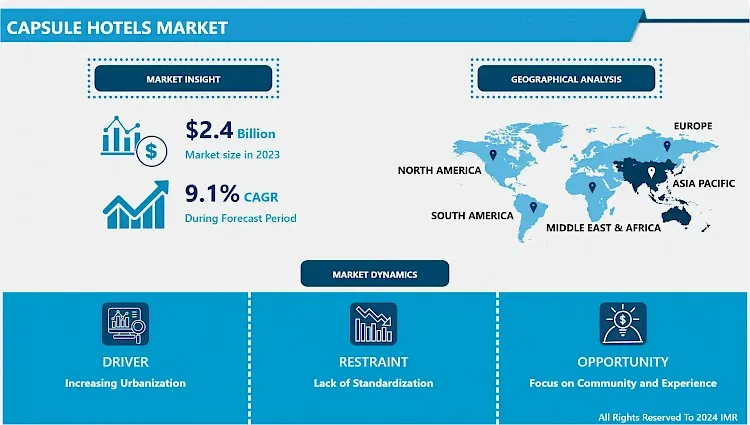
Capsule Hotels Market Size Was Valued at USD 2.4 Billion in 2023, and is Projected to Reach USD 5.3 Billion by 2032, Growing at a CAGR of 9.10% From 2024-2032.
Capsule hotels popularly referred to as pod hotels, are the kind of accommodation that was first experienced in Japan and involves offering guests a minute, effective, and cost-effective accommodation solution. Most of the devices or products are included in every guest room or capsule, and these are the bed, lighting, and power outlets of the room, and sometimes television.
These capsules are usually of cages set side by side and one on top of the other; thus, their compactness. The idea is directed mainly to tourists in search of cheap a place to spend the night, businesspersons who require a simple place to spend a night before morning meetings, and any other individuals who need an affordable place to sleep.
The emergence of capsule hotels is seemingly due to the increasing popularity of affordable and compact hotel rooms for economically motivated business travelers in large cities. These hotels provide the basic amenities including shared facilities such as showers, sitting and dining areas, and even sometimes even kitchens to meet both individual accommodation needs as well as group requirements.
Initially conceived and implemented in Japan, capsule hotels have begun to appear in other regions of Asia and are gradually penetrating Europe and North America. They cater predominantly to individual tourists and business travelers or anybody who is looking for short-term accommodation in large cities as they offer an innovative and functional approach to the problems associated with high prices for lodgings and scarcity of housing space.
Capsule Hotels Market Trend Analysis
Affordability & Space Efficiency
- Based on the key factors affecting capsule hotel services, it is evident that affordability and space efficiency are emerging trends within the service provision system, which makes it more widely appealing to travelers and frequent visitors. A capsule hotel in Japan is a cheaper version of the hotel where primary needs are met and at a cheaper price than other normal hotels.
- This affordability is especially desirable for clients in urban areas where the cost of accommodation is thousands of dollars. As the accommodation provides narrow sleeping spaces that are still comfortable, the capsule hotels target guests who may not be willing to pay high prices for a place to sleep, especially budget travelers like backpackers and solo travelers or short-term travelers like business people. This means that capsule hotels have the kind of economic model that allows them to near to full occupancy and offer fantastic rates thus they can attract customers who are searching to get affordable room rates.
- Another interesting factor that can be seen as one of the reasons for the demand for capsule hotels, is the space-saving solution that the capsule hotels provide. As is expected, hotels located in big cities that experience high population density, have limited space, and this calls for unique architectural styles to be adopted. The pods are generally arranged sequentially, being aligned both vertically and horizontally, in a Tetris-like formation to make efficient use of space.
- This layout enables the accommodation of many guests in the hotel while occupying minimal space, measuring up to the congestion levels of the urban environment. It also does not make the capsules less comfortable or as ineffective for privacy as one might think, because even the compact size of the capsules does not limit the usage of new technologies or contemporary services. It appeals not only to tourists interested in moving around the city center of a country or nation but also such stakeholders like urban planners and developers of limited-space city areas.
Themed and Upscale Capsule Hotels
- It emerges that although new capsule hotels are still important in their niche market, themed and upscale capsule hotels are valuable as they are targeted at significantly different customers. While the basic concept of capsule hotels is focused on providing minimal and affordable accommodations in terms of space, it is possible to develop new variations like themed capsule and upper-scale capsule facilities which will be appealing to travelers who prefer distinct and exceptional experiences.
- While some of them provide only sleeping places, the themed capsule hotels – designed, for instance, as sci-fi, natural, or with motifs of different cultures – create an additional attractive atmosphere to stay in. Such configurations can translate into being a competitive advantage in an oversaturated market to attract tourists who are seeking the aesthetic appeal of picture-worthy hotels or a unique experience.
- Luxury capsule hotels are types of provisions that are more inclined towards the container hotels for those, who seek comfort in capsule hotels but do not wish to compromise more on the standards or classy expectations. These hotels use superior quality bed clothing, bathroom accessories, entertainment systems, etc and it is more private than traditional hotels.
- Luxury amenities may also involve privileges that are not available to the general public or other clients such as private facilities that contain resting areas, spas, and quality restaurants. Therefore, it is possible to note that by providing these premium services, the createStore’s upscale capsule hotels possess strong potential to appeal to business travelers, tourists, and all people, who are looking for top-tier, compact accommodation at the same time. This segment of the market often can pay more to hotel services and it’s leading to higher revenues that can be expected from the capsule hotels business for operators and investors involved, apart from targeting only low-budget tourists, capsule hotels can become more attractive to other categories of consumers.
Capsule Hotels Market Segment Analysis:
Capsule Hotels Market is Segmented based on Traveler Type, Booking Mode, Age Group, and Region.
By Traveler Type, the Individual is expected to dominate the market during the forecast period
- It cannot be argued that individual traveling type constitutes a large proportion of the capsule hotels market influenced greatly by the dynamics and appeal of the capsule form of hotels. As such, Capsule hotels are quite ideal for solo travelers who do not mind so much about the size of their rooms or the number of amenities available to them as long as they can find a cheap place to lay their heads for the night that is easily accessible and flexible enough to accommodate modifications in their travel plans.
- These travelers are usually in search of simple lodging facilities that will offer them the basic comforts of human incongruity without asking for more space or extra facilities. Capsule hotels fit this profile to a T because they are slender sleeping spaces that most frequently include the necessities a person needs for sleeping and charging digital gadgets such as a bed, light source, and an electrical outlet. Particularly, capsule hotels, as mentioned above, are very popular among independent travelers, budget tourists, digital nomads, and other independent traveling enthusiasts making for the core target audience group of such services.
- However, they might also include group travelers and it is safe to say that they still form a small portion of travelers. The facilitators who travel in groups i. e. the family, friends, or a group that is on an organized trip may require spacious rooms and areas where the group can congregate and relax when not out on trips.
- Despite all that, capsule hotels can still boast of their ability to host group tourists by providing dormitory-styled capsules or by arranging subsequent capsules with adjacent interiors. However, it is indisputable that individual travelers predominate in the capsule hotels business considering the approaches to their advert, services, and general service provision are suited to cater to the needs of one client that prefers cheap and efficient accommodation services.
By Applications, the adhesives, paints, and coatings segment held the largest share in 2023
- The online booking mode has emerged as the most popular segment of the capsule hotels market, which shows that the traditional traveling process and reservation options are shifting towards the digital environment.
- Internet-based travel accommodation agencies have more advantages than traditional ones, as they provide more choices, availability, and just-in-time service for tourists, which include capsule hotels. Currently, by use of a smartphone or a computer, travelers can easily search for different capsule hotels or make a booking given the range of prices and customer reviews from respective hotels. This has greatly helped skyrocket the market for capsule hotels as it gave guests the ease and opportunity to search and book for a hotel that fits their pocket, taste, and schedule. Moreover, travel websites and apps that enable bookings are commonplace for providing promotions and discounts, reward programs, and generally, intuitive interfaces, which all create a positive attitude among travelers towards the booking process.
- Comparable to the status stated above, it is evident that offline booking techniques like the walk-in option or calling directly to make a reservation are no longer popular as they used to be, but rather widely used with the help of online booking platforms. Offline bookings can be explained by the geographic distribution of accommodations and services or by the nature of individual travelers who are likely to book services off-line.
- Nevertheless, the ability to make a booking online and with less time when compared to other methods makes this way one of the most popular among travelers, especially, those who are going to book capsule hotels which are quite popular among the thrifty and solitary travelers. Consequently, the practice of booking online is now the most popular way of making a reservation for capsule hotel accommodations, which in turn increases the opportunities for expansion and development of this kind of service for consumers and business owners in the sphere of the hotel industry.
Capsule Hotels Market Regional Insights:
Asia Pacific is Expected to Dominate the Market Over the Forecast period
- As established earlier, the Asia-Pacific region commands the largest market share of capsule hotels and this can be explained by the following factors; Originally, new ideas of economy public hotels, specifically the so-called ‘capsule hotels,’ were developed in the Asia-Pacific region, especially in Japan, in the 1970s to address the issues of population density and emerging needs of such urban environment. It was supported by early adoption and embracing of innovation enabling capsule hotels to spread widely in the region.
- Moreover, a majority of cities in the Asia-Pacific region are large urban centers with sparse availability of space and high costs of properties, a factor that puts pressure on hotel owners and tenants alike to optimize space. Capsule hotels help to solve the problem of the limited availability of space in these cities due to high-rise constructions, where the area is utilized to its full extent, thus, towering capsule hotels can accommodate numerous sleeping capsules at the same time.
- In addition, the mindset of the people in Asia-Pacific countries to accept new ideas and the general adoption of innovative ideas have also supported the growth of capsule hotels. Japan, for instance, South Korea, as well as Singapore are nations that are quite progressive in terms of technology and design; the systematic of these themed and upscale capsule hotels is a reflection of the strategic imperative of covering as many categories of targets as possible.
- Furthermore, the increased visitor arrivals, the booming solo and backpacker tourism in Asia-Pacific, and the ability of capsule hotels to offer affordable but otherwise distinctive accommodations for tourists curb the market’s growth and lead to its expansion in the same region. Combined with these factors, has established this region as the market leader for capsule hotels and anticipates more diversification and proliferation in the years ahead.
Active Key Players in the Capsule Hotels Market
- The Millennials Tokyo (Japan)
- Nine Hours (Japan)
- First Cabin (Japan)
- Anshin Oyado (Japan)
- 9h Nine Hours (Japan)
- Capsule Inn Osaka (Japan)
- 9 Hours Capsule Hotel Narita Airport (Japan)
- The Prime Pod Kyoto (Japan)
- Urban Pods (Singapore)
- The Pod Boutique Capsule Hotel (Singapore)
- Cube Boutique Capsule Hotel (Singapore)
- COO Boutique Hostel (Singapore)
- Wink Capsule Hostel (Singapore)
- Space Capsule Hotel (China)
- Capsule Hotel Smart Stay (China)
- SleepBox Hotel (Russia)
- Capsule Hotel Q (South Korea)
- MyCube by MYLO Hotel (Malaysia)
- The POD @ Beach Road Boutique Capsule Hotel (Singapore)
- Time Capsule Retreat (Malaysia), Other Key Players
Key Industry Developments in the Capsule Hotels Market:
- In October 2021, Urban Pod Pvt Ltd. declared to form a tie-up with IRCTC to float Pod concept cabins at Mumbai Central railway station, including 30 usual Pods, 7 for females alone, 10 enclosed Pods, and one for the crippled.
|
Capsule Hotels Market |
|||
|
Base Year: |
2023 |
Forecast Period: |
2024-2032 |
|
Historical Data: |
2017 to 2023 |
Market Size in 2023: |
USD 2.4 Bn. |
|
Forecast Period 2023-32 CAGR: |
9.10% |
Market Size in 2032: |
USD 5.3 Bn. |
|
Segments Covered: |
By Traveler Type |
|
|
|
By Booking Mode |
|
||
|
By Age Group |
|
||
|
By Region |
|
||
|
Key Market Drivers: |
|
||
|
Key Market Restraints: |
|
||
|
Key Opportunities: |
|
||
|
Companies Covered in the report: |
|
||
Chapter 1: Introduction
1.1 Scope and Coverage
Chapter 2:Executive Summary
Chapter 3: Market Landscape
3.1 Market Dynamics
3.1.1 Drivers
3.1.2 Restraints
3.1.3 Opportunities
3.1.4 Challenges
3.2 Market Trend Analysis
3.3 PESTLE Analysis
3.4 Porter's Five Forces Analysis
3.5 Industry Value Chain Analysis
3.6 Ecosystem
3.7 Regulatory Landscape
3.8 Price Trend Analysis
3.9 Patent Analysis
3.10 Technology Evolution
3.11 Investment Pockets
3.12 Import-Export Analysis
Chapter 4: Capsule Hotels Market by Traveler Type (2018-2032)
4.1 Capsule Hotels Market Snapshot and Growth Engine
4.2 Market Overview
4.3 Group
4.3.1 Introduction and Market Overview
4.3.2 Historic and Forecasted Market Size in Value USD and Volume Units
4.3.3 Key Market Trends, Growth Factors, and Opportunities
4.3.4 Geographic Segmentation Analysis
4.4 Individual
Chapter 5: Capsule Hotels Market by Booking Mode (2018-2032)
5.1 Capsule Hotels Market Snapshot and Growth Engine
5.2 Market Overview
5.3 Offline
5.3.1 Introduction and Market Overview
5.3.2 Historic and Forecasted Market Size in Value USD and Volume Units
5.3.3 Key Market Trends, Growth Factors, and Opportunities
5.3.4 Geographic Segmentation Analysis
5.4 Online
Chapter 6: Capsule Hotels Market by Age Group (2018-2032)
6.1 Capsule Hotels Market Snapshot and Growth Engine
6.2 Market Overview
6.3 Generation X
6.3.1 Introduction and Market Overview
6.3.2 Historic and Forecasted Market Size in Value USD and Volume Units
6.3.3 Key Market Trends, Growth Factors, and Opportunities
6.3.4 Geographic Segmentation Analysis
6.4 Generation Y
6.5 Generation Z
Chapter 7: Company Profiles and Competitive Analysis
7.1 Competitive Landscape
7.1.1 Competitive Benchmarking
7.1.2 Capsule Hotels Market Share by Manufacturer (2024)
7.1.3 Industry BCG Matrix
7.1.4 Heat Map Analysis
7.1.5 Mergers and Acquisitions
7.2 APPLE INC. (USA)
7.2.1 Company Overview
7.2.2 Key Executives
7.2.3 Company Snapshot
7.2.4 Role of the Company in the Market
7.2.5 Sustainability and Social Responsibility
7.2.6 Operating Business Segments
7.2.7 Product Portfolio
7.2.8 Business Performance
7.2.9 Key Strategic Moves and Recent Developments
7.2.10 SWOT Analysis
7.3 AUDIBLE MAGIC CORPORATION (USA)
7.4 CLARIFAI INC. (USA)
7.5 DIGIMARC CORPORATION (USA)
7.6 GOOGLE LLC (ALPHABET INC.) (USA)
7.7 GRACENOTE (USA)
7.8 IBM CORPORATION (USA)
7.9 KT CORPORATION (SOUTH KOREA)
7.10 KUDELSKI GROUP (SWITZERLAND)
7.11 MICROSOFT CORPORATION (USA)
7.12 NUANCE COMMUNICATIONS INC. (USA)
7.13 OTHER KEY PLAYERS
Chapter 8: Global Capsule Hotels Market By Region
8.1 Overview
8.2. North America Capsule Hotels Market
8.2.1 Key Market Trends, Growth Factors and Opportunities
8.2.2 Top Key Companies
8.2.3 Historic and Forecasted Market Size by Segments
8.2.4 Historic and Forecasted Market Size by Traveler Type
8.2.4.1 Group
8.2.4.2 Individual
8.2.5 Historic and Forecasted Market Size by Booking Mode
8.2.5.1 Offline
8.2.5.2 Online
8.2.6 Historic and Forecasted Market Size by Age Group
8.2.6.1 Generation X
8.2.6.2 Generation Y
8.2.6.3 Generation Z
8.2.7 Historic and Forecast Market Size by Country
8.2.7.1 US
8.2.7.2 Canada
8.2.7.3 Mexico
8.3. Eastern Europe Capsule Hotels Market
8.3.1 Key Market Trends, Growth Factors and Opportunities
8.3.2 Top Key Companies
8.3.3 Historic and Forecasted Market Size by Segments
8.3.4 Historic and Forecasted Market Size by Traveler Type
8.3.4.1 Group
8.3.4.2 Individual
8.3.5 Historic and Forecasted Market Size by Booking Mode
8.3.5.1 Offline
8.3.5.2 Online
8.3.6 Historic and Forecasted Market Size by Age Group
8.3.6.1 Generation X
8.3.6.2 Generation Y
8.3.6.3 Generation Z
8.3.7 Historic and Forecast Market Size by Country
8.3.7.1 Russia
8.3.7.2 Bulgaria
8.3.7.3 The Czech Republic
8.3.7.4 Hungary
8.3.7.5 Poland
8.3.7.6 Romania
8.3.7.7 Rest of Eastern Europe
8.4. Western Europe Capsule Hotels Market
8.4.1 Key Market Trends, Growth Factors and Opportunities
8.4.2 Top Key Companies
8.4.3 Historic and Forecasted Market Size by Segments
8.4.4 Historic and Forecasted Market Size by Traveler Type
8.4.4.1 Group
8.4.4.2 Individual
8.4.5 Historic and Forecasted Market Size by Booking Mode
8.4.5.1 Offline
8.4.5.2 Online
8.4.6 Historic and Forecasted Market Size by Age Group
8.4.6.1 Generation X
8.4.6.2 Generation Y
8.4.6.3 Generation Z
8.4.7 Historic and Forecast Market Size by Country
8.4.7.1 Germany
8.4.7.2 UK
8.4.7.3 France
8.4.7.4 The Netherlands
8.4.7.5 Italy
8.4.7.6 Spain
8.4.7.7 Rest of Western Europe
8.5. Asia Pacific Capsule Hotels Market
8.5.1 Key Market Trends, Growth Factors and Opportunities
8.5.2 Top Key Companies
8.5.3 Historic and Forecasted Market Size by Segments
8.5.4 Historic and Forecasted Market Size by Traveler Type
8.5.4.1 Group
8.5.4.2 Individual
8.5.5 Historic and Forecasted Market Size by Booking Mode
8.5.5.1 Offline
8.5.5.2 Online
8.5.6 Historic and Forecasted Market Size by Age Group
8.5.6.1 Generation X
8.5.6.2 Generation Y
8.5.6.3 Generation Z
8.5.7 Historic and Forecast Market Size by Country
8.5.7.1 China
8.5.7.2 India
8.5.7.3 Japan
8.5.7.4 South Korea
8.5.7.5 Malaysia
8.5.7.6 Thailand
8.5.7.7 Vietnam
8.5.7.8 The Philippines
8.5.7.9 Australia
8.5.7.10 New Zealand
8.5.7.11 Rest of APAC
8.6. Middle East & Africa Capsule Hotels Market
8.6.1 Key Market Trends, Growth Factors and Opportunities
8.6.2 Top Key Companies
8.6.3 Historic and Forecasted Market Size by Segments
8.6.4 Historic and Forecasted Market Size by Traveler Type
8.6.4.1 Group
8.6.4.2 Individual
8.6.5 Historic and Forecasted Market Size by Booking Mode
8.6.5.1 Offline
8.6.5.2 Online
8.6.6 Historic and Forecasted Market Size by Age Group
8.6.6.1 Generation X
8.6.6.2 Generation Y
8.6.6.3 Generation Z
8.6.7 Historic and Forecast Market Size by Country
8.6.7.1 Turkiye
8.6.7.2 Bahrain
8.6.7.3 Kuwait
8.6.7.4 Saudi Arabia
8.6.7.5 Qatar
8.6.7.6 UAE
8.6.7.7 Israel
8.6.7.8 South Africa
8.7. South America Capsule Hotels Market
8.7.1 Key Market Trends, Growth Factors and Opportunities
8.7.2 Top Key Companies
8.7.3 Historic and Forecasted Market Size by Segments
8.7.4 Historic and Forecasted Market Size by Traveler Type
8.7.4.1 Group
8.7.4.2 Individual
8.7.5 Historic and Forecasted Market Size by Booking Mode
8.7.5.1 Offline
8.7.5.2 Online
8.7.6 Historic and Forecasted Market Size by Age Group
8.7.6.1 Generation X
8.7.6.2 Generation Y
8.7.6.3 Generation Z
8.7.7 Historic and Forecast Market Size by Country
8.7.7.1 Brazil
8.7.7.2 Argentina
8.7.7.3 Rest of SA
Chapter 9 Analyst Viewpoint and Conclusion
9.1 Recommendations and Concluding Analysis
9.2 Potential Market Strategies
Chapter 10 Research Methodology
10.1 Research Process
10.2 Primary Research
10.3 Secondary Research
|
Capsule Hotels Market |
|||
|
Base Year: |
2023 |
Forecast Period: |
2024-2032 |
|
Historical Data: |
2017 to 2023 |
Market Size in 2023: |
USD 2.4 Bn. |
|
Forecast Period 2023-32 CAGR: |
9.10% |
Market Size in 2032: |
USD 5.3 Bn. |
|
Segments Covered: |
By Traveler Type |
|
|
|
By Booking Mode |
|
||
|
By Age Group |
|
||
|
By Region |
|
||
|
Key Market Drivers: |
|
||
|
Key Market Restraints: |
|
||
|
Key Opportunities: |
|
||
|
Companies Covered in the report: |
|
||


